How to make good farm expansion decisions
Author: John Francis (Holmes Sackett) | Date: 11 Mar 2015
Take home messages
- An increase in land area can lead to improvements in profit but it requires significant capital investment which can increase risk.
- Expanding the farm area is often seen as the only way of increasing farm profitability. However, this is not the case, as there are usually countless opportunities for improving profitability from the existing area of land.
- Expansion decisions require an understanding of farm business performance and investment analysis. Like any investment decision weighted on profit, expansion decisions should account for the risks and rewards.
- Comparisons with returns of other on farm investments will help to add objectivity in decision making.
The method of expansion – how to expand?
There are two categories of farm expansion and there are a number of methods for expanding within each category.
- Expansion by increasing the area under management. This can occur by; purchasing, leasing or share-farming additional land.
- Expansion by increasing the amount of production from the existing area. This usually occurs by identifying the optimum level of production, establishing how far below the optimum production is currently and implementing a strategy for increasing production.
The choice of expansion method, assuming a profit motive is driving the decision, will depend on the limitations and the goals of the business and the returns and risk of the investment.
Both categories and all methods of expansion usually have a common goal, which is to improve profitability. There may also be a number of other goals which are specific to the expansion method and help to weigh a decision in the favour of one method over another. Similarly, there may be limitations to pursuing one method of expansion over another.
Why expand?
Some motivations or reasons for expansion follow:
Increased operating returns
These come from additional area under management. Increased operating returns from expansion occur by:
- Generating some level of scale advantage relative to the existing business. This means that the marginal overhead costs, or costs of doing business, increase by less than in the existing business per unit of additional area managed.
- Creating more income from the same or lower enterprise costs in the existing business. This means that the marginal production or price is higher than the existing business with a similar or lower cost structure.
- Creating the same level of income from a lower enterprise cost structure in the existing business.
- Creating the same level of income and expenses in the existing business from a lower land value.
The most likely of these is the generation of scale advantages relative to the existing business.
Increase labour efficiency
As in many other businesses, the highest overhead cost in farming is labour. High levels of labour efficiency lower the cost of production. A labour unit is 240 days per year for 8 hours per day. A labour unit consists of all labour utilized on farm including family, contractors, salary earners or casual employees. Labour efficiency can be improved through expansion where existing levels of labour are not matched to optimum levels.
Benchmark levels of labour efficiency are greater than:
- 1,500 hectares per labour unit for crop enterprises.
- 15,000 DSE per labour unit for beef enterprises.
- 7,500 DSE per labour unit for wool enterprises.
- 8,500 DSE per labour unit for lamb enterprises.
These levels of labour efficiency don’t mean that you must have the scale to match a labour unit. If the scale of the business is insufficient for one labour unit spend only that portion of time necessary to manage the business efficiently. For example if 750 hectares of crop is managed it should require no more than half a labour unit to manage it.
Where labour efficiency is not matched to the benchmark levels then opportunities for improvement exist. Contrary to popular belief, expansion is not the only way to improve labour efficiency. Farming the existing area and either working off farm or using machinery for contracting elsewhere can achieve the same goal. The more time spent generating revenue off-farm the lower the opportunity cost of labour on farm.
Timeliness of operations is still a critical management issue and should not be foregone to generate a few extra dollars off farm. The cost of lost production due to poor timing of management events usually exceeds the benefit of generating income off-farm.
Where labour efficiency is already at optimum levels then additional labour will be required to manage any additional area. Managers in this position will not achieve the same levels of scale advantage as will those who have a pre-existing labour inefficiency
Increase machinery efficiency
In cropping intensive businesses, where machinery is owned, depreciation can be a major overhead expense. Spreading the machinery plant over the maximum number of hectares keeps the cost of machinery low. The maximum number of hectares for machinery is dictated by the width of machinery, the speed of travel and the area allowing for timely operational management.
Where there is spare or latent machinery capacity, expansion allows for an increase in profit by spreading overheads over more hectares. Additional plant, or upgrading to wider machinery, may be necessary when expanding if plant is already at capacity and this will add to the additional capital invested and the overhead costs on each additional hectare.
Planning for succession
Expansion is often seen as the solution when additional family members are looking for entry into the agricultural industry. Another family labour unit earning a living from a farm business should generate another $350,000 in gross profit. If 40% of this is retained as net profit at a target return of 6% then another $2.3 million in asset value is required to sustain the labour unit. The issues in such a situation are the ability to fund and secure the investment and the ability to repay bank debt if this is the proposed funding source.
Increase capital growth (create wealth)
The safe part of the total return in agriculture is the capital growth of land. Land accounts for around 80% of the total asset value. In expansion situations it could be as high as 95% if additional plant and equipment or livestock is not necessary. Provided the investment period is a long term horizon then rates of capital growth of around 6% are not unreasonable expectations. Rates of capital growth for agricultural land can be volatile with increases of over 40% in a single year being recorded in the last decade. Such spikes are often followed by long periods of low rates of growth bringing things back to the average.
Land expansion through purchasing provides the opportunity to create additional wealth via capital growth in the land. Given that history shows capital growth in agricultural land is assured over the long term then investment in land seems a sure bet. This may be the case but the fact that the purchase of agricultural land is so capital intensive is one factor preventing investment. The other is that the operational returns may be inadequate to cover a completely debt funded land purchase. Business managers looking at this approach to expansion must have additional funds in reserve to support the after-interest losses of the farm.
Leasing and sharefarming do not provide the capital growth opportunities delivered by purchasing as the land is not owned under such arrangements.
Improved utilisation of existing skills
Improved utilization of existing skills may be a good reason to expand. As with labour and machinery efficiency, expansion can provide an opportunity to improve skill utilization or efficiency. There may also however be a range of other ways to use existing skills thus assessing all of the options is important.
In order for an adviser to assess whether the farm business manager has skills worth applying to an expansion opportunity some sort of assessment must be conducted. Comparing the financial and production performance of the businesses managed by the operator over time is a useful method of assessment.
When to expand?
The time for expansion depends on the interaction between the following factors:
- The motivation for expansion,
- the proposed expansion method, and;
- the ability to fund the expansion.
If there is no ability to fund the expansion, regardless of the method or motivation then there is no appropriate time to expand. There may however be ways of expanding production on the existing area at no cost. For example, improving the timing of management events such as sowing or spraying in a cropping program costs nothing but can lead to significant production and associated profit gains.
If the proposed method for expansion is land purchase, the motivation for expansion is to become a land baron and capital is non-limiting then there is no time imperative for expansion.
If the expansion method is land purchase and the decision is driven primarily by capital growth then the timing will be dependent on perceived value and speculation or the position taken on future capital growth.
Scale – is it a case of get big or get out?
Holmes Sackett benchmarking data has been used to analyse the issue of operating scale.
Mixed and grazing farms with over 8 years of benchmarking data have been categorised by asset value. The data presented are presented as simple averages. The variation within a group is much larger than the variation between groups. It is difficult therefore to draw rigid conclusions about profitability based on the total assets of a business.
Some businesses in the data set may have land value influenced by factors that have no relationship to its productive capacity. This usually relates to farms located close to cities where land value is influenced by real estate, rather than productive value.
The results, shown in Figure 1, demonstrate that for grazing farms there is a trend beyond $4 million dollars in asset value for farm profitability to decline as asset value increases. While this doesn’t conclusively suggest that the ideal size of grazing farms for optimising profitability is under $4 million dollars it does suggest that farms with high asset value don’t necessarily provide greater profitability.
The highest level of profitability for mixed farms is seen at $2-4 million and again at $8-10 million dollars in asset value. It is possible that the wave effect of low and high profitability for different asset values is a function of machinery efficiency and scale advantages for optimum plant size.
That is, the optimum area for a single farming plant may equate to the area represented by an asset value of $4 million dollars. Doubling the farming plant with insufficient area reduces profitability as the overheads of the second plant are spread over too few hectares. The theory is that profitability increases again above $8 million dollars worth of assets as this is the area that provides optimum machinery efficiency for two machinery plants.
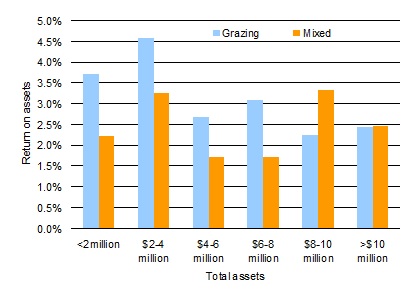
Figure 1. Bigger farms are not necessarily more profitable.
The key point is that there is no evidence from a long history of benchmarking results that increasing farm size leads to increased profits. Scale advantages are achieved to a point and then decline beyond that point. The point at which scale advantages decline is a function of labour and machinery efficiency.
Small farm businesses can achieve high levels of labour efficiency by matching labour and machinery to the size of the business. A small farm should not be expected to sustain a whole labour unit, particularly if it generates less than $350,000 in gross profit. Corporate scale does not appear to have any profit advantage over large sized family farm businesses.
Case study 1 – land purchase
Consider a manager with average farm financial performance who owns 1000 hectares. The features of the business under its existing structure are as follows:
- Historical return on assets managed is 3%.
- Land value is $3,750 per hectare.
- Land represents 80% of the total asset base.
- Current equity equates to 80%.
- The weighted average cost of borrowings is 8.5%.
- The historical rate of capital gain has been 6%.
An opportunity has come up to purchase 150 hectares adjoining the existing farm. The price of the additional land is the same as the value of the existing land plus on costs of an estimated 4%. The production potential has been assessed and it is assumed to be similar to the existing farm.
The steps for assessing the opportunity are as follows:
- Assess the productive potential of the land so that a comparison of production relative to the existing business can be made.
- Calculate the extent of the scale advantages offered through the expansion opportunity. Scale advantages are achieved as a result of fewer additional overhead expenses being incurred for every additional hectare managed.
- Calculate the additional capital required. This includes assessment of additional capital for the land, livestock, plant and equipment and operating expenditure.
- Calculate the return on investment to establish whether the projected return is commensurate with the additional risk.
The productive potential is assumed to be the same on the proposed expansion as it is in the existing business. An additional $50 per hectare will be required for overhead expenses on every additional hectare for items such as insurance, rates and labour. No additional capital apart from that required for land is necessary as the land will be suited to cropping and the existing plant will have the capacity to conduct the work.
Table 1. Completely debt funding this expansion opportunity leads to lower profits after funding costs.
|
Expansion tool (fixed area) – can I afford to expand? |
|||
|---|---|---|---|
|
Area to be purchased (hectares) |
150 |
|
|
|
Area % existing area |
13% |
|
|
|
Tax rate |
30% |
|
|
|
Rate of capital gain |
6% |
|
|
|
Interest rate |
8.50% |
|
|
|
Land as % existing asset value |
80% |
|
|
|
Land purchase on costs |
4% |
|
|
|
Operating costs ($/ha) |
$300 |
|
|
|
Average % year overdraft required |
75% |
|
|
|
Number of years in cash flow |
5 |
|
|
|
|
Existing business |
Proposed purchase |
Existing plus proposed |
|
Land value ($/ha) |
$3,750 |
$3,750 |
|
|
Overhead expenses ($/ha) |
$150 |
$50 |
|
|
Lease cost ($/ha) |
|
$0 |
|
|
Non land asset value ($/ha) |
$938 |
$0 |
|
|
Land capital |
$3,750,000 |
$585,000 |
$4,335,000 |
|
Non land asset value |
$937,500 |
$0 |
$937,500 |
|
Total asset value |
$4,687,500 |
$585,000 |
$5,272,500 |
|
Return on assets managed |
3.0% |
6.2% |
|
|
Land area (ha) |
1000 |
150 |
1150 |
|
Equity |
80% |
0% |
71% |
|
Net asset value |
$3,750,000 |
$0 |
$3,750,000 |
|
Operating capital |
$450,000 |
$52,500 |
$502,500 |
|
Net liabilities |
$937,500 |
$637,500 |
$1,575,000 |
|
Annual interest and lease costs |
$70,125 |
$53,072 |
$123,197 |
|
Profit EBIT |
$140,625 |
$36,094 |
$176,719 |
|
Interest cover |
2.0 |
0.7 |
1.4 |
|
Profit after interest and lease |
$70,500 |
-$16,978 |
$53,522 |
|
Tax |
$21,150 |
-$5,093 |
$16,057 |
|
Profit after interest and tax |
$49,350 |
-$11,885 |
$37,465 |
|
Value of capital gain |
$225,000 |
$35,100 |
$260,100 |
|
Total wealth created |
$274,350 |
$23,215 |
$297,565 |
The outcome
The Holmes Sackett expansion tool, which will be available to participants in the GRDC updates on Holmes Sackett’s website, has been used to assess the opportunity. The first column of Table 1 shows the financial features of the existing business. The second column, titled proposed purchase, shows the marginal financial features of the purchase. The final column shows the financial features of the business as a whole.
The tool shows that the marginal return on additional assets is 6.2%, far higher than in the existing business.
This occurs partly because the marginal profit per hectare is higher as a function of fewer overhead expenses, but also because the only additional assets required for purchase were the land assets. This would not be the case if the expansion opportunity was a grazing enterprise as additional capital would be required for livestock.
While the return on assets is high over the additional area, the additional area only represents a small proportion of the total area under management thus it has the effect of raising the average return from 3% to 3.4%.
The analysis shows negative marginal tax paid on the additional area. Assuming an average tax rate of 30%, this adjustment for total tax is made in the combined column.
The following questions and their answers, provided by the tool, are provided below:
|
Will the expansion opportunity? |
|
Amount: |
|---|---|---|
|
Reduce equity? |
Yes |
9% |
|
Increase debt? |
Yes |
$637,500 |
|
Increase annual interest costs? |
Yes |
$53,072 |
|
Increase profit (EBIT)? |
Yes |
$36,094 |
|
Increase profit after interest and tax? |
No |
-$11,885 |
|
Increase wealth? |
Yes |
$23,215 |
The key issues that are raised as a result of the analysis are as follows:
- Due to the fact that the purchase is completely debt financed the additional profit before interest and tax is lower than the additional debt. This results in a cash shortfall in the business. This is offset by additional capital growth but the capital growth doesn’t fund the cash shortfall.
- The level of equity falls by 9% to leave the business at 71% equity after the purchase. At the current level of profitability this may be inadequate to provide the desired level of security and comfort to the financier.
- Interest cover, the ratio of pre-interest and tax profit to interest, falls from a ratio of 2 to 1 to 1.4 to 1. This occurs because the level of debt increases by more than the profit. This will be of concern to a financier as the business will be exposed to losses in drought. For example if returns fall to 1% in a drought then the loss after interest costs increases from $11,900 to $54,000.
- Does the reduction in cash income still provide sufficiently for the needs of the business? Capital re-investment and provisioning for retirement and family commitments are important considerations. If the reduction in profit doesn’t allow for these needs then alternatives to expansion should be considered in the short term.
- The investment generates a 9% internal rate of return on the marginal capital invested. This is a return that reflects the level of risk in the investment. That is, a large proportion of the total return comes from capital growth of the land. This part of the return is considered a low risk return.
Case study 2 - leasing
Consider the same manager with the same business is faced with an opportunity to lease 150 hectares adjoining the existing farm. The price of the lease is $150 per hectare. The production potential has been assessed and it is assumed to be similar to the existing farm. The steps for assessing the opportunity are no different to the purchase case study.
The productive potential is assumed to be the same on the proposed expansion as it is in the existing business. An additional $50 per hectare will be required for overhead expenses on every additional hectare for items such as insurance, rates and labour. No additional capital apart from that required to fund the lease and operating cost is required as the land will be suited to cropping and the existing plant will have the capacity to conduct the work.
Table 2. Leasing provides scale benefits but lease costs erode returns
|
|
Existing business |
Proposed purchase |
Existing plus proposed |
|---|---|---|---|
|
Land value ($/ha) |
$3,750 |
$3,750 |
|
|
Overhead expenses ($/ha) |
$150 |
$50 |
|
|
Lease cost ($/ha) |
|
$150 |
|
|
Non land asset value ($/ha) |
$938 |
$0 |
|
|
Land capital |
$3,750,000 |
$585,000 |
$4,335,000 |
|
Non land asset value |
$937,500 |
$0 |
$937,500 |
|
Total asset value |
$4,687,500 |
$585,000 |
$5,272,500 |
|
Return on assets managed |
3.0% |
6.2% |
|
|
Land area (ha) |
1000 |
150 |
1300 |
|
Equity |
80% |
0% |
78% |
|
Net asset value |
$3,750,000 |
$0 |
$3,675,000 |
|
Operating capital |
$450,000 |
$75,000 |
$525,000 |
|
Net liabilities |
$937,500 |
$75,000 |
$1,012,500 |
|
Annual interest and lease costs |
$70,125 |
$27,281 |
$97,406 |
|
Profit EBIT |
$140,625 |
$36,094 |
$176,719 |
|
Interest cover |
2.0 |
1.3 |
1.8 |
|
Profit after interest and lease |
$70,500 |
$8,813 |
$79,313 |
|
Tax |
$21,150 |
$2,644 |
$23,794 |
|
Profit after interest and tax |
$49,350 |
$6,169 |
$55,519 |
|
Value of capital gain |
$225,000 |
$0 |
$225,000 |
|
Total wealth created |
$274,350 |
$6,169 |
$280,519 |
The outcome
Table 2 demonstrates that there is no difference in the profit before lease relative to the purchase analysis. That is, the same benefits are achieved as a function of increased scale. The things that differ are the debt required to fund the lease, the associated equity of the business after funding, the profit after financing and lease costs and the lack of capital gain.
The following questions and their answers, provided by the tool, are provided below:
|
Will the expansion opportunity? |
|
Amount: |
|---|---|---|
|
Reduce equity? |
Yes |
2% |
|
Increase debt? |
Yes |
$75,000 |
|
Increase annual interest costs? |
Yes |
$27,281 |
|
Increase profit (EBIT)? |
Yes |
$36,094 |
|
Increase profit after interest and tax? |
Yes |
$6,169 |
|
Increase wealth? |
Yes |
$6,169 |
The key issues that are raised as a result of the analysis are as follows:
- The lease of the same area of land, relative to purchase, requires far less capital thus interest costs are low. An additional cost in leasing however is incurred and this has a significant influence on the profit after accounting for the lease cost.
- The profits of the business exceed the interest and lease costs thus the cash position is improved.
- The scale improvements of the additional leased area ($100 per hectare), are more than offset by the additional cost of leasing $150 per hectare thus the profit per hectare, after leasing costs have been accounted for, is inferior to the existing business.
- The up-front cost of leasing is $75,000 including operating and lease costs and the annual profit after lease is $13,600. This represents an internal rate of return of 28% which is well above the cost of capital.
- There is no capital gain thus 100% of the returns come from the operating part of the business.
- Leasing under these assumptions generates a return of 18%, which is approximately 10% above the cost of capital. A key question that arises from this analysis is whether the returns are adequate. That is, the analysis assumes that a return on the value of marginal assets managed of 6.2%. If this falls to 5% then the internal rate of return falls to 8.7%. Lowering the lease rate or improving management are factors that will increase the return on investment.
Case study 3 – improving production from the existing area
Consider the same manager with the same business now looks at his existing system and realizes that there are opportunities for improving profitability on the existing area. This is evident by looking at the historical annual return, 3%, and comparing it with the top 20% who achieve over 5%.
The manager has identified that improvement in timing of operations could deliver an additional 0.5% return while investment into additional inputs will deliver another 0.5% return. This might be additional nitrogen in a cropping enterprise or additional livestock in a grazing enterprise.
The outcome is an increase in income from the same area of $111 (up 19%) per hectare at a cost of $60 per hectare (up 20%). Overhead expenses do not increase on the additional area at all thus the marginal profit is $51 per hectare.
Table 3. Improving productivity from the existing area generates the greatest wealth
|
|
Existing business |
Proposed purchase |
Existing plus proposed |
|---|---|---|---|
|
Land value ($/ha) |
$3,750 |
$0 |
|
|
Overhead expenses ($/ha) |
$150 |
$0 |
|
|
Lease cost ($/ha) |
|
$0 |
|
|
Non land asset value ($/ha) |
$938 |
$100 |
|
|
Land capital |
$3,750,000 |
$0 |
$3,750,000 |
|
Non land asset value |
$937,500 |
$100,000 |
$1,037,500 |
|
Total asset value |
$4,687,500 |
$100,000 |
$4,787,500 |
|
Return on assets managed |
3.0% |
4.0% |
|
|
Land area (ha) |
1000 |
0 |
0 |
|
Equity |
80% |
0% |
77% |
|
Net asset value |
$3,750,000 |
$0 |
$3,590,000 |
|
Operating capital |
$450,000 |
$60,000 |
$510,000 |
|
Net liabilities |
$937,500 |
$160,000 |
$1,097,500 |
|
Annual interest and lease costs |
$70,125 |
$12,325 |
$82,450 |
|
Profit EBIT |
$140,625 |
$50,875 |
$191,500 |
|
Interest cover |
2.0 |
4.1 |
2.3 |
|
Profit after interest and lease |
$70,500 |
$38,550 |
$109,050 |
|
Tax |
$21,150 |
$11,565 |
$32,715 |
|
Profit after interest and tax |
$49,350 |
$26,985 |
$76,335 |
|
Value of capital gain |
$225,000 |
$0 |
$225,000 |
|
Total wealth created |
$274,350 |
$26,985 |
$301,335 |
The outcome
The increase in before-interest and tax profit of $51,000, as a result of improving management from the same area, exceeds the profit generated from spreading average management over more area ($36,000). An additional $100 per hectare has been allowed to invest in more livestock to increase stocking rate and an additional $60 per hectare has been allocated to improve soil fertility.
This additional $160,000 debt results in an additional $12,325 in interest payments per year. The total wealth created from this scenario, assuming an average tax rate of 30%, is $27,000. This exceeds the wealth created from purchasing or leasing.
The following questions and their answers, provided by the tool, are provided below:
|
Will the expansion opportunity? |
|
Amount: |
|---|---|---|
|
Reduce equity? |
Yes |
3% |
|
Increase debt? |
Yes |
$160,000 |
|
Increase annual interest costs? |
Yes |
$12,325 |
|
Increase profit (EBIT)? |
Yes |
$50,875 |
|
Increase profit after interest and tax? |
Yes |
$26,985 |
|
Increase wealth? |
Yes |
$26,985 |
The key issues that are raised as a result of the analysis are as follows:
- The additional wealth created from improving management was greater than leasing or purchasing and required quarter of the additional capital necessary in purchasing.
- The associated reduction in equity was only 3% relative to a reduction in equity of 9% with purchasing.
- The interest cover of the business increases from a ratio of 2:1 to 2.3:1.
- The internal rate of return from improving management, equates to 30% over a ten year period, which significantly exceeds the purchasing options and is slightly superior to leasing.
Comparison of expansion options
A comparison of the outcomes from each of the case studies presented is shown in Figure 2. The graph demonstrates that purchasing has the greatest interest cost due to the cost associated with the land purchase. The operating profit with purchasing is negative but the wealth created is $23,000 indicating that the difference between the two has come from capital gain.
The cost of the lease is included in financing costs thus this option has the next highest financing cost behind land purchasing. The profit (EBIT) just exceeds the financing costs and there is no wealth created from capital gain thus the wealth created is small in comparison with land purchasing.
Increasing productivity has the lowest financing costs and increases the profit by the greatest percentage. This leads to the greatest profit after financing and tax. Even without capital gain this option provides the greatest wealth creation of the three options. This demonstrates that there is more to be gained from getting the business humming on the existing area before expanding average management over a greater area.
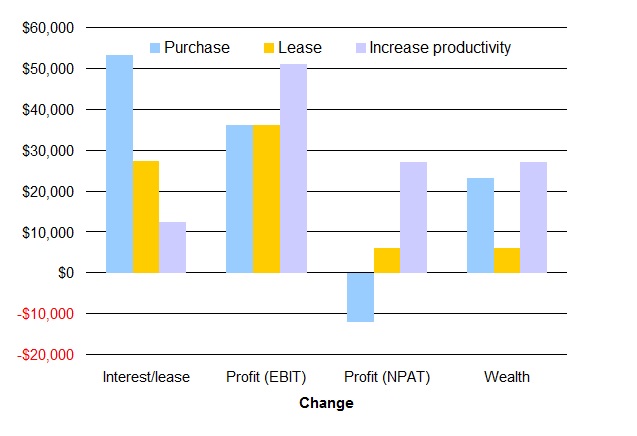
Figure 2. Increasing productivity generates the greatest wealth
What to do?
Figure 3 shows the internal rate of return or return on investment from each option. The land purchase is assumed to be a 30 year investment, the lease a 5 year investment and the increasing productivity a 10 year investment. The returns from investing in increasing productivity and leasing exceed those of purchasing. Purchasing is unlikely to ever deliver returns on par with those of leasing or increasing productivity because the returns relative to the amount of capital required for investment are always likely to be lower. Purchasing is however a lower risk investment than the alternatives due to the relatively assured capital gain over time.
Pursuit of the increased productivity, provided the risks do not present a barrier, should be the priority. The change in management can be proven over the existing area and then expanded by purchasing or leasing. This will deliver additional profits which can be invested as equity when the expansion occurs. It will also deliver far greater returns from the expansion investment options when they occur in the future due to increased returns from improved management.
The outcome of this analysis is dependent on the production and financial performance of the manager looking to expand. This is not a one size fits all outcome however the process will deliver sensible results provided there is adequate accounting for the changes between business operators. The ability to assess the financial performance of a business and to identify realistic opportunities for increasing profitability are critical in making a sensible expansion decision.
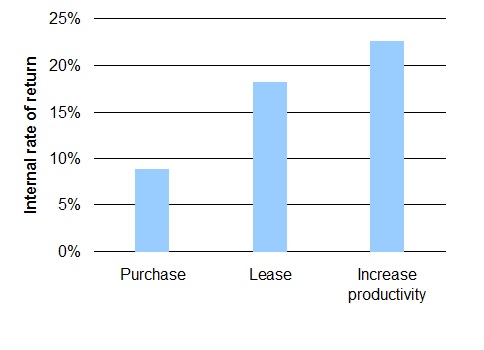
Figure 3. Increasing productivity generates the greatest return on investment
Summary
These analyses demonstrate the complexity associated with what appears to be a simple question in “should I expand?”. The outcome of these analyses is completely dependent on the assumptions. The assumptions that have the greatest bearing on the outcome of the analysis include:
- The management ability of the operator,
- the productivity of the expansion opportunity,
- the extent of the scale advantages achieved,
- any additional costs that may be incurred, and;
- the level of borrowings required to undertake the expansion.
The assessment of the relative returns of each of the investments provides an objective framework for decision making. The decision will come down to the assessment of risk relative to the return. On strict economic terms, under the assumptions in these case studies, investment into increasing productivity is the solution. As profitability of the existing business increases however the outcome will change. It is therefore important to understand the limitations of the business being analysed. Demonstration of the extent of the downside can also assist clients to make decisions as it provides an understanding of the possible worst case scenario outcome.
An important point for advisers is to understand their limitations of experience in making recommendations regarding expansion. A thorough understanding of the production system as well as the financial situation of the business is absolutely critical in providing good advice. With agricultural expansion there is usually a lot of capital at play.
Key Questions
Should farms expand?
Why, when and how – which option in which circumstance
Is it a case of get big or get out?
What must be taken into consideration when making business decisions regarding expanding the farm?
Key outcomes/key learnings:
Do farms need to expand over time to remain profitable?
Expansion over time is not necessary to remain profitable. Matching the overhead cost structure to the scale of the business and generating optimum production is the key to remaining profitable. If the business is not of sufficient scale to sustain a full time labour unit this doesn’t mean that the business can’t be profitable, it just means that the business should match the labour input to the labour requirement.
What needs to be taken into consideration in respect to farm expansion decision making?:
- The current level of management and financial performance. It might be more cost effective to improve management on the existing business than to expand.
- The ability to finance and provide security for the proposed expansion.
- The management ability of the operator. Outcomes are highly sensitive to management performance.
- The extent of the improvements in scale. These come from improved labour and machinery efficiency and a lower marginal overhead cost structure. The extent of scale advantages will depend on the existing level of machinery and labour efficiency, the proximity to the existing farm and other factors influencing the marginal overhead expenses.
- The level of changes in production that may occur on additional land. The price of the expansion opportunity should reflect differences in productivity relative to the farm.
- The goals of the expansion. If the goal is increased wealth creation and the expansion opportunity doesn’t achieve this then the expansion shouldn’t occur.
What are the opportunities and benefits for farm expansion?
Farm expansion, if well managed, improves profitability, profit and wealth creation. The rate at which all of these occur is dependent on management and the ability to finance the expansion opportunity. In order to achieve this interest cover ratios should be maintained at a level that reflects the risk profile of the manager. Land purchase opportunities are low risk investments due to the level of capital gain likely to be achieved over the long term.
What are the risks associated with undertaking farm expansion?
The risks in undertaking farm expansion are the losses that can be incurred as a result of:
- A run of poor seasons,
- poor management leading to lower than projected returns,
- additional debt exceeding additional profits, and;
- low rates of capital growth.
Any analysis should demonstrate the downside risk so that managers are aware of the extent of the losses that could be incurred and develop an exit strategy before expanding.
A comment on luck
There is an element of luck involved in land purchasing. There are countless situations where average managers have put a lot at risk and been rewarded as a result of a great run of seasons or phenomenal rates of capital growth. Similarly, there are situations where good managers, have expanded at the wrong time, copped a run of poor seasons and low capital growth and have been forced to liquidate additional assets at significant cost.
Contact details
John Francis
Holmes Sackett
john@holmessackett.com.au
Was this page helpful?
YOUR FEEDBACK