Optimising grain yield and grazing potential of dual-purpose crops
Author: Susie Sprague, Julianne Lilley, John Kirkegaard, John Graham and Lindsay Bell (CSIRO Flagship), Alex Murray (Kalyx Young) | Date: 26 Aug 2015
Take home messages
- Early sowing with a suitable maturity type for the sowing date maximises forage and grain potential.
- Timing of lock-up and residual biomass influence grain yield recovery in wheat and canola.
- Leave >1.5 t/ha residual biomass in spring canola and >2.5-3.0 t/ha residual biomass for winter canola at stem elongation for 2.5-3.5 t/ha grain yield.
- Leave >0.5 t/ha residual biomass at stem elongation (GS30) for wheat for 4-5 t/ha grain yield.
- If grazing beyond stem elongation, manage stock to protect developing reproductive structures and leave more residual biomass to avoid a yield penalty.
- Ultimately, economics (forage vs grain value) will dictate the acceptable level of grain yield loss.
Background
Dual-purpose crops can capitalise on early sowing opportunities and provide grazing for livestock and grain yield. The period of grazing can increase net crop returns by up to $500/ha (i.e. 2000 sheep grazing days at 25c/day) and have a range of systems benefits including weed management, reduced crop height and reduced grazing pressure on pastures.
Grazing mostly has little impact on yield, but yield increases or decreases can occur. Yield increases occur under seasonal conditions where smaller crop canopies conserve soil water and fill grain more in dry seasons. Yield losses (compared to ungrazed crops) occur in crops grazed after the “safe” stem elongation period (GS30 in cereals or stem elongation in canola) but can also occur when crops are grazed heavily in the “safe” period (Figure 1). This can occur if flowering is delayed, but also if the residual biomass at lock-up does not allow the crop to recover a critical biomass at flowering to reach a target yield potential.
Grain yield potential in both wheat and canola is set around the time of flowering and hence biomass levels at this stage set the upper yield that is possible. Actual yield levels depend on seasonal conditions after lock-up, but if a target yield is nominated, grazing can be managed so residual biomass is sufficient for the crop to attain the critical flowering biomass to achieve that target yield. Such an approach also allows crops to be grazed during a “sensitive” stage after reproductive stem elongation. During this period crops can be grazed without yield penalty, as long as reproductive structures are not removed and residual biomass is sufficient to reach critical flowering biomass to achieve target yield.
We present results of recent experiments that explore the link between residual biomass, critical anthesis biomass and target grain yield. We then discuss the implications for grazing management of dual-purpose crops to maximise their yield recovery and the economics of yield loss vs forage are also explored.
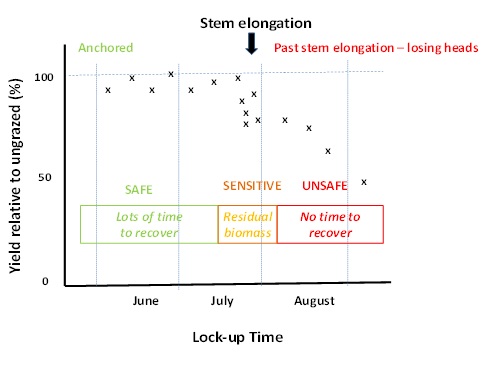
Figure 1. Yield recovery (% of ungrazed crop) of grazed dual-purpose crops highlighting the safe, sensitive and unsafe periods of grazing. Yield recovery from grazing during the sensitive period is affected by residual biomass at lock-up. Late grazing reduces time for grain yield recovery.
Methodology
Experiments were conducted at Greenethorpe, NSW, in 2013 and 2014 using a range of grazing/defoliation intensities and lock-up times to explore their impact on yield recovery in wheat and canola cultivars with different maturities (Table 1). In 2013 the crops followed lucerne and had 287 mm of rainfall (Apr-Oct) after 88 mm in March, and a very dry spring. In 2014, the crops followed wheat or canola and had 333 mm of growing season rainfall (Apr-Oct) after 95 mm in March but again experienced very dry spring conditions. In both seasons, crops largely filled grain on stored soil water.
Table 1. Summary of rainfall, sowing dates and cultivars in experiments at Greenethorpe, NSW.
| Year | GSR (Apr-Oct) | Wheat cultivars | Canola cultivars | ||
|---|---|---|---|---|---|
| 2013 | 287mm | Wedgetail | 25 March | Hyola®971CL |
25 March |
| Gregory | 8 May | Hyola®575CL |
23 April | ||
| 2014 | 333mm | Wedgetail | 15 March | Hyola®971CL |
15 March |
| Gregory | 28 April | - | - | ||
Results and discussion
Wheat - 2013
Early sown Wedgetail provided much more grazing (2200 sheep grazing days/ha) than the later sown spring cultivar Gregory (800 sheep grazing days/ha), with no significant yield loss (see bold lines in Table 2). Overall in 2013, Wedgetail was a more profitable dual-purpose option than Gregory due to more grazing and higher grain yield (4.4 t/ha) but Gregory still provided significant grazing opportunities (Table 2).
Table 2. Amount of grazing achieved, residual biomass and grain yield recovery in different defoliation treatments in Wedgetail winter wheat sown 25 March and Gregory spring wheat sown 8 May at Greenethorpe, NSW in 2013. Optimal economic outcomes relative to ungrazed are highlighted in grey.
| Variety | Lock-up time | Defoliation intensity | Seep grazing days/ha | Residual DM (t/ha) | Anthesis biomass (t/ha) | Grain yield (t/ha) | Relative economics ($/ha) |
|---|---|---|---|---|---|---|---|
| Wedgetail 5 March |
Ungrazed | 12.9 | 4.35 | ||||
| GS30 (2 Jul) |
Hard | 1730 | 1.1 | 9.9 | 4.36 | +653 | |
| GS32 (15 Jul) |
Clip | 220 | 1.4 | 12.4 | 4.19 | +785 | |
| Moderate | 2530 | 0.9 | 7.6 | 3.96 | +853 | ||
| Hard | 2730 | 0.6 | 7.8 | 3.28 | +758 | ||
| 15 Jul | Triple (+GS14+30) | 2000 | 0.2 | 6.7 | 3.47 | +530 | |
| Gregory 8 May |
Ungrazed | 11.0 | 3.58 | ||||
| GS14 | Hard | 200 | 0.1 | 9.2 | 3.67 | +98 | |
| GS30 (15 Jul) |
Hard | 270 | 0.2 | 9.1 | 3.69 | +128 | |
| GS32 (30 Jul) |
Moderate | 670 | 0.6 | 9.0 | 3.91 | +331 | |
| Hard | 800 | 0.4 | 8.9 | 3.45 | +268 | ||
Economics calculated at $250/t grain and grazing at $0.38/sheep grazing day (i.e. $1.7/kg LW for a sheep growing at 225g/day and eating 1.5kg biomass/d).
Ungrazed Wedgetail yielded 4.4 t/ha from an anthesis biomass of 12.9 t/ha, but due to the dry spring, this was more biomass than needed to achieve that target yield in 2013 (Fig 2A). In the grazed treatments, less residual biomass at lock-up led to reduced anthesis biomass (Figure 2B). However all of the “safe” defoliation treatments (residual biomass 0.2 - 2.7 t/ha) reached 6.7 to 12.4 t/ha of anthesis biomass (Fig 2B), for the same yield as the ungrazed (Fig 2A). Thus it appears that ~7 t/ha was the critical anthesis biomass to reach the target yield for Wedgetail in 2013.
Defoliation treatments in the “sensitive” stage on 15 July (GS32) with greater residual biomass (clip and moderate treatments) also reached the critical biomass. In contrast, the hard defoliation treatment on the same date (circled in Figure 2A) suffered a 25% reduction in grain yield despite reaching the critical biomass presumably due to the removal of heads and delayed flowering. The triple cut treatment that was defoliated three times during the “safe” period had insufficient residual biomass (0.2 t/ha) to reach the critical anthesis biomass and suffered a 20% yield penalty despite the fact that no heads were removed.
In contrast to Wedgetail, the Gregory sown on May 8 suffered no yield penalties under any defoliation treatment (Fig 2A, Table 2). All had sufficient residual biomass to reach the critical anthesis biomass for the target yield, even those which were imposed at the “sensitive” stage and had low levels of residual biomass (Table 2, Fig 2B). The seasonal conditions with a dry spring limited the target yield of the uncut treatment to 3.6 t/ha which had smaller grain than defoliated crops (data not shown). Under different seasonal conditions with higher target yield, larger yield penalties from late and intense defoliation, may be likely.
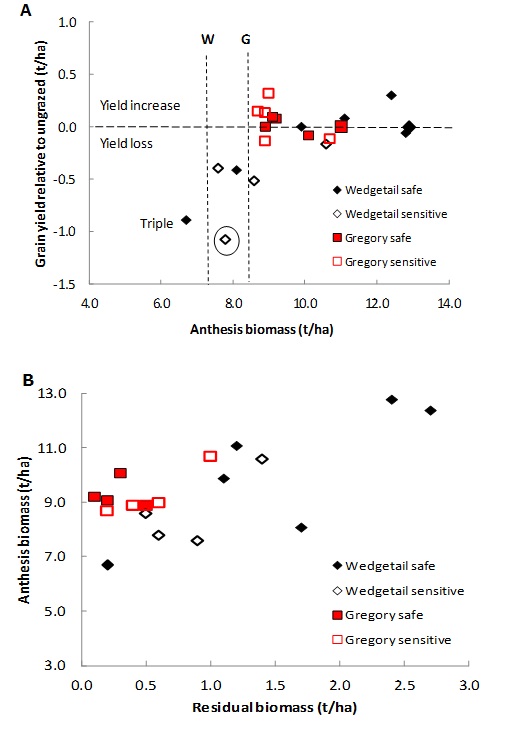
Figure 2. Anthesis biomass of defoliation treatments in relation to (A) residual biomass at lock-up and (B) subsequent relative grain yield (t/ha) for Wedgetail (diamond, W) sown 25 March and spring wheat Gregory (square, G) sown 8 May in experiments at Greenethorpe, NSW, in 2013. Defoliation treatments in the ‘safe’ window are indicated by closed symbols and those in the ‘sensitive’ window by open symbols. Dashed vertical lines indicate critical anthesis biomass for each cultivar to maintain yield similar to ungrazed controls (larger symbols). Circled symbols show treatment that recovered critical anthesis biomass but had reduced yield due to removal of spikes.
Wheat - 2014
A very warm autumn generated more biomass for grazing in 2014 than 2013. The March-sown Wedgetail provided more grazing (4000 sheep grazing days/ha) than the later sown Gregory (1050 sheep grazing days/ha) in treatments with no yield penalty (bold lines in Table 3). Overall Wedgetail was a more profitable dual-purpose option than Gregory due to more grazing, despite lower grain yield (3.2 t/ha). However, significant grazing was still achieved from the later-sown Gregory (Table 3).
Table 3. Amount of grazing achieved, residual biomass and grain yield recovery in different defoliation treatments in Wedgetail winter wheat sown 15 March and Gregory spring wheat sown 28 April at Greenethorpe, NSW in 2014. Optimal economic outcomes relative to ungrazed are highlighted in grey.
| Variety | Lock-up time | Defoliation intensity | Seep grazing days/ha | Residual biomass (t/ha) | Anthesis biomass (t/ha) | Grain yield (t/ha) | Economic benefit ($/ha) |
|---|---|---|---|---|---|---|---|
| Wedgetail 15 March |
Ungrazed | |
11.0 |
3.15 |
|||
| GS30 (18 Jun) |
Hard | 2870 | 1.0 | 8.8 | 3.35 | +1136 | |
| GS32 (22 Jul) |
Moderate | 2330 | 1.8 | 8.8 | 3.84 | +1057 | |
| Hard - heads remain | 2700 | 1.3 | 7.3 | 3.10 | +1011 | ||
| Hard - heads removed | 2990 | 0.8 | 7.2 | 2.73 | +1025 | ||
| 30 Jul | Double hard (+GS30) - heads remain | 3990 | 0.7 | 8.3 | 3.50 | +1594 | |
| Gregory 28 April |
Ungrazed | 11.0 |
3.58 |
||||
| GS30 (8 Jul) |
Hard | 1070 | 0.5 | 9.5 | 4.68 | +382 | |
| GS32 (22 Jul) |
Moderate | 800 | 1.5 | 10.1 | 4.85 | +321 | |
| Hard - heads remain | 1390 | 0.6 | 7.6 | 3.94 | +316 | ||
| Hard - heads removed | 1520 | 0.4 | 6.2 | 3.65 | +291 | ||
| Double hard (+GS30) - heads remain |
1330 | 0.4 | 6.1 | 3.22 | +113 | ||
Economics calculated at $250/t grain and grazing at $0.38/sheep grazing day (i.e. $1.7/kg LW for a sheep growing at 225g/day and eating 1.5kg biomass/d)
The ungrazed Wedgetail yielded only 3.15 t/ha from a biomass at flowering of 11.0 t/ha, probably due to a combination of early virus infection (seed was treated, but a foliar application was also required) and water stress due to excessive water use during the long vegetative period early in the season. As in 2013, all treatments, except those where heads were removed, recovered to reach the critical biomass at anthesis (<7.0 t/ha) to achieve the target yield of the ungrazed treatment (Table 3, Figure 3A).
Grazing treatments imposed at the later “sensitive” stage with similar residual biomass had lower anthesis biomass than treatments imposed at the “safe” stage (compare open and closed symbols in Fig 3B). The hard grazing treatment on 22 July at GS32 where heads were removed (circled in Figure 3A) again suffered a reduction in grain yield despite achieving the critical anthesis biomass.
The ungrazed Gregory yielded 4.8 t/ha with 11.8 t/ha biomass at anthesis which was more than the ~8.5 t/ha required to achieve the target yield (Fig 3A). The hard defoliation at the “safe” stage on 8 July (0.5 t/ha residual biomass) and moderate defoliation at the “sensitive” stage on 22 July (1.5 t/ha residual biomass) recovered to produce more than the critical anthesis biomass and achieved the target yield (Table 3, Figure 3). Hard defoliation treatments at the “sensitive” stage with <0.6 t/ha residual biomass (even where the spike was not removed) recovered insufficient anthesis biomass (<7.6 t/ha) and the target yield was not achieved.
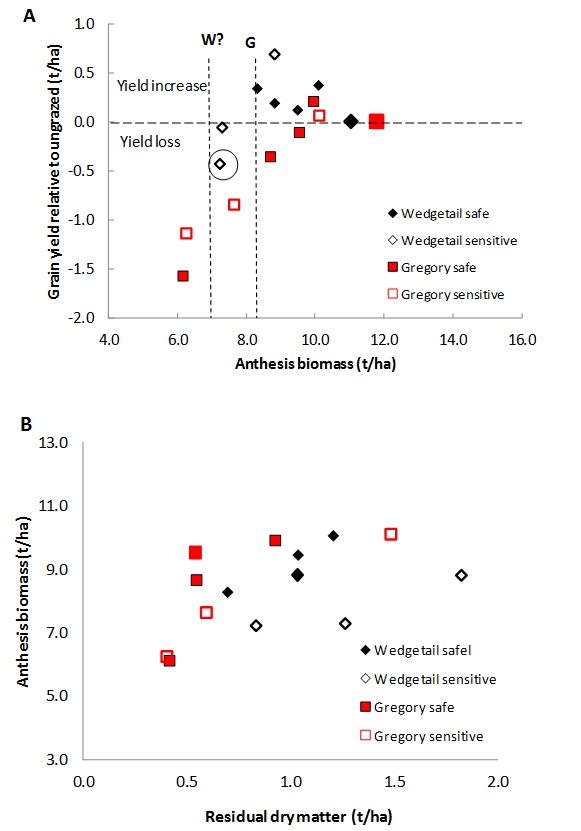
Figure 3. Anthesis biomass of defoliation treatments in relation to (A) residual biomass levels at lock-up and (B) subsequent grain yield relative to ungrazed for Wedgetail (diamond, W) sown 15 March and spring wheat Gregory (square, G) sown 28 April in experiments at Greenethorpe, NSW, in 2014. Defoliation treatments in the ‘safe’ window are indicated by closed symbols and those in the ‘sensitive’ window by open symbols. Dashed vertical lines indicate critical anthesis biomass for each cultivar to maintain yield similar to ungrazed controls (larger symbols). Circled symbols show treatment that recovered critical anthesis biomass but had reduced yield due to removal of spikes.
Wheat – summary of residual biomass for target yield
Across both seasons, experimental results suggest that >0.5 t/ha residual biomass for crops locked-up prior to stem elongation (GS30) is sufficient for crops to recover critical anthesis biomass of ~8t/ha for a target grain yield of ~4-5 t/ha. If crops are grazed after stem elongation, manage stock so that heads are not removed and leave more residual biomass for crops to recover critical anthesis biomass and avoid yield loss. A higher critical anthesis biomass may be needed in crops or seasons with higher target yield, and in these situations defoliated crops may not be able to ‘catch up’.
Canola - 2013
The winter canola Hyola®971CL sown in March provided significantly more grazing (2500 sheep grazing days) than the spring canola Hyola®575CL sown one month later (700 sheep grazing days) in treatments with no yield penalty (bold lines in Table 4). Overall, the earlier-sown winter canola was economically advantageous with equal yield (2.8 t/ha) but more grazing than the spring type (Table 4).
Table 4. Amount of grazing achieved, residual biomass and grain yield recovery in different defoliation treatments in Hyola®971CL winter canola sown 25 March and Hyola®575CL spring canola sown 23 April at Greenethorpe in 2013. Optimal economic outcomes relative to ungrazed are highlighted in grey.
| Variety | Lock-up time | Cuttiong intensity treatment | Seep grazing days/ha | Residual DM (t/ha) | Anthesis biomass (t/ha) | Grain yield (t/ha) | Relative economics ($/ha) |
|---|---|---|---|---|---|---|---|
| Hyola 971CL 25 March |
Ungrazed | 13.3 | 2.79 | ||||
| 6-8 leaf (7 May) |
Hard | 600 | 0.4 | 9.8 | 2.90 | +275 | |
| BV (19 June) |
Hard | 2070 | 1.2 | 6.8 | 2.44 | +618 | |
| BV10 (24 Jul) |
Hard | 1600 | 3.0 | 7.5 | 2.55 | +492 | |
| BV20 (6 Aug) |
Double (+6-8lf) |
2530 | 3.6 | 6.8 | 2.77 | +941 | |
| Double (+BV) |
2600 | 1.9 | 5.4 | 2.43 | +813 | ||
| Triple (+6+8lf+BV) |
2930 | 1.6 | 6.1 | 2.37 | +911 | ||
| Moderate | 1270 | 5.3 | 8.2 | 2.88 | +516 | ||
| Hard | 3000 | 2.7 | 5.2 | 2.44 | +968 | ||
| Gregory 8 May |
Ungrazed | 6.7 | 2.82 | ||||
| 6-8 leaf (17 Jul) |
Hard | 470 | 0.2 | 3.7 | 2.55 | +54 | |
| BV (24 Jul) |
Moderate | 130 | 1.2 | 5.1 | 3.01 | +136 | |
| Hard | 530 | 0.6 | 3.7 | 2.29 | -39 | ||
| BV10 (30 Jul) |
Moderate | 730 | 1.0 | 5.7 | 2.78 | +257 | |
| Hard | 930 | 0.7 | 3.6 | 1.99 | -24 | ||
| BV20 (6 Aug) |
Light | 270 | 3.1 | 6.0 | 2.58 | -8 | |
| Hard | 870 | 1.2 | 4.9 | 2.02 | -35 | ||
Economics calculated at $450/t grain and grazing at $0.38/sheep grazing day (i.e. $1.7/kg LW for a sheep growing at 225g/day and eating 1.5kg biomass/d)
The ungrazed winter canola generated 13.3 t/ha anthesis biomass, but only ~6.5 t/ha was required in grazed treatments to achieve the same yield (Figure 4A). As in the winter wheat, there was a positive relationship between residual and anthesis biomass (Figure 4B). Yield penalties of ~20% occurred when crops were severely defoliated (<3.0 t/ha residual biomass) at both the “safe” and “sensitive” stages (Table 4) as they failed to reach critical anthesis biomass (Fig 4A,B). Less severe defoliation treatments with more residual biomass (>3.0 t/ha) achieved the critical anthesis biomass (>6.5 t/ha) to reach the target yield (Figure 4B). In contrast to the cereals, yield penalties were evident from hard defoliation which occurred before stem elongation or bud visible (equivalent of GS30 in cereals). The hard defoliation treatment at bud visible (BV) resulted in a 20% yield penalty (treatment circled in Figure 4A) despite recovering critical anthesis biomass.
The ungrazed spring canola generated 6.7 t/ha anthesis biomass (50% of the winter canola) but only ~5 t/ha was required to achieve the same yield (Figure 4). Again, there was a positive relationship between residual and anthesis biomass (Figure 4A), and hard defoliation treatments at both the “safe” and “sensitive” stages with <1.2 t/ha residual biomass failed to reach critical anthesis biomass or target yield. In contrast, treatments with >1.5 t/ha residual biomass reached the critical anthesis biomass and no yield penalty.
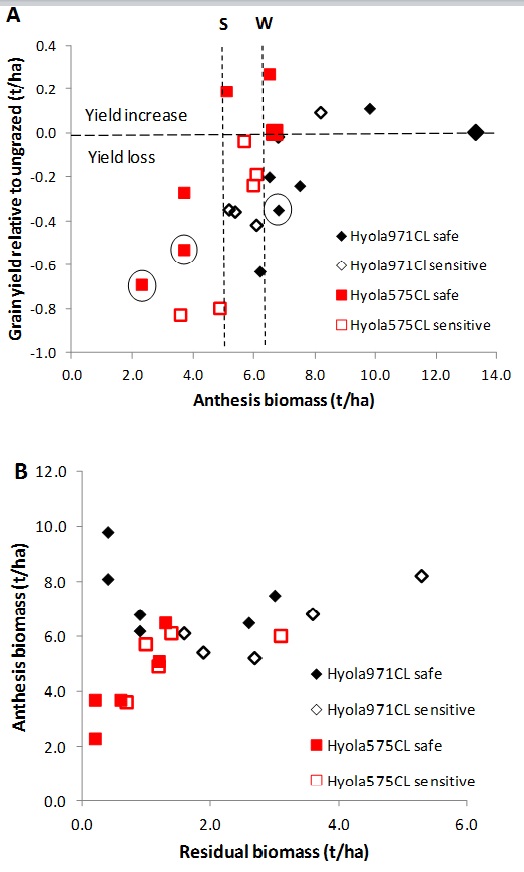
Figure 4. Anthesis biomass of defoliation treatments with a range of residual biomass levels (A) and subsequent relative grain yield (% of ungrazed) (B) achieved in winter canola Hyola®971CL (diamond, W) sown 25 March and spring canola Hyola®575CL (square, S) sown 23 April in experiments at Greenethorpe, NSW, in 2013. Defoliation treatments in the ‘safe’ window are indicated by closed symbols and those in the ‘sensitive’ window by open symbols. Dashed vertical lines indicate critical anthesis biomass for each cultivar to maintain yield similar to ungrazed controls (larger symbols). Circled symbols show hard treatments at bud visible that had reduced yield.
Canola - 2014
The March sown winter canola provided 2700 sheep grazing days/ha with little or no yield penalty (bold line in Table 5) but all grazing treatments in the spring cultivar reduced grain yield. As in the winter wheat, the grain yield of the ungrazed winter canola (2.4 t/ha) was ~50% that of the spring canola (5.0 t/ha) presumably related to water stress due to a long vegetative period early in the season, but also potentially N-limited (see comments below).
Table 5. Amount of grazing achieved, residual biomass and grain yield of different defoliation treatments in Hyola®971CL winter canola sown 15 March and Hyola®575CL spring canola sown 16 April at Greenethorpe in 2014. Optimal economic outcomes relative to ungrazed are highlighted in grey.
| Variety | Lock-up time | Cuttiong intensity treatment | Seep grazing days/ha | Residual DM (t/ha) | Anthesis biomass (t/ha) | Grain yield (t/ha) | Relative economics ($/ha) |
|---|---|---|---|---|---|---|---|
| Hyola 971CL 15 March |
Ungrazed | 8.4 | 2.36 | ||||
| 15 Apr | Hard | 320 | 0.2 | 9.4 | 2.63 | +244 | |
| 21 May | Hard | 2780 | 0.6 | 7.5 | 2.10 | +930 | |
| 10 Jun | Moderate | 800 | 2.0 | 8.4 | 1.86 | +81 | |
| 30 Jul | Hard | 1430 | 2.3 | 5.7 | 2.36 | +540 | |
| 6 Aug | Moderate | 1780 | 2.5 | 6.2 | 2.23 | +612 | |
| Hard | 1840 | 2.4 | 7.2 | 2.09 | +572 | ||
| 13 Aug | Light | 1030 | 2.9 | 7.0 | 2.48 | +443 | |
| Hyola 575CL 16 April |
Ungrazed | 5.0 | 4.96 | ||||
| 5 Jun | Hard | 650 | 0.3 | 2.6 | 3.67 | -331 | |
| 8 Jul | Hard | 1100 | 0.6 | 3.2 | 3.09 | -424 | |
| Light | 810 | 1.3 | 3.5 | 3.35 | -417 | ||
| 22 Jul | Moderate | 970 | 1.1 | 3.5 | 2.84 | -586 | |
| Hard | 1160 | 0.8 | 3.1 | 2.50 | -666 | ||
| 30 Jul | Hard | 2020 | 0.6 | 2.2 | 2.13 | -509 | |
Economics calculated at $450/t grain and grazing at $0.38/sheep grazing day (i.e. $1.7/kg LW for a sheep growing at 225g/day and eating 1.5kg biomass/d)
In the winter canola, there was 8.4 t/ha anthesis biomass with a critical biomass of <5.7 t/ha required to achieve the target grain yield of 2.4 t/ha (Fig 5A). There was no relationship between residual and anthesis biomass in the winter canola and no significant yield penalty associated with a hard cut prior to bud visible (Figure 5B, Table 5) both of which may be related to the availability of soil N and water.
Crops defoliated early may have conserved soil N and/or water, as the ungrazed crop had limited N available in the soil at the onset of stem elongation before additional N was applied. The recovery of other defoliation treatments was possibly limited by lack of available soil N, and the yield by water stress.
The ungrazed spring canola achieved an anthesis biomass of 5 t/ha but all defoliation treatments had insufficient residual biomass to reach the critical anthesis biomass of >4 t/ha and none reached the target yield (Fig 5A, Table 5). There was a positive relationship between residual and anthesis biomass (Fig 5B). Treatments in the “sensitive” stage with greater residual biomass had more anthesis biomass and higher grain yields (Fig5B, Table 5).
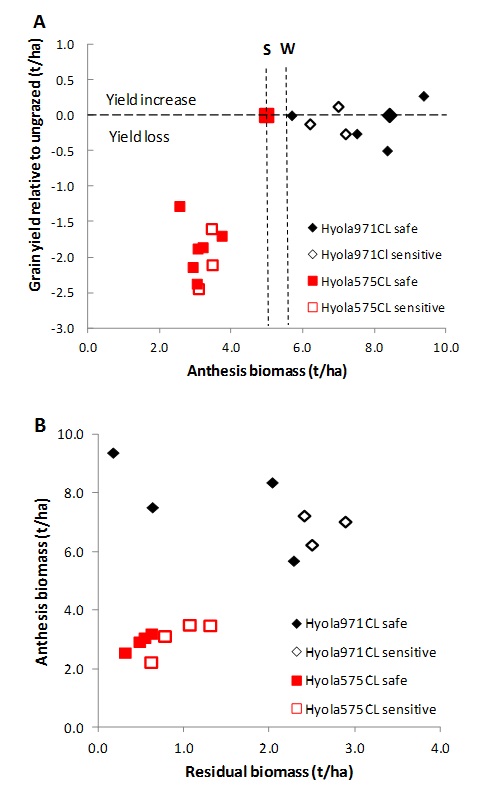
Figure 5. Anthesis biomass of defoliation treatments with a range of residual biomass levels (A) and subsequent grain yield relative to the ungrazed (B) achieved in winter canola Hyola®971CL (diamond, W) sown 15 March and spring canola Hyola®575CL (square, S) sown 16 April in experiments at Greenethorpe, NSW, in 2014. Defoliation treatments in the ‘safe’ window are indicated by closed symbols and those in the ‘sensitive’ window by open symbols. Dashed vertical lines indicate critical anthesis biomass for each cultivar to maintain yield similar to ungrazed controls (larger symbols).
Canola – summary of residual biomass for target yield
Canola appears more sensitive to residual biomass levels than wheat possibly due to slower recovery from grazing. Our results indicate that in southern NSW, >1.5 t/ha residual biomass for spring canola is required for lock-up at the start of stem elongation (mid-to-late July) to achieve the critical anthesis biomass of ~5 t/ha for the target yield of 2.5-3.0 t/ha. For winter canola which grows a larger stem from earlier sowing and begins to elongate later (late-July or early-Aug), >2.5-3.0 t/ha residual biomass is required to achieve the critical anthesis biomass of ~6 t/ha and target grain yield of 2.5-3.0 t/ha. If grazing after the stem is elongating, avoid removing the bud and leave more residual biomass to avoid a yield penalty. In seasons with lower target yield, less residual biomass may be sufficient to achieve the critical anthesis biomass.
Economic trade-offs
Our work has revealed the economic trade-offs related to prolonged or heavy grazing and subsequent impacts on grain yield. We have demonstrated that optimum economic outcomes can involve later, moderate grazing periods outside traditional “safe” windows with careful management to avoid damage to developing reproductive structures. Such decisions will ultimately depend upon the type of enterprises involved and attitude to risk of individual operators. We seek to develop robust rules regarding crop responses so that individual operators can make decisions suited to their circumstances.
Contact details
Susie Sprague
CSIRO, Canberra
(02) 6246 5387
0466 643 227
Susan.Sprague@csiro.au
GRDC Project Code: CSP00160,
Was this page helpful?
YOUR FEEDBACK