Overcoming constraints on sandy soils – amelioration strategies to boost crop production
Author: Melissa Fraser, David Davenport, Brett Bartel (Rural Solutions SA, PIRSA) and Nigel Wilhelm (South Australian Research Development Institute, PIRSA). | Date: 09 Feb 2016
Background
Up to 40 per cent (4.1 million hectares) of the broadacre farming area of South Australia has soil constraints that could be overcome through the application of new advances in technology, machinery and soil management. These include non-wetting sands with low fertility and low water holding capacity and heavier soils with poorly structured subsoils.
‘New Horizons’ is a South Australian Government funded program developed to capture an additional $800 million in agricultural production per annum in South Australia from these badly constrained soils. In 2014, three trial sites were established on sandy soils on the Eyre Peninsula, Murray Mallee and South East; at Brimpton Lake, Karoonda and Cadgee respectively. The sites all have sandy A horizons with a clay B horizon deeper than 30cm. A range of treatments were applied to overcome constraints including water repellence, low water holding capacity and poor fertility. These treatments included the addition and incorporation of clay, fertiliser and organic matter, and combinations of these. The aim of this research was to confirm that crop productivity can be substantially improved when subsoil chemical, physical and biological constraints in sandy soils are treated. The impact of these treatments on crop production and soil condition has already been monitored for two years and we hope to continue these trials for several more seasons to measure their ongoing benefits.
Methodology
The Brimpton Lake site is flat to gently undulating and is used for cropping (cereal, canola, and lupins) in rotation with annual grass and legume-based pastures. The soil profile comprises a grey, sandy, topsoil of 8-10cm over a bleached white sand with sodic clay at 30-50cm deep. Grain yields at the site are generally less than half the yields of better soils in the district.
The Karoonda site is situated in a Mallee landscape with low dunes and swales. The trial site is located at the base of a shallow extensive dune, on a grey shallow sand grading to an orange leached sandy layer which overlies an orange brown clay (20-30% clay) 30-60cm below the soil surface. The paddock is in a continuous crop rotation of cereals and canola.
The Cadgee site is characterised by low rolling dunes and swales with deep sandy soils. The soil profile is composed predominantly of grey sand (0-15cm) grading to bleached white sand overlaying a clay horizon (60-65% clay) 60-90cm below the soil surface. The site has previously been used for grazing of unimproved pasture and was dominated by silver grass prior to trial establishment.
The trials consist of 12 treatments that were all applied prior to seeding in 2014 (Table 1) with four replicates at Brimpton Lake and five replicates at Karoonda and Cadgee; individual treated areas are 25m x 4m.
Table 1: New Horizons trial treatments applied at all three research sites in 2014. Treatments will not be re-imposed in subsequent years.| Un-clayed Treatments | Clayed Treatments |
|---|---|
| Un-modified Control | Shallow Clay incorporated by tillage |
| 'Deep Banded' fertiliser | Shallow Clay with 'Deep Banded' fertiliser |
| Spading only | Spading + Clay (high rate of clay and additional fertiliser applied prior to spading) |
| Spading + Nutrition (additional fertiliser applied prior to spading) | Spading + Clay + Nutrition (high rate of clay and additional fertiliser applied prior to spading) |
| Spading + Organic matter (high rate of OM applied prior to spading) | Spading + Clay + Organic matter (high rate of clay and OM applied prior to spading) |
| Spading + Organic matter + Nutrition (additional fertiliser and OM applied prior to spading) | Spading + Clay + Organic matter + Nutrition (high rate of clay, OM and additional fertiliser applied prior to spading) |
Measurements undertaken at the sites included:
- Soil sampling conducted post-spading in early May 2014 (but prior to the addition of fertiliser at seeding). Samples were analysed for nutrition, exchangeable cations, pH(CaCl), EC(1:5), organic carbon and bulk density. Clay samples were analysed for particle size, clay mineralogy and water retention (2014 only)
- Pre-seeding (2014 and 2015) and post-harvest gravimetric soil moisture in 2014 only. No data collected post-harvest 2015 due to rainfall just prior to harvest at the sites
- Plant establishment counts and dry matter cuts near flowering (2014 and 2015)
- Soil mineral nitrogen pre-seeding (2014 and 2015)
- Soil samples for root DNA analysis (some in 2014 and all sites and treatments in 2015)
- Grain yield (t/ha), protein and screenings at harvest (2014 and 2015).
Economic analysis of treatments including internal rate of return has also been conducted using 2014 results.
Results and discussion
Table 2: Grain yield expressed as a percentage increase or decrease of the unmodified control. Figures in bold are significantly different to the control at five per cent level.
| Treatment | Brimpton Lake | Karoonda | Cadgee | |||
|---|---|---|---|---|---|---|
| 2014 | 2015 | 2015 | 2015 | 2014 | 2015 | |
| unmodified (control) | 0% | 0% | 0% | 0% | 0% | 0% |
| deep nutrition | 33% | 15% | 220% | 99% | 53% | -25% |
| shallow clay | 44% | 45% | -22% | -35% | -10% | 14% |
| Shallow clay + deep nutrition | 8% | 8% | 194% | 118% | 14% | 0% |
| spading | 64% | 43% | 200% | 99% | 69% | -19% |
| spading + nutrition | 11% | 42% | 133% | 32% | 134% | -31% |
| spading + clay | 77% | 50% | 118% | 86% | 42% | 29% |
| spading + clay + nutrition | 21% | 31% | 114% | 44% | 27% | 26% |
| spading + OM | 111% | 95% | 318% | 205% | 102% | 45% |
| spading + OM + nutrition | 104% | 102% | 308% | 202% | 108% | 30% |
| spading + clay + OM | 87% | 81% | 220% | 226% | 69% | 68% |
| spading + clay + OM + nutrition | 101% | 78% | 190% | 213% | 80% | 74% |
Summary - 2014 season
- Water repellence appeared to affect plant numbers at Cadgee with treatments involving clay application and/or soil mixing recording higher plant numbers than the unmodified control and deep nutrition treatments (data not shown here)
- Mineral nitrogen pre-seeding increased from 50-70kg N/ha in the top 50-60cm in unmodified controls to 150-200kg N/ha in treatments with incorporated organic matter across all sites
- High rates of clay with poor incorporation reduced plant numbers at Cadgee and Karoonda
- Deep incorporated clay treatments (spaded) delivered greater early vigour than non-clayed treatments
- Biomass (shoot dry matter) of best treatments was 100 to 220 per cent higher than the unmodified control (Figures 1, 3 and 5)
- Treatments that included organic matter delivered highest biomass at all sites
- Additional fertiliser treatments generally delivered higher dry matter yields than the unmodified controls, but results were mixed and varied across the three sites
- Spading alone provided large increases in biomass at Karoonda and Cadgee, but not at Brimpton Lake
- Grain yields of the best treatments on all sites were at least 100 per cent greater than the unmodified control (Table 2 and Figures 2, 4 and 6). Organic matter treatments delivered the highest grain yields. Spading and the incorporation of deep mineral nutrients delivered yield increases, but results of these treatments varied between sites. Clay addition delivered mixed results both within and between sites
- Conversion of dry matter to grain yield varied, with clayed treatments generally providing slightly lower conversion than unclayed treatments.
Summary - 2015 season
- Mineral nitrogen pre-seeding increased from 60-80kg N/ha in the top 50-60cm in unmodified controls to 100-150kg N/ha in treatments with incorporated organic matter across all sites
- Water repellence appeared to be a bigger issue at Karoonda and Cadgee in 2015 than in 2014, with plant numbers higher on clayed treatments than unclayed treatments. Unlike 2014, lower plant numbers were also recorded on spaded treatments without organic matter (data not shown here)
- Actual biomass (t/ha) was greater than in 2014, however the biomass of the unmodified controls at each site were also considerably greater than in 2014, resulting in an overall lower percentage increase in biomass of best treatments when compared to the control (Table 2 and Figures 1, 3 and 5)
- There was an increase in biomass from spading alone, but not as great as the response was in 2014
- At Cadgee and Brimpton Lake, surface clay addition increased biomass and grain yield in 2015, but reduced biomass at Karoonda (this may be due to poor incorporation at Karoonda or issues connected with the type of clay applied – note clay used at Karoonda had lower clay percentage than other sites and higher pH)
- Spading + Clay + Organic Matter + Nutrition recorded the highest biomass at all sites in 2015
- The four best performing treatments at the three sites all contained spading and organic matter
- Grain yields increased by >78 per cent over the unmodified control in the four treatments that contained OM at Brimpton Lake, whereas three of the four OM treatments at Cadgee returned 45 to 74 per cent increases in grain yield over the unmodified control (Table 2)
- Karoonda was the only site to record consistently lower grain yields for all treatments in 2015 than 2014 (Figure 4), reflecting the very poor winter and spring conditions at the site in 2015. Despite this, the four best treatments still returned an average 211 per cent increase in yield over the unmodified control (Table 2)
- Economic assessment of the trial treatments is problematic because the treatments imposed in these trials were to test principles, not to investigate least cost options. Nevertheless, an economic assessment has been undertaken by external agronomic advisers using modelled farms in four locations (Upper Eyre Peninsula, Lower Eyre Peninsula, South Australian Murray Mallee and the South-East) based on 2014 results
- In general, it is the more moderately priced treatments (less than $500 p/ha) that deliver the highest internal rate of return (IRR) even though they generate the lesser increases in yield. However, where organic matter can be sourced at a cost of $500/ha or less, this may be a more viable option to add value to other treatments
- Farmers in both the Murray Mallee and Eyre Peninsula have started trialing the incorporation of organic matter at rates that are more economically attractive and are still seeing spectacular increases in grain yield.
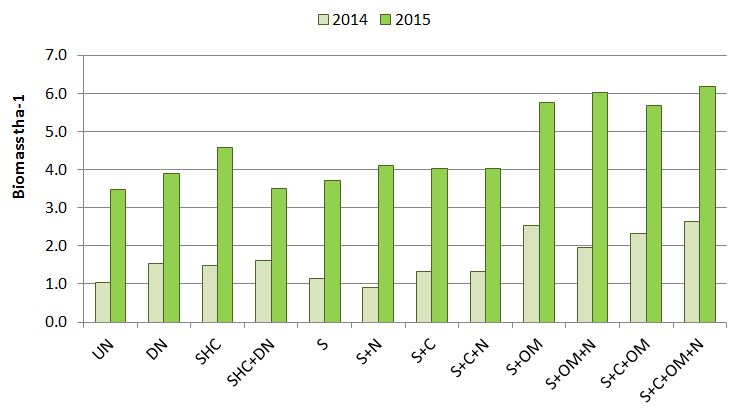
Figure 1. Comparison of biomass (t/ha) at Brimpton Lake in 2014 and 2015. Biomass production was considerably higher in 2015 than 2014 (115 to 350% higher), reflecting the better winter conditions of that year. The four treatments that include spading (S) plus organic matter (OM) performed the best in both years. (UN = Unmodified control, DN= Deep banded nutrition, SHC= Shallow clay, S= Spading, N= nutrition, C = clay, OM= Organic Matter).
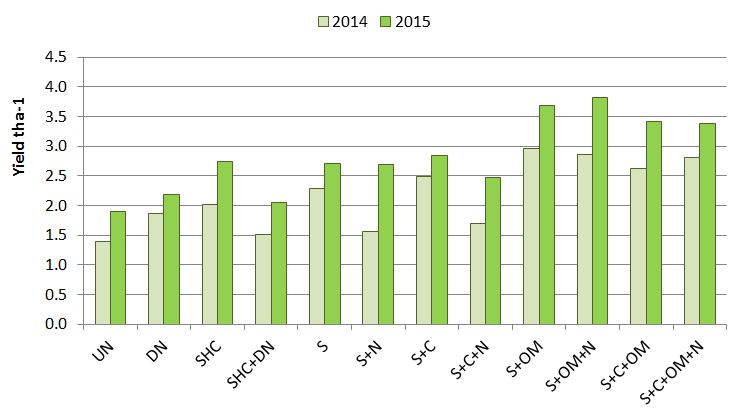
Figure 2. Comparison of grain yield (t/ha) at Brimpton Lake for the 2014 and 2015 seasons. The four treatments that contain spading and organic matter had significantly higher yields (average 101% in 2014 and 89% in 2015) than the unmodified control in both years (see Table 2 for significance). Despite the large increase in biomass in 2015 (Figure 1), grain yields were only 15 to 70 per cent greater in 2015 than 2014 for the same treatments. (UN = Unmodified control, DN= Deep banded nutrition, SHC= Shallow clay, S= Spading, N= nutrition, C = clay, OM= Organic Matter).
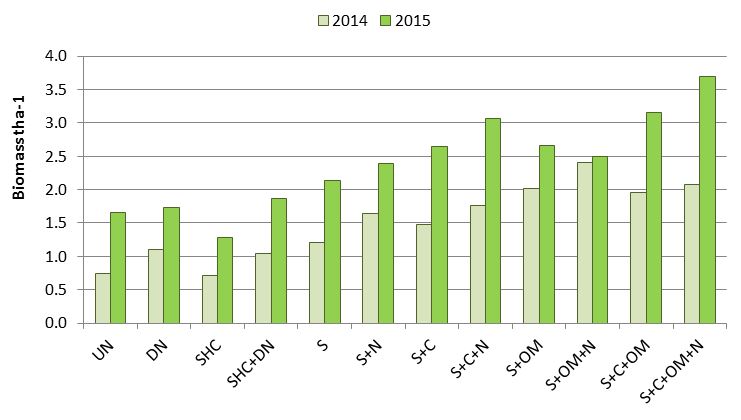
Figure 3. Comparison of biomass (t/ha) at Karoonda in 2014 and 2015. Biomass production was higher in 2015 than 2014, consistent with trends seen at Brimpton Lake (Figure 1) and Cadgee (Figure 5). (UN = Unmodified control, DN= Deep banded nutrition, SHC= Shallow clay, S= Spading, N= nutrition, C = clay, OM= Organic Matter).
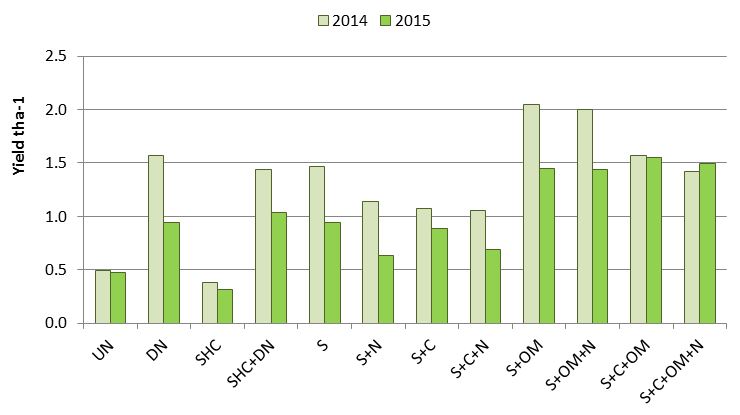
Figure 4. Comparison of grain yield (t/ha) at Karoonda in 2014 and 2015. The four treatments containing spading and organic matter again returned the highest grain yields in 2015 (average 211% > than control), despite not always having the highest biomass in that year (Figure 3). The two treatments containing deep banded nutrition performed exceptionally well at this site compared to the other two sites in both years (Figures 2 and 6); the reasons for this are not yet known but there appears to be an interaction with the form and depth of physical disturbance and fertiliser incorporation. (UN = Unmodified control, DN= Deep banded nutrition, SHC= Shallow clay, S= Spading, N= nutrition, C = clay, OM= Organic Matter).
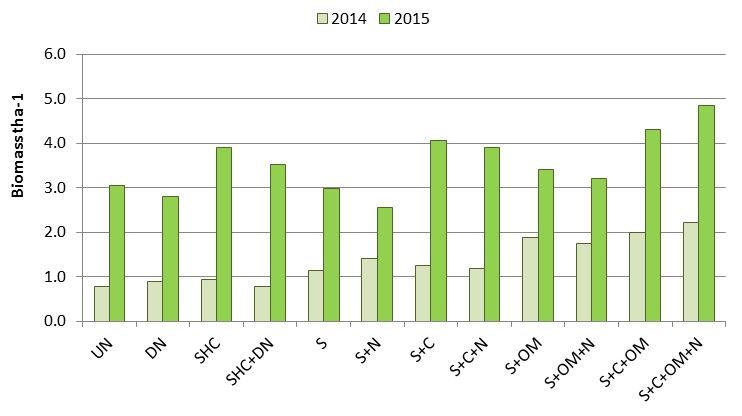
Figure 5. Comparison of biomass (t/ha) at Cadgee in 2014 and 2015. Biomass production was considerably higher in 2015 than 2014 (80 to 350% higher) reflecting the better establishment at the site in 2015 and that barley was used in 2015. The four treatments that involve spading (S) plus organic matter (OM) performed the best in 2014, with the shallow clay and spading plus clay treatments performing better in 2015. (UN = Unmodified control, DN= Deep banded nutrition, SHC= Shallow clay, S= Spading, N= nutrition, C = clay, OM= Organic Matter).
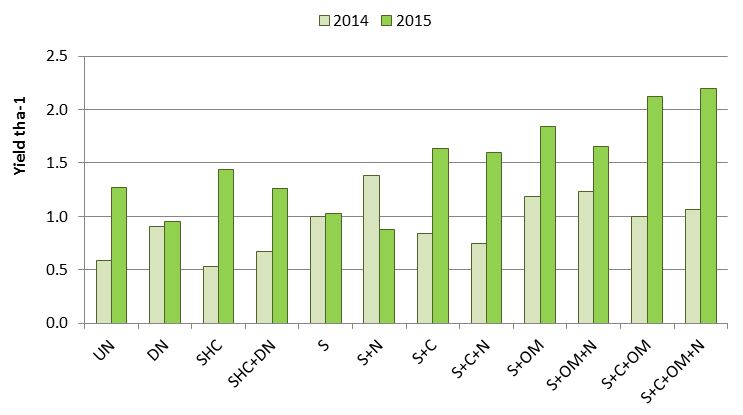
Figure 6. Comparison of grain yield (t/ha) at Cadgee in 2014 and 2015. Grain yields overall (wheat in 2014 and barley in 2015) were considerably higher in 2015 than 2014. The shallow clay treatments performed better in 2015 than 2014, owing to the re-incorporation of clay in that year. The four treatments containing spading and organic matter once again performed the best in 2015 (see Table 2 for significance), albeit only the S+C+OM+N treatment returned a yield increase greater than 70 per cent over the unmodified control. (UN = Unmodified control, DN= Deep banded nutrition, SHC= Shallow clay, S= Spading, N= nutrition, C = clay, OM= Organic Matter).
Conclusions
Crop biomass and grain yield data generated at the three New Horizons research sites in both 2014 and 2015 confirm that productivity can be substantially improved on infertile sandy soils when subsoil chemical, physical and biological constraints are treated. Despite the challenging climatic conditions observed, crop yields of the best treatments at each site exceeded the yields of the unmodified control by 110 to >300 per cent in 2014 and 70 to >200 per cent in 2015.
The best treatments at all sites in both years included spading and the incorporation of organic matter to depth, with or without the inclusion of clay and additional fertiliser. The operation of spading aids with overcoming water repellence, mixes the often chemically hostile bleached A2 horizon with organic matter and organic carbon that is otherwise stratified at the surface and can overcome compaction issues by reducing the bulk density. The incorporation of organic matter undoubtedly provides additional nutrition, but we also suspect it contributes to increasing cation exchange capacity, water holding capacity, biological activity and the stabilisation of soil aggregates. Further monitoring and analysis of the soil chemical, physical, hydrological and biological characteristics of the New Horizons sites is required to confirm these hypotheses.
We hope to continue the trials in 2016, however there is some degree of uncertainty regarding funding. Continuing the trials will give us greater certainty about the potential benefits and longevity of each of the applied treatments. This will enable further economic analysis to be conducted which will improve confidence in applying the recommended treatments. A new site is also being established at the Struan Research Centre to demonstrate and assess the effectiveness and economic feasibility of applying different types of organic matter (all at a cost of $500/ha).
Useful resources
Contact details
Brett Bartel
Rural Solutions SA
PIRSA
08 8226 9771
brett.bartel@sa.gov.au
@SA_PIRSA
#NewHorizons_SoilMgt
Melissa Fraser
melissa.fraser@sa.gov.au
Was this page helpful?
YOUR FEEDBACK