Economic analyses of cropping options in future climates
Author: James Fisher, Desiree Futures | Date: 01 Mar 2016
Key messages
• Economic analysis of farming systems options were conducted using information provided by participating farmers against historic and reduced levels of production.
• This analysis indicated that implementation of currently available options can improve net farm income under reduced production associated with a climate scenario.
• Results of these economic analyses contribute to increased confidence in growers’ ability to maintain profitability under climatic risks and challenges, albeit with increased variability in net farm income and return on assets.
Aims
Farming in Australia has continually developed and adapted. Farmers change practices, enterprise mix and adopt and dis-adopt crops according to a range of drivers such as climate, season, markets, economics, technology and regulations (Fisher et al 2014). The levels of production that have been achieved since the turn of the century, during one of the most extreme climatic periods on record, would not have been possible using the farming systems of 20–30 years earlier. Given that the recent past is likely to be a ‘window’ into the short- to medium- term future, options and innovations that have been adopted or rejected by farmers, or that are currently being trialed and developed represent a substantial body of knowledge from which the industry as a whole may benefit.
This project worked with farmers across seven GRDC agroecological zones to identify two local farming systems to use in a whole-farm economic analysis. The analysis tested the impact of reasonable systems options under production levels based on current and climate scenarios.
Method
Workshops were conducted with farmers from the seven groups with an average of 10 participants per workshop (range 4 to 18 participants). The farmers provided non-sensitive, non-identifiable details about their farm businesses (area of farm, arable area, area of crop and pasture, crops grown, value of cropping and livestock infrastructure, overhead costs, variable costs, plus levels of production and prices considered to be low, medium, and high). This information was used to set-up two farming systems for each district and to generate distributions of yield and prices for use in the economic analysis. The systems were designed to capture the diversity in production and cropping systems within each district, but should not be considered as representative of any one agribusiness within any of the districts. Analyses were carried out for the existing farming systems under the base scenario and a climate scenario.
The base scenario used distributions of yields and prices generated from the ranges of yield and prices provided by the growers. The climate scenario involved changing the distributions of yields by decreasing the mean and lower yield boundary by 10%. These changes reflect the results from published analyses which suggest reduced mean yield and increased variability in production with climate change (for example Anwar et al. 2007, Asseng et al 2011, Howden et al 2010, Ludwig et al 2009, Luo et al 2009, Turner et al 2011, Wang et al 2011).
For each analysis a computer-generated selection of 10 000 samples from the distributions of yield and prices were used in the models of the farming systems under the base scenario and the climate scenario. Options identified by the growers were included under the climate scenario to assess the potential economic impact of such changes. The net farm income (NFI) and return on assets (ROA) were calculated for each scenario and option.
Results
Economic analysis of models of farming systems based on information supplied by the participating farmers reinforced some key principles. The average ROA of the systems was consistent with ABARES average values of 3% per year (data not shown). There was significant variation in income for most systems, with the coefficient of variation of NFI being greater than 90% in five of the seven districts (range 19.3%–289%). Systems with a higher proportion of livestock tended to have lower NFI, but also lower variability in NFI (Figure 1).
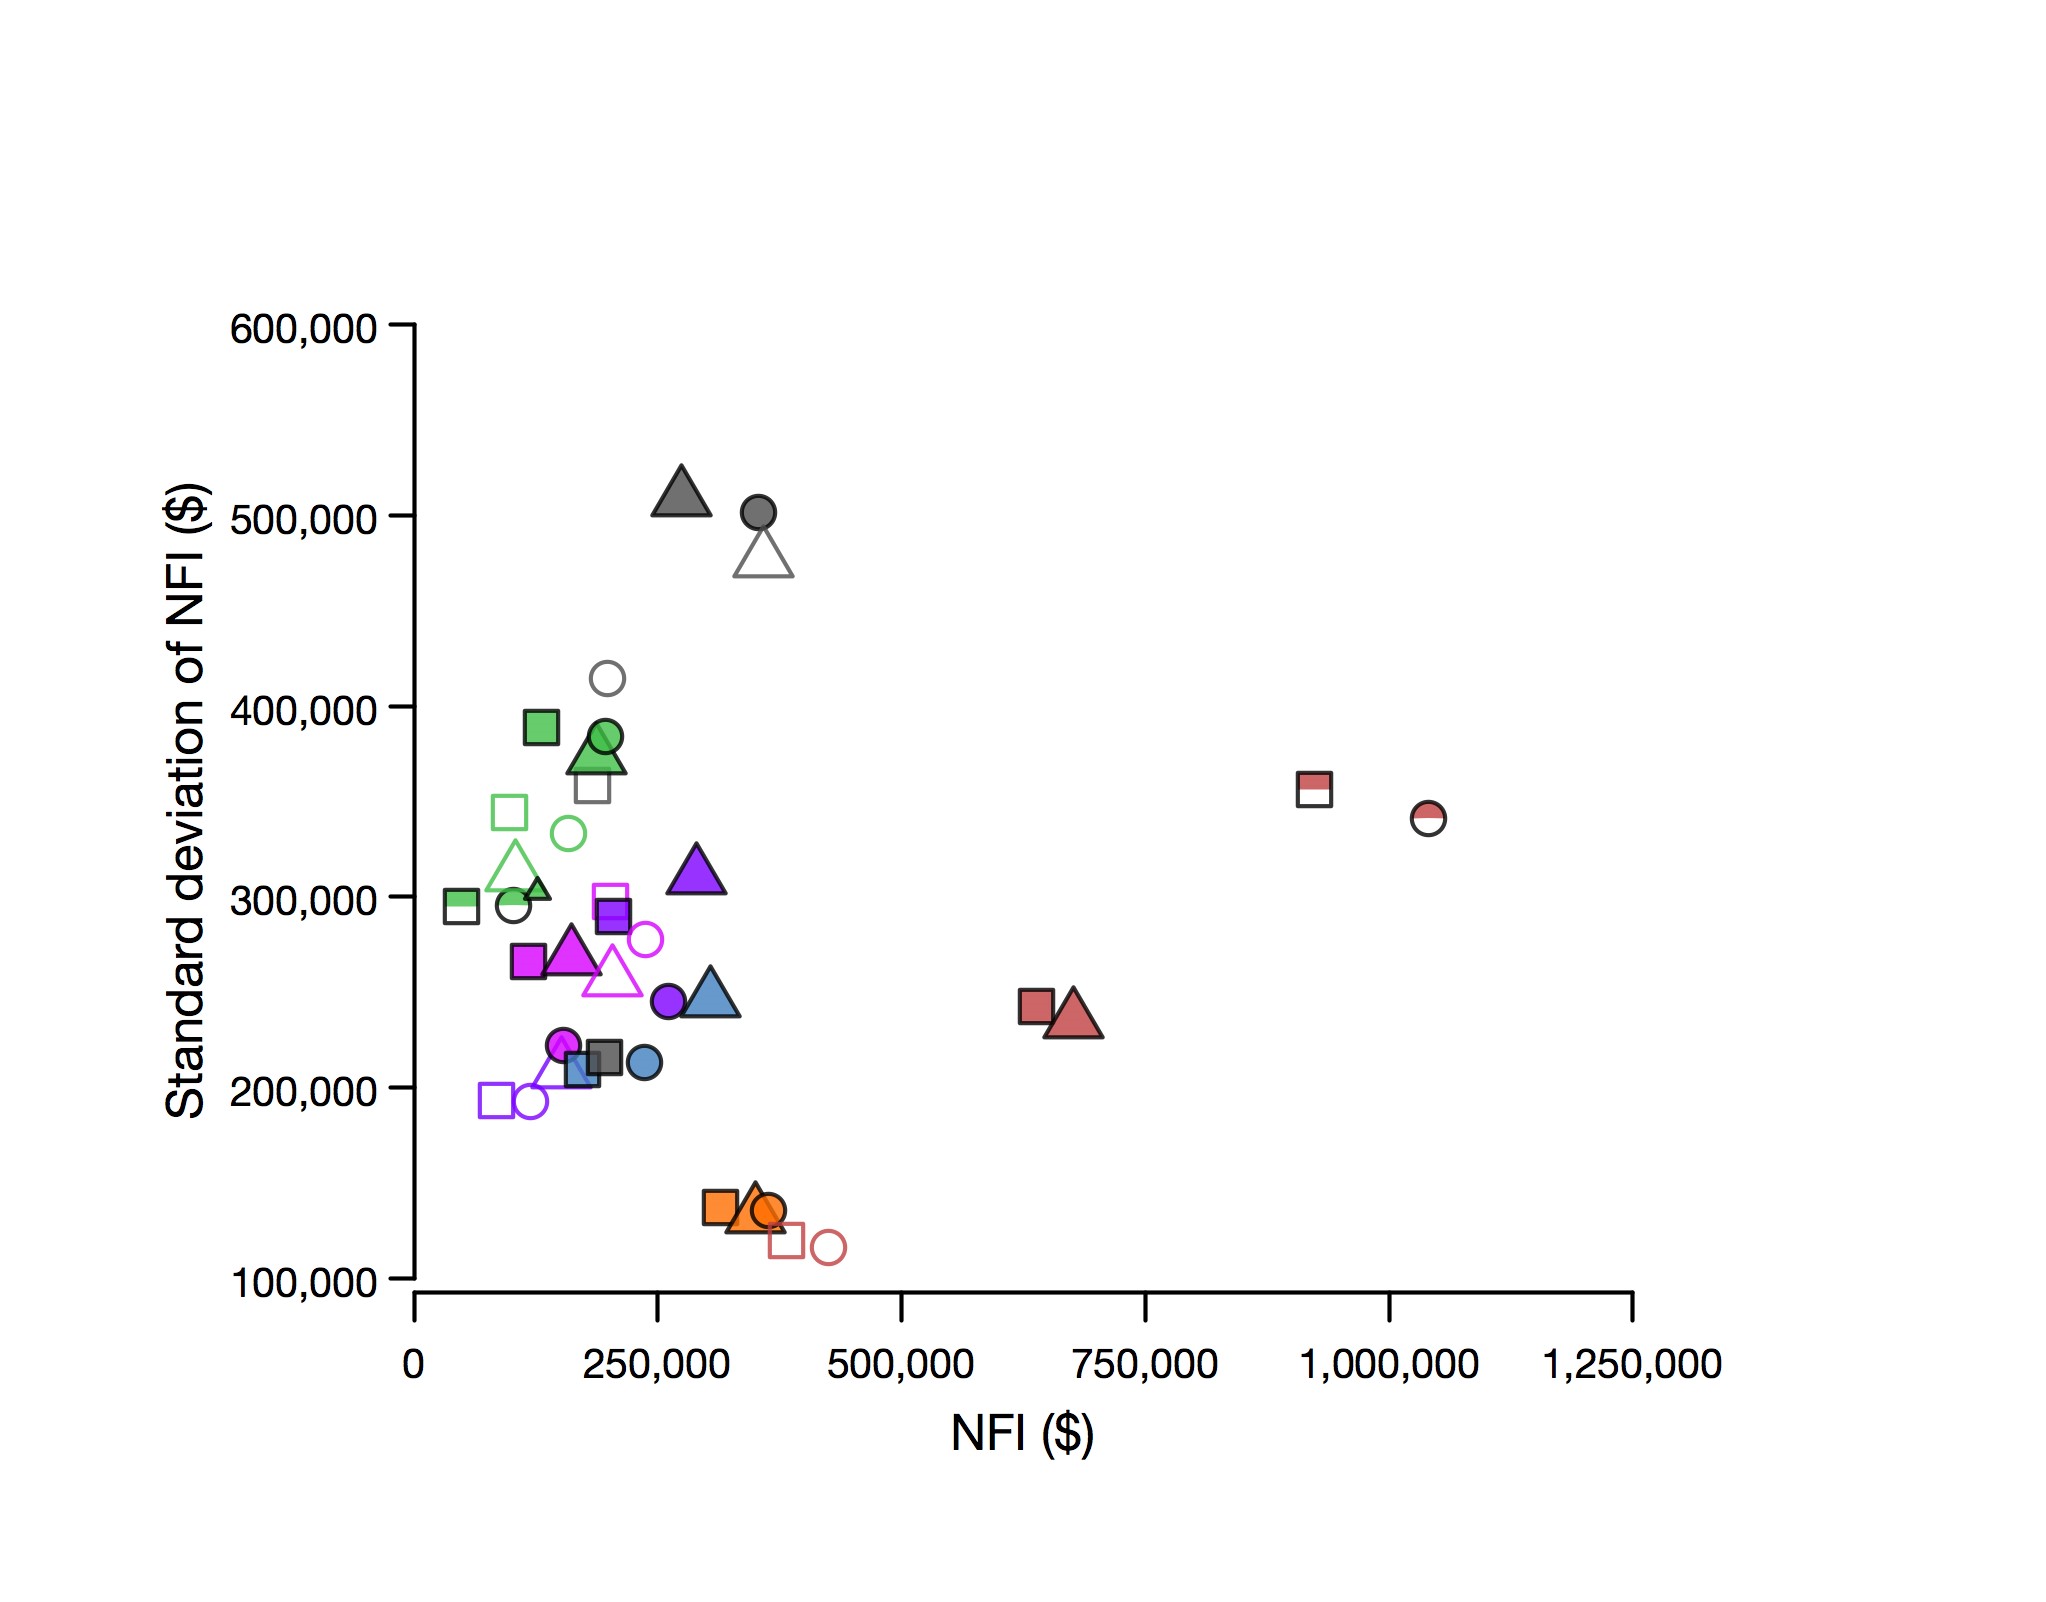
Figure 1. The net farm income (NFI) and standard deviation in NFI for farming systems in the seven districts. Original farming system indicated by circles for the base scenario and squares for the climate scenario. The triangles indicate the best performing option for each location under the climate scenario. Filled, open and part-filled symbols are used for related analyses. NSW central in magenta (filled and open symbols), NSW southern in purple (filled and open symbols), SA south-east in orange (filled symbols only), SA Yorke Peninsula in dark orange (filled open and half-filled symbols), WA south-east Wheatbelt in black (filled and open symbols), WA south of eastern Wheatbelt in teal (filled symbols only) and WA north-east Wheatbelt in green (open and filled symbols).
Evaluation of the farming systems and options against climate scenarios with lower mean and higher variability in yield showed declines in the mean NFI to 60–90% of those achieved with the base scenario. Increased variability of NFI was a feature under the changed production scenarios. However, profitability returned level with or close to the original levels with the implementation of options that the farmers had considered or were considering. The performance of these options under the changed production scenarios depended on the specific system, the option implemented and the assumed benefits of the option. For example, constraints to the fixed and capital costs were needed when implementing precision agriculture options and yield benefits of 10% or greater were required in systems incorporating fallow or improved efficiency or changed land-use.
Looking across all of the districts in this analysis, the variability in NFI, indicated by the standard deviation of NFI, tended to be lower at lower levels of income (Figure 1). The exception to this was one of the systems in SA-central, a relatively large farming system with a wide-range of crops achieving relatively high returns. However, since the analyses for each district were done using specific, local data, care needs to be taken when making direct comparisons between the districts. The standard deviation of NFI was highest for the systems in the lower rainfall areas.
Three agroecological zones in Western Australia were included in the study, north-east Wheatbelt (Mukinbudin), south of the eastern Wheatbelt (Lake Grace) and south-east Wheatbelt (Salmon Gums). The results from these will now be discussed in more detail.
North-east Wheatbelt (Mukinbudin).
Based on the information supplied by farmers in the group, two systems were developed – a mixed farming system (including livestock) and a 100% cropping system (with no livestock). The mixed farming system was larger in total area, but the cropping program in each system was approximately the same size in area. The mix of crops and individual crop areas varied across the two systems. Producers in the group identified several different options when discussing how to counter the impacts of climate change on their farming systems. The options included in the analysis were 1) change the crop mix and increase the area of canola, at the expense of other crops, namely wheat or chickpeas, 2) agist sheep from other regions; 3) opportunistically crop by utilising area that was set aside as fallow, if the seasonal rainfall is expected to be 10% higher than average or 4) 2.5% increased yield due to fallowing.
In the base scenario (no climate change) for each system NFI (ROA) were $158 000 (3.37%) and $102 000 (2.84%) for the mixed and 100% systems, respectively (Figure 2a). Maintaining the original system and reducing mean yield and the lower yield boundary, to account for climate change, NFI (ROA) was reduced to $98 000 (2.09%) and $48 000 (1.35%) for each system respectively. Allowing for opportunistic cropping in the pre-climate change mixed cropping system generated an NFI (ROA) of $196 000 (4.21%); climate change reduced this to $131 000 (2.79%).
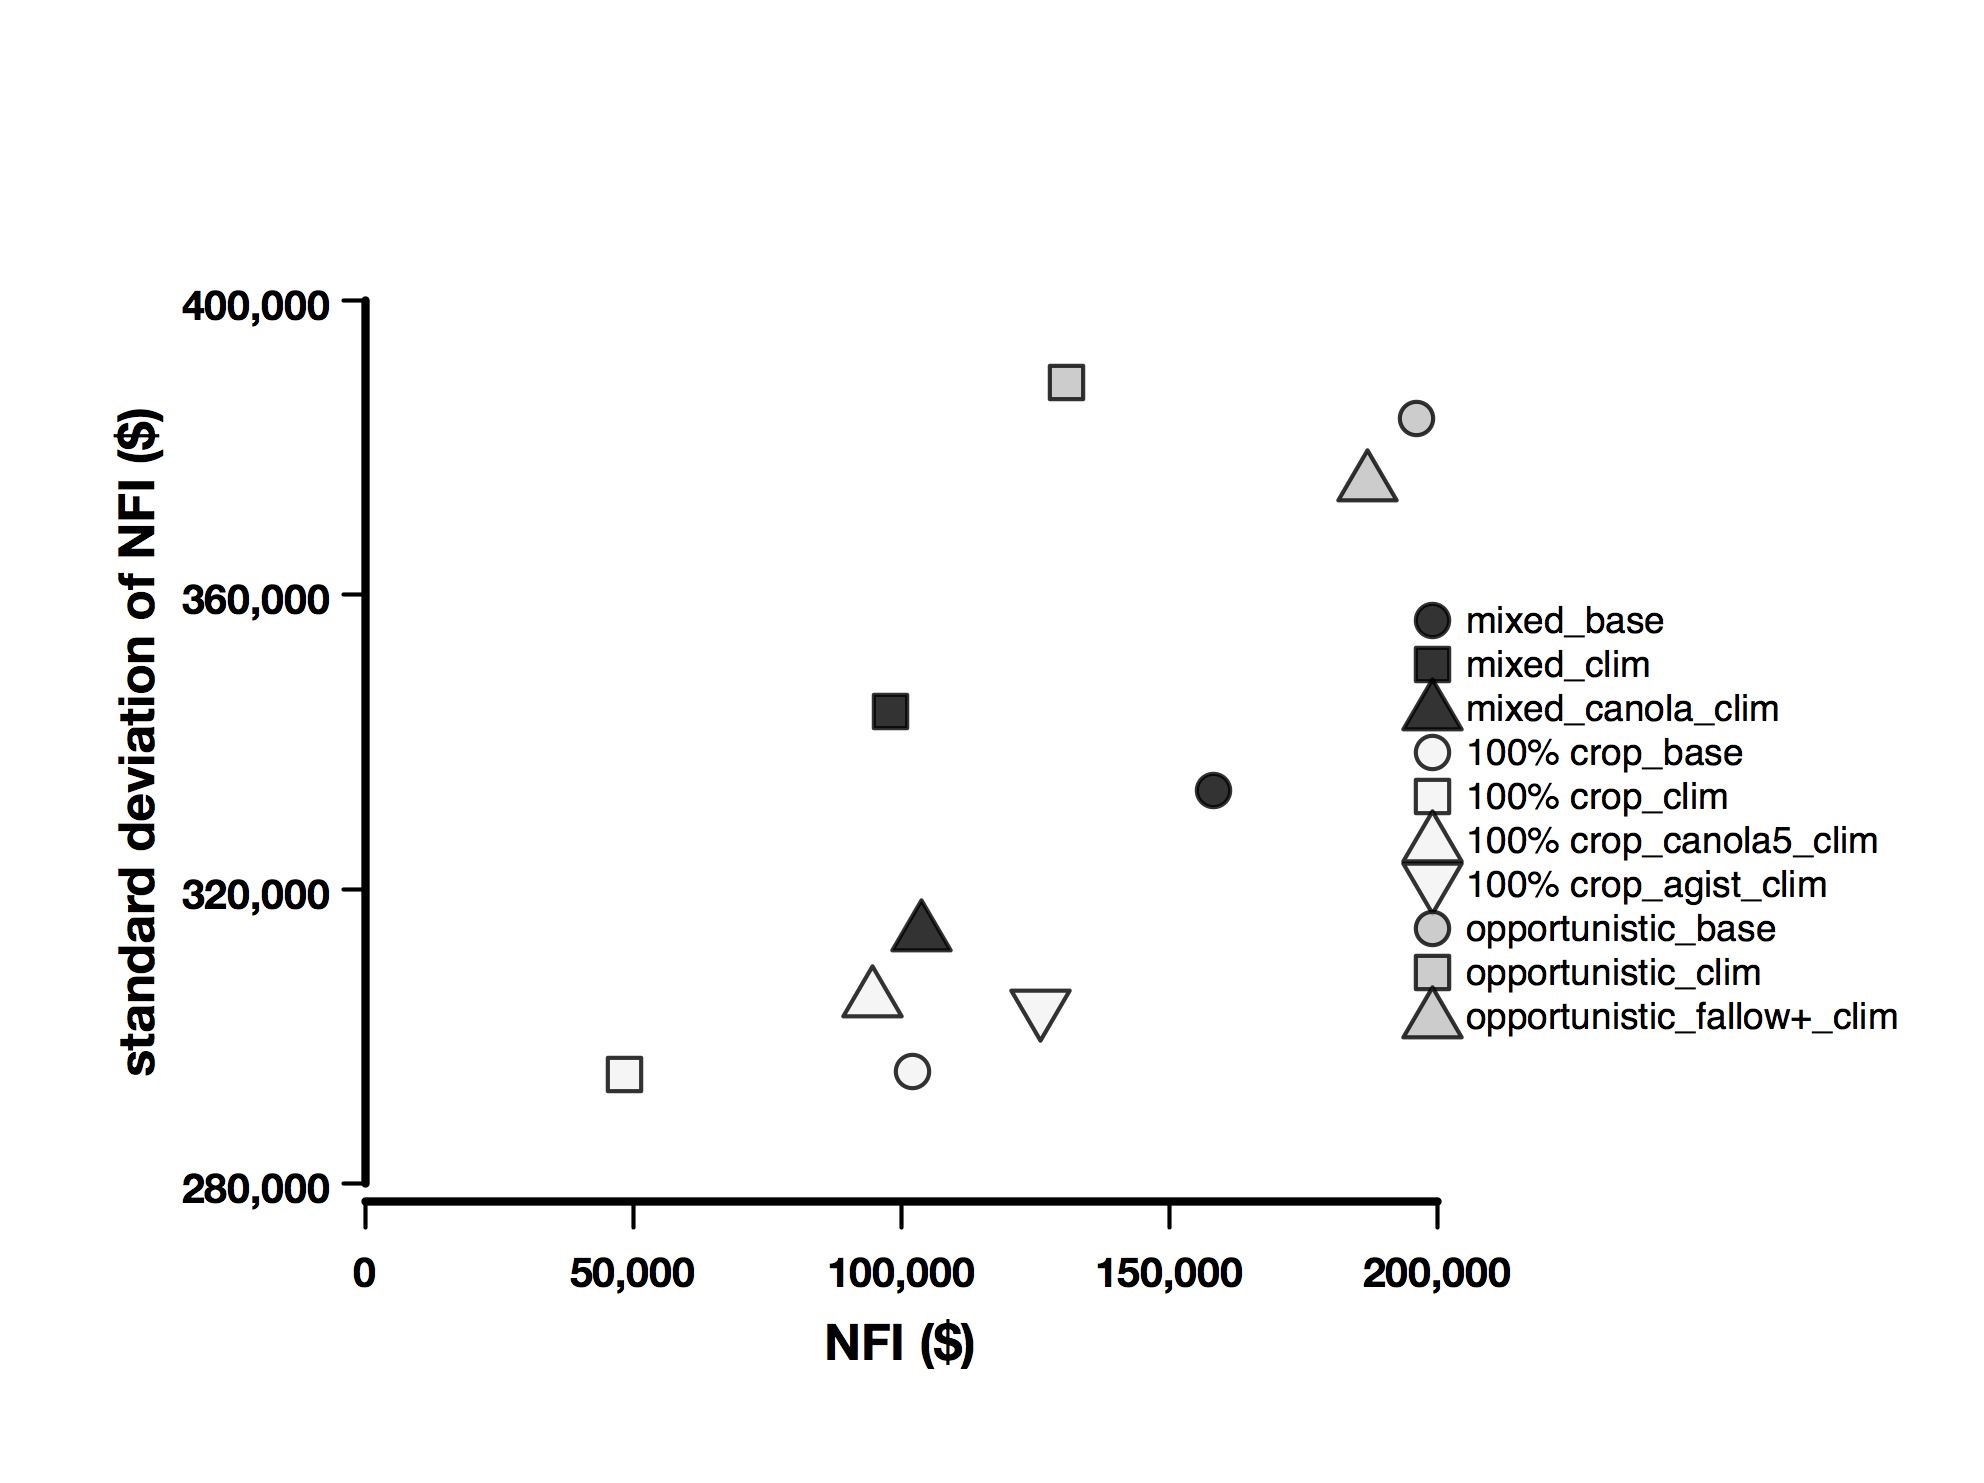
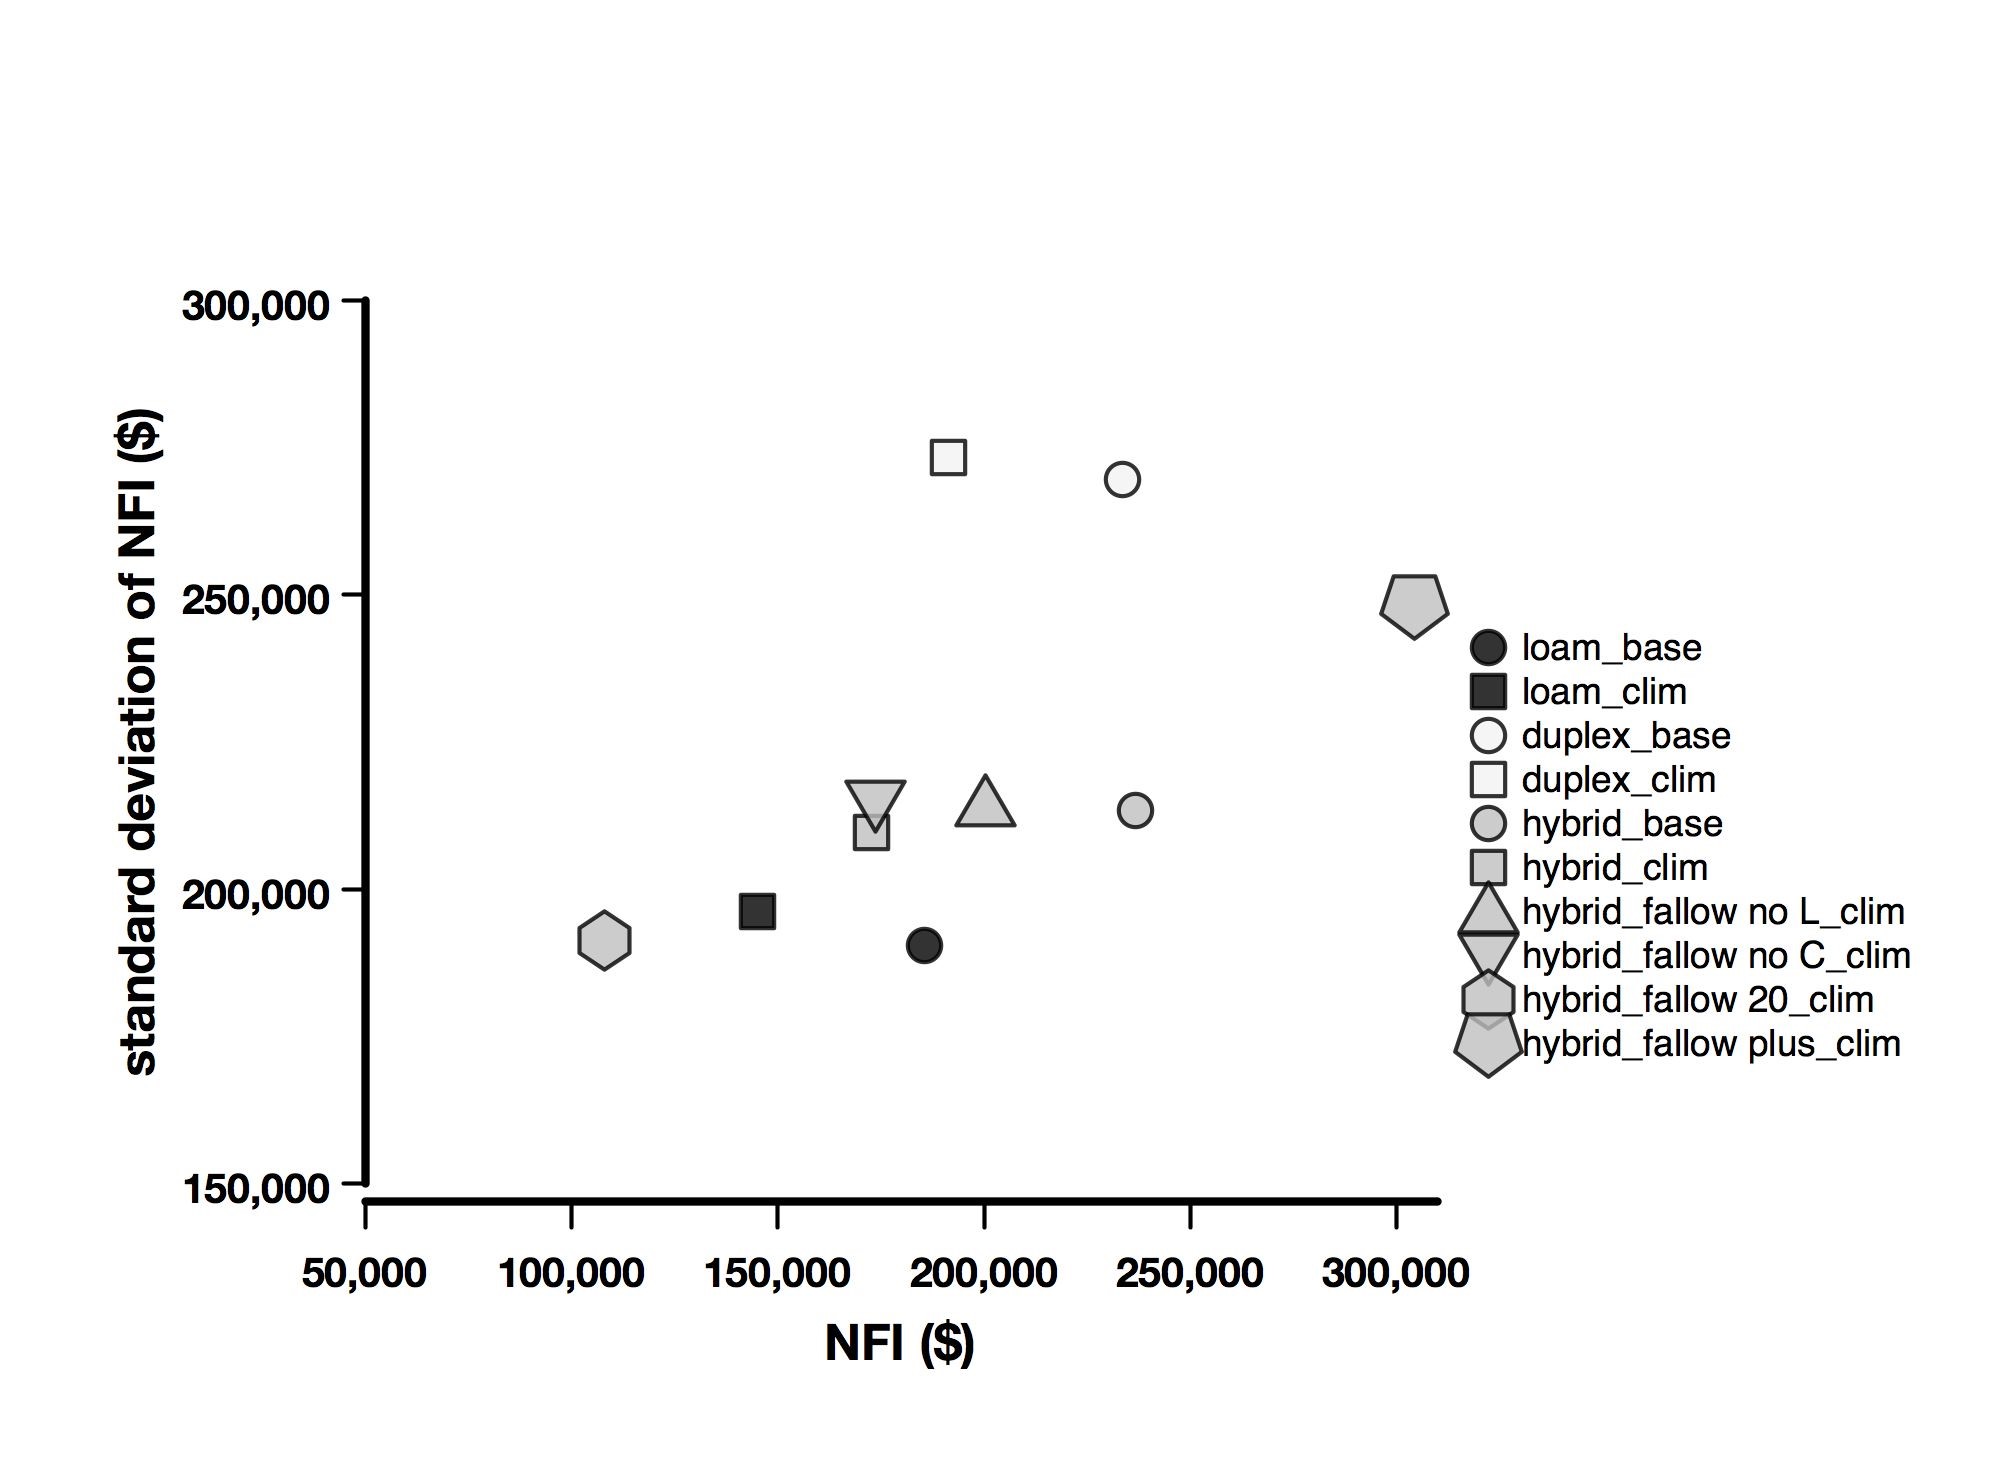
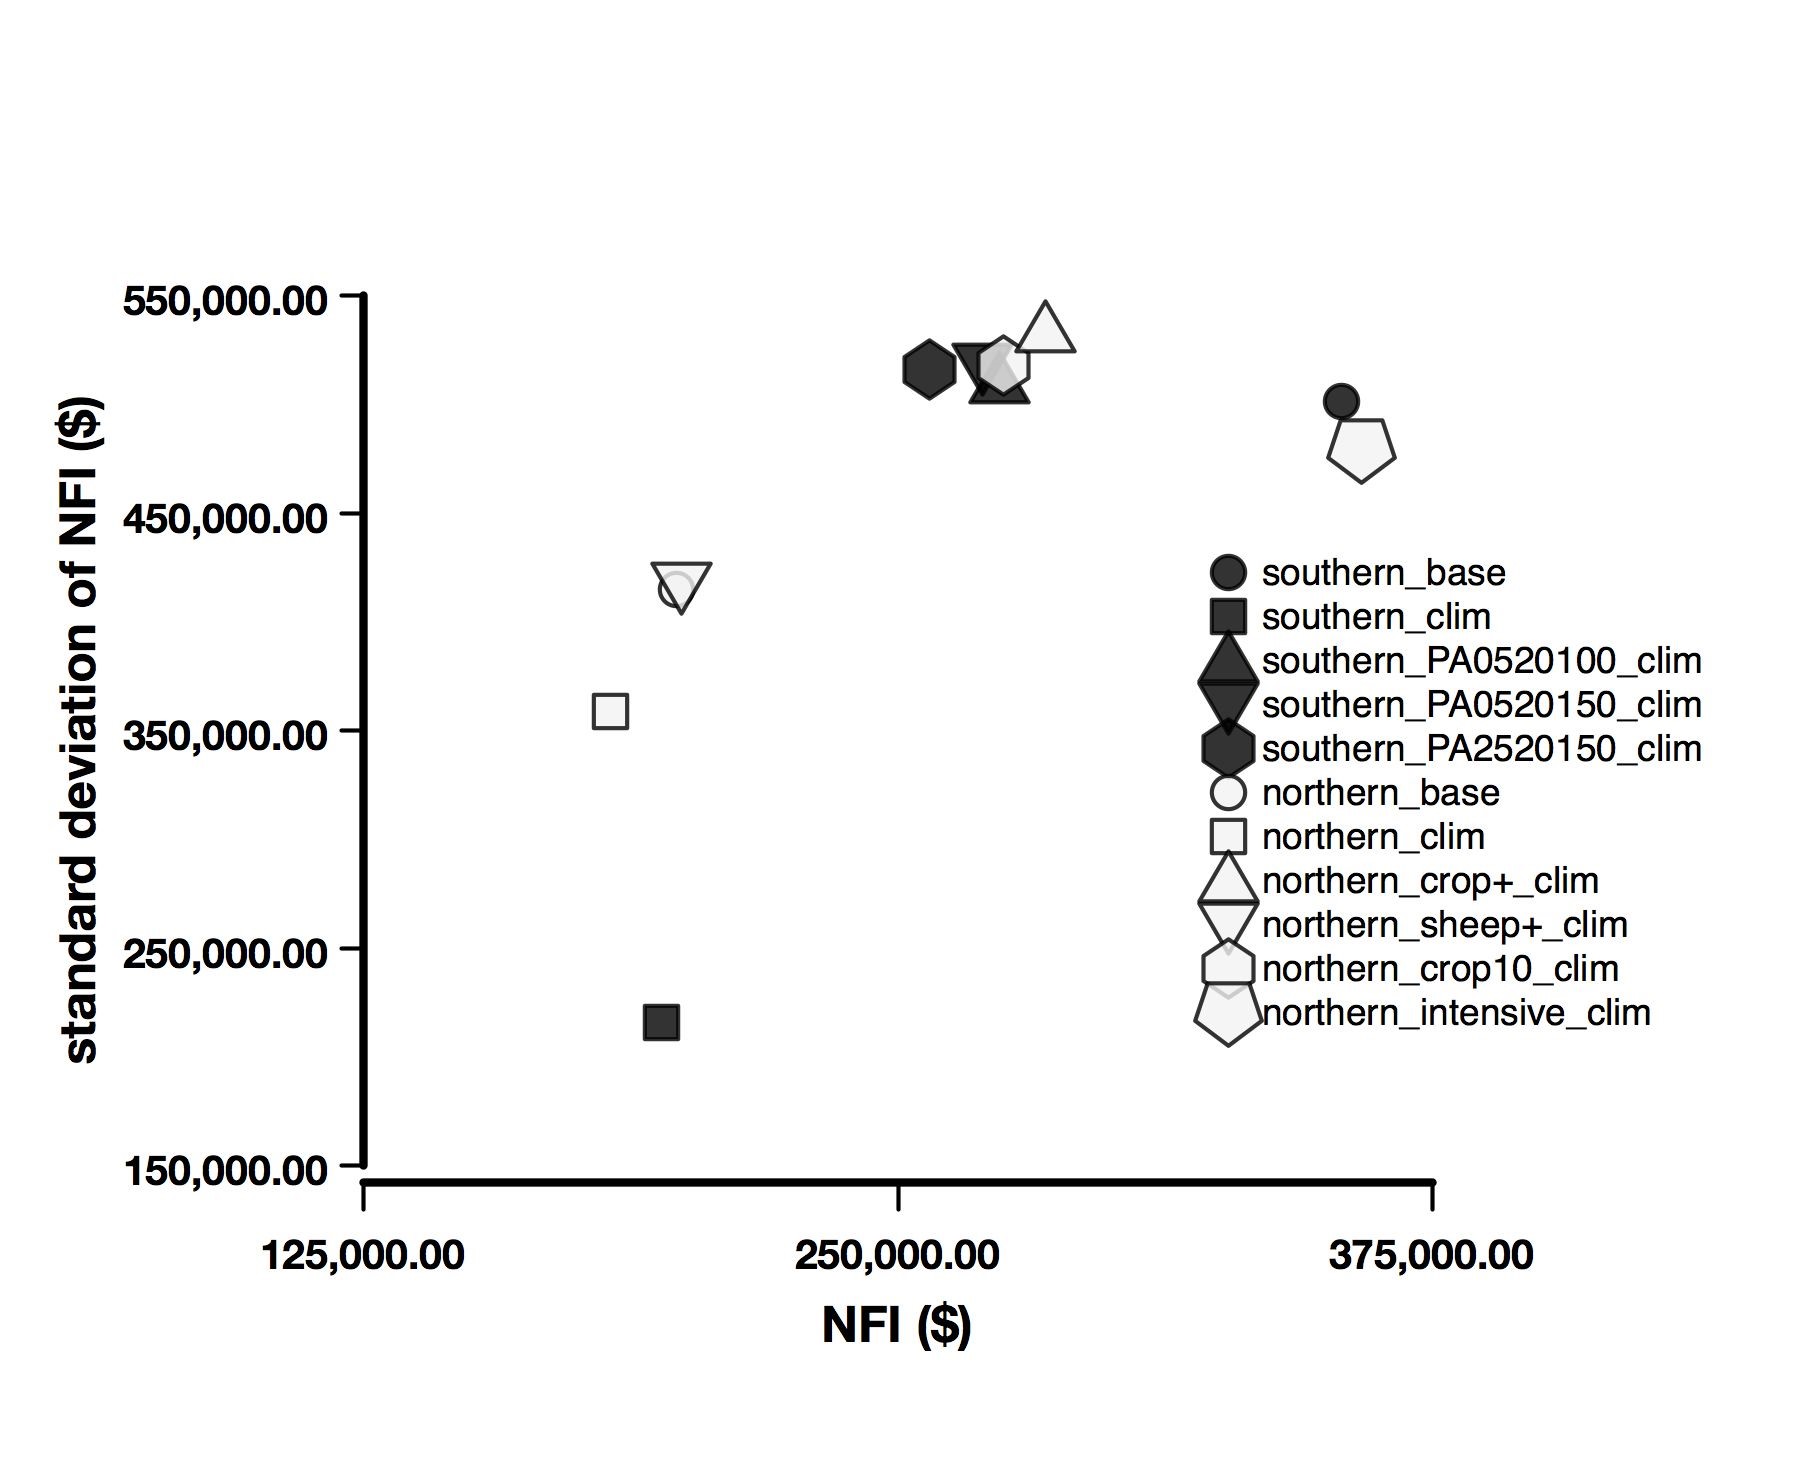
Figure 2. The net farm income (NFI) and standard deviation in NFI for the a) north-east Wheatbelt (Mukinbudin), b) south of the eastern Wheatbelt (Lake Grace), and c) south-east Wheatbelt (Salmon Gums).
When analysing the impact of climate change for the two basic systems, with no opportunistic cropping, increasing the area of canola and reducing the area of wheat (mixed system) or chickpeas (100% cropping system) increased NFI (ROA) in each system, from the reduced levels due to climate change, by $6 000 (0.12%) and $46 000 (1.30%), respectively (Figure 2a). In the opportunistic system, allowing for an increase in wheat yield due to fallowing helped lift NFI (ROA) by $56 000 (1.19%).
South of the Eastern Wheatbelt (Lake Grace)
Two farming systems were developed for the south of the eastern Wheatbelt based on a soil type difference, loam and duplex. The system based on loam soils was larger in area by approximately 1 000 ha, but the percentage of area cropped was lower than the duplex-based system, leading to a situation where total crop area for both systems was relatively similar. One further system was developed after further discussion with the group and that was what we have titled as “hybrid” system, which is a system split on soil type 50:50 loam to duplex. There were some minor differences in yields and prices across the two systems, however the major differences were in individual crop areas, and the sheep enterprise type. The loam-based system included a self-replacing Merino ewe flock and a wether flock, while the duplex-based system had self-replacing Merino ewes only and lower sheep numbers than the loam system (2 675 ewes compared to 1 700). The options tested against the climate scenario were 1) change the crop mix and increase the area of fallow to 10 or 20% of arable area, at the expense of other crops, namely canola or lupins, 2) crop all arable land, at the expense of fallowing, or 3) 10% increased yield due to fallowing, post-climate change.
In the base scenarios (no climate change) for each system NFI (ROA) were $190 000 (2.95%) and $223 000 (4.79%) for the loam and duplex systems, respectively (Figure 2b). Maintaining the original system and reducing mean yield and the lower yield boundary, to account for climate change, NFI (ROA) for each system was reduced to $145 000 (2.26%) and $191 000 (4.11%). The hybrid system under the base (no climate change) scenario generated an NFI (ROA) of $237 000 (4.19%). This was reduced to $173 000 (3.06%) under the climate scenario.
When analysing the impact of climate change for the hybrid system, increasing the area of fallow and reducing the area of canola or lupins (100% cropping system) increased NFI (ROA) in each system by $1 000 (0.01%) and $38 000 (0.50%), respectively compared with the original system (Figure 2b). These changes in NFI or ROA were also associated with a reduction or a similar level of variability in these measures, thus although climate change may have reduced income marginally variability of income was not significantly affected in this production region.
South-east Wheatbelt (Salmon Gums)
Two farming systems were identified in this district, a northern and southern system, based on geography rather than soil type or production system directly. The main difference in the production systems was that the southern system did not have any livestock enterprises included, whereas the northern system included Merino ewe and wether enterprises. Contrary to the other two districts there were some major differences in yields between crop enterprises (wheat 1.7t/ha cf. 1.58t/ha, barley 1.5t/ha cf. 1.76t/ha, and canola 0.55t/ha cf. 0.43t/ha, southern v northern, respectively). Not all of the arable land was used in either of the original systems, either for cropping or as a specified fallow. Therefore, utilising more arable land in the crop rotations of both systems was one option tested under the climate scenario. A second option was to introduce precision agricultural practices so as to reduce costs and perhaps increase yields that were reduced due to climate change.
In the base scenario (no climate change) for each system NFI (ROA) were $354 000 (4.44%) and $198 000 (2.94%) for the southern and northern systems, respectively (Figure 2c). Maintaining the original system and reducing mean yield and the lower yield boundary, to account for climate change, NFI (ROA) for each system was reduced to $195 000 (2.45%) and $183 000 (2.71%) for each system. Cropping all arable land in the northern system increased NFI (ROA) to $391 000 (5.93%); climate change reduced this to $285 000 (3.93%).
The options tested to address the impact of climate change had variable impacts on each farming system. Beginning with the northern system, increasing sheep numbers by 100% increased NFI after climate change to $199 000 (2.96%), whereas increasing cropping area by 10% from the base scenario level lifted NFI (ROA) to $275 000 (4.07%) (Figure 2c). For the southern system three different levels of investment in precision agricultural packages were modelled. The three systems combined different levels of reduction in variable costs (5% or 2.5%), an increase in fixed costs of $20,000, and capital cost increases of $100,000 or $150,000 (coded as PA0520100, PA0520150 and PA2520150 with the numeral indicating the combinations of reduced variable cost, fixed costs and capital cost respectively). Adoption of PA lifted NFI (ROA) after climate change by a range of $63 000 to $80 000 (0.64% to 0.95%), with a relatively low level of investment of $100 000 in capital costs, $20 000 in variable costs (PA0520100), along with an assumed 5% increase in yield, generating the highest return. In terms of income variability, none of the system changes for the northern system changed income or return variability significantly, relative to the climate change outcome. However, the precision agricultural systems did increase the variability of income and returns in the southern system.
Conclusion
The results of these analyses supported the general premise of the project, that combinations of research findings, technologies, management options and innovations that individual farmers have adopted may represent ‘best practice’ options to maintain farm viability into the future.
Analysis of options using information from collaborating farmers serves two complimentary purposes, relating to the general and the specific. By identifying areas of commonality across the farming areas of Australia, farmers can derive direct benefit from comparisons of experiences from other regions while at the same time getting the benefit of local, tailored analyses.
References
Anwar, M. R., O'Leary, G., McNeil, D., Hossain, H., & Nelson, R. (2007). Climate change impact on rainfed wheat in south-eastern Australia. Field Crops Research, 104(1–3), 139–147.
Asseng, S., Foster, I., & Turner, N. C. (2011). The impact of temperature variability on wheat yields. Global Change Biology, 17(2), 997–1012. doi:10.1111/j.1365-2486.2010.02262.x
Fisher, J., Tozer, P., Beurle, D., & Pengilley, M. (2014). Regional scenario analysis of farm adaptation. Presented at the 2014 Agribusiness Crop Updates, 24–25 February 2014, Grain Industry Association of Western Australia, Perth, Western Australia. Retrieved from http://www.giwa.org.au/pdfs/2014/Not_Presented_Papers/Fisher%20James_Regional%20Scenario%20Analysis%20of%20Farm%20Adaptation_PAPER%20DR.pdf
Howden, M., Crimp, S., & Nelson, R. (2010). Australian agriculture in a climate of change. In I. Jubb, P. Holper, & W. Cai, Managing Climate Change : Papers from the Greenhouse 2009 Conference (pp. 101–112). Melbourne: CSIRO Publishing.
Ludwig, F., Milroy, S., & Asseng, S. (2009). Impacts of recent climate change on wheat production systems in Western Australia. Climatic Change, 92(3), 495–517. doi:10.1007/s10584-008-9479-9
Luo, Q., Bellotti, W., Williams, M., & Wang, E. (2009). Adaptation to climate change of wheat growing in South Australia: Analysis of management and breeding strategies. Agriculture, Ecosystems and Environment, 129(1–3), 261–267.
Turner, N. C., Molyneux, N., Yang, S., Xiong, Y.-C., & Siddique, K. H. M. (2011). Climate change in south-west Australia and north-west China: challenges and opportunities for crop production. Crop. Pasture Sci., 62(6), 445–456. doi:10.1071/CP10372
Wang, J., Wang, E., & Liu, D. (2011). Modelling the impacts of climate change on wheat yield and field water balance over the Murray–Darling Basin in Australia. Theoretical and Applied Climatology, 104(3-4), 285–300. doi:10.1007/s00704-010-0343-2
Acknowledgments
The research undertaken as part of this project is made possible by the significant contributions of growers through both workshop and focus group participation and the support of the GRDC, the authors would like to thank them for their continued support. We would particularly like to acknowledge the members of the Ninghan Group, Lakes Information and Farming Technology Group and North Mallee Farm Improvement Group who contributed their time to attending the workshop and providing feedback and comments to the authors on numerous questions raised throughout the project and whose results are reported here.
Contacts
James Fisher, Désirée Futures, james@desireefutures.net.au
Peter Tozer, PRT Consulting prt_consulting@live.com.au
GRDC Project Number: DEF00001
GRDC Project Code: GIA00004,
Was this page helpful?
YOUR FEEDBACK