Taking a long term view of crop rotation pays off
Author: Roger Lawes, CSIRO Agriculture, PMB 5, Wembley, WA 6913 | Date: 01 Mar 2016
Key messages
In the short term (1 – 2 years), it is often best to grow the most profitable crop available, regardless of the future costs or benefit.
A long term view changes the economic perspective as optimal profits decline from $305/ha/yr to $266/ha/yr to $183/ha/yr for a 3, 5 and 10 yr optimisation with high wheat ($350/t) prices.
Lower returns are generated over the long term because the intangible costs of dealing with weeds and disease are taken into consideration, and these are hidden in a short term simulation
For example, with moderate wheat prices ($270/t) in a 3 year rotation, 1 break crop (canola) was chosen.
In a 5 year system 2 break crops (canola) were chosen and in a 10 year system 2 break crops and 2 pastures managed for weeds were chosen by the economic model.
Therefore, in the long term, it pays to crop less intensively, manage the weed seed bank and manage the nutrient status under low prices. However, as wheat prices increase, the number of breaks decreases, regardless of the timeframe.
The weed seed bank triggered the need to grow a break crop. When a long term view of the production system was taken, fewer weeds were required to trigger a break crop. Similarly, when wheat prices were low, the number of weed seeds required to trigger an additional break also declined.
Aims
The decision of when to grow a break crop as part of a cereal rotation is complex. At one level, it is widely acknowledged that break crops enhance the yield of subsequent cereal crops by increasing nutrient supply, interrupting disease life cycles and allowing the farmer to use different weed control options (Angus et al. 2015, Seymour et al. 2012, Lawes et al. 2013). However, when viewed on a single season basis, break crops may not appear profitable in many situations due to either low price of low yield. For example, in Western Australia, lupins were recently valued at $200/t, and potentially unviable at that price. Similarly, in drier climates, break crops like canola and chickpeas have failed during droughts. Therefore, single season gross margins would suggest farmers can generate superior returns by growing continuous cereals.
Simple gross margins ignore future returns, and concepts such as future weed control costs, the effect of disease and changes to nutrient supply. Managing these biotic stresses often leads to improved cereal yields, and higher economic returns for similar or lower levels of input. As a result there is a dichotomy between a cereal dominant rotation that maximises immediate returns and another that includes break crops and focuses on the longer term economic payoff. This is often influenced by commodity prices and the extent of the biotic stresses present in the paddock. Recently, Kirkegaard and Ryan (2104) coined the term “break crop trigger” for defining the biotic conditions when a particular break crop should be grown. However, this should also include the planning horizon and commodity price of the break crop.
We aim to explore the impact that the planning horizon, and commodity price has on the optimum number of break crops grown, and consider how these factors alter the trigger point of weed population that force another break to be included in the crop sequence.
Method
Here, we use LUSO to quantify the costs and benefits of including break crops in the rotation at Kojonup on a sand over gravel soil, where the input parameters are generated via consultation with local growers and the APSIM crop simulation model. We parameterise the Land Use Systems Optimiser (LUSO), for canola, lupins, managed legume pasture, and wheat for the Kojonup region of Western Australia (Table 1). LUSO is a bio-economic state and transition model that integrates the effects of weeds, disease, nitrogen dynamics and crop yields; and determines the economically optimal rotation from a given set of crop or pasture choices. Each crop or pasture influences the weed populations, disease populations and nitrogen dynamics. The weeds and diseases influence the yields of subsequent crops, while the nitrogen dynamics and weed population influences the cost of managing the crop. The model can be used to explore strategic and tactical crop rotation strategies and explore how risky particular rotation sequences are (Lawes and Renton 2010, Lawes and Renton 2015, Renton et al. 2015).
The optimal rotation is evaluated over 3 years, 5 years and 10 years. These optimisations were conducted to determine whether more break crops were selected when the planning horizon gets longer with low and high initial weed pressures. Each scenario was run at a high wheat price ($350/t), that would automatically favour an intensive cereal crop sequence and at a low wheat price ($270/t), where the gross margin for wheat is less favourable.
In order to examine the “break crop trigger” the starting seedbank was increased from the initial population of 50 seeds/m2 at increments of 1 seed/m2 to determine when the starting seedbank brought about a change in the crop sequence. We evaluated this trigger under low and high wheat prices.
Table 1. Land uses and economic parameters defined for the LUSO analysis
|
Enterprise |
Yield (t/ha) |
Low Price ($/t) |
High Price ($/t) |
Cost ($/ha) |
N requirement (kg/ha)
|
Weed survival (0-1) |
|
|
|
|
|
|
|
|
|
Wheat |
3 |
270 |
350 |
250 |
160 |
0.05 |
|
Lupins harvested |
1.5 |
270 |
270 |
200 |
0 |
0.05 |
|
Sprayed pasture |
3 |
0 |
0 |
80 |
0 |
0.03 |
|
Canola |
1.3 |
550 |
550 |
250 |
120 |
0.03 |
|
Lupins manured |
1.5 |
0 |
0 |
150 |
0 |
0.03 |
|
Pasture |
3 |
90 |
90 |
100 |
0 |
0.03 |
Results
For the short (3 yr) planning horizon with high wheat prices a continuous wheat sequence was selected that generated $305/ha/yr (Figure 1). For this particular crop sequence, wheat yields declined from 2.64 t/ha in year 1 to 2.39 t/ha in year 3. The decline in yield occurred because the disease impact increased from 5% in year 1 to 14% in year 3. The losses due to weeds increased from 7% in year 1 to 8% in year 3, and the continuous wheat system left a residual seedbank that increased from 50 seeds/m2 to 305 seeds/m2. The decline in wheat yields resulted in a steady decline in annual returns from $364/ha in year 1 to $250 in the final year of the crop sequence. With low wheat prices, a wheat canola wheat sequence was selected and it generated a cumulative profit of $135/ha/yr. When cereal prices were low, and canola was grown, the steady decline in annual profit did not occur.
For the mid (5 yr) simulation of crop sequences, with high wheat prices, a wheat, wheat, canola, wheat, wheat sequence was selected. After 5 years, this sequence generated a profit of $266/ha/yr. Wheat yields declined from 2.64 t/ha in year 1 to 2.50 t/ha in year 2. The canola crop managed the disease, and wheat yields in year 4 and 5 were equivalent to those of year 1 and 2. The weed population, and yield loss due to weeds had increased from 7% in year 1 to 10% by year 5 and at the conclusion of the crop sequence 972 seeds/m2 were returned to the seedbank. Annual returns declined from year 1 to year 3, when a canola crop was grown. Profits increased after the canola crop before declining again in the final year of the crop sequence (Figure 1). With low wheat prices the crop sequence changed to wheat canola wheat canola wheat for a return of 123/ha/yr. In this scenario, weeds and disease were managed and wheat yields declined from 2.64 t/ha in year 1 to just 2.62 t/ha in year 5. This crop sequence mimicked the start of the 3 year crop sequence.
With the long (10 yr) crop sequence, wheat crops were grown for 3 years, and then a managed pasture, that controlled weeds, was grown. This was repeated, so over a 10 year period, 2 sprayed pastures were grown and 8 wheat crops were grown for an annual return of $183/ha/yr. This particular crop sequence managed the weed burden until the 10th year, when the seedbank increased to 1300 seeds/m2. Wheat yields were reduced to 2.46 t/ha in the final year of the sequence. The pasture was expensive to grow, and generated a loss of $230/ha. However, nitrogen from the pasture contributed to substantial profits in years 5 and 9 of the crop sequence (Figure 1). With low wheat prices a complex crop sequence of wheat, canola, wheat, canola, wheat, wheat, pasture, wheat, pasture, wheat, was selected for a return of $62/ha/yr. The first 3 and 5 years of this sequence mimicked the sequence selected by the 3 and 5 year simulations. However, after that time, weeds became a problem and were again managed with a sprayed pasture (Figure 1).
The “break crop trigger” for the weed seed bank depended on both the wheat price and planning horizon. For both high and low wheat prices the trigger to grow an additional break crop decreased as the planning horizon increased. Furthermore, for a given planning horizon, under low wheat prices the trigger to grow a break less than under high wheat prices (data not shown). Under high wheat prices the optimal crop sequence changed when the starting conditions for the weed seedbank increased from 50 to 750 seeds/m2 for the 3 year crop sequence. A sprayed pasture replaced the second wheat crop in this scenario. For the 5 year rotation, the canola crop was replaced by a sprayed pastured in the second year when the initial weed seed bank increased from 50 seeds/m2 to 148 seeds/m2. The long term crop sequence altered when the starting seedbank increased from 50 seeds/m2 to 131 seeds/m2. The number of wheat crops declined by 1, and the number of pastures grown increased from 3 to 4. Therefore, with high wheat prices, the trigger for an additional break crop declined from 750 seeds/m2 to just 131 seeds/m2 when the planning horizon changed from 3 years to 10 years. For the low wheat price scenario, a crop sequence change occurred when the weed seedbank increased from 50 to 557 seeds/m2, where a pasture replaced the canola. This switch occurred in the 5 yr sequence when the starting seedbank increased from 50 to 158 seeds/m2. Pasture again replaced canola in the 10 yr sequence when the starting seedbank was 82 seeds/m2.
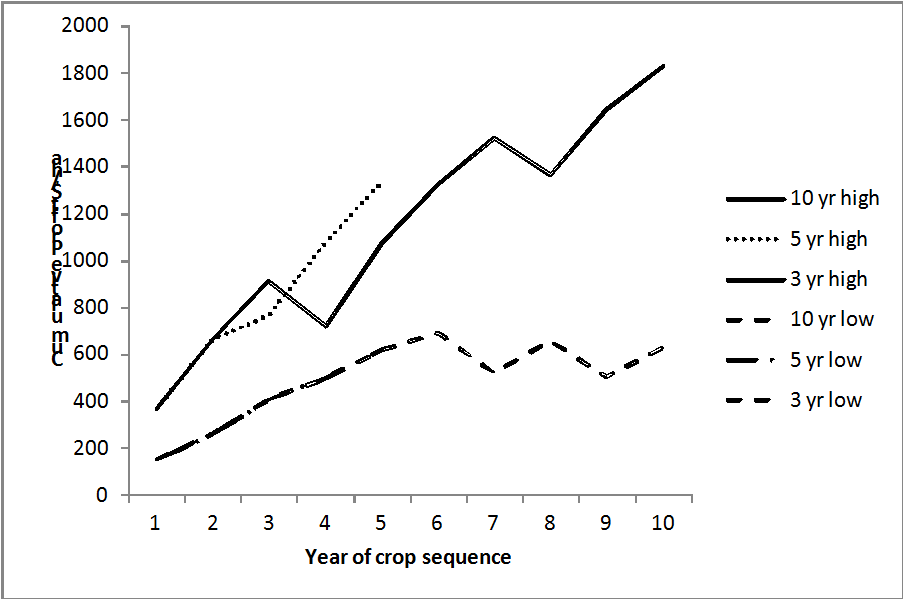
Figure 1. Cumulative profit in dollars per hectare for the the 3 yr, 5 yr and 10 yr optimal crop sequences with low and high wheat prices. The dominant crop is wheat. Pronounced dips indicate that a pasture was grown.
Conclusion
Short term planning of crop rotations artificially inflates returns, because the long term costs of weeds and disease are not accounted for. Over time, break crops or pastures need to be grown to keep weeds and diseases in check. Although these practices may seem expensive, they are necessary to ensure paddocks remain profitable, particularly if wheat prices are low. As wheat prices increase, the number of breaks decline, again demonstrating that the opportunity cost of not growing or growing a wheat crop is an important driver, regardless of the planning horizon.
As the planning horizon increases, and the price of wheat decreases, the number of weed seeds necessary to trigger a break crop or pasture decrease. Therefore, as profit margins tighten, the need to successfully manage the weed seed bank through rotation increases and this explains why the rotation under low wheat prices was similar for the 3,5 and 10 year run. In the short term, it is more profitable to grow the most profitable crop, but at some point, usually after 3 years, a break crop will need to be grown, and they should continue to be grown to maintain the profitability of the system.
References
Angus J, Kirkegaard J, Hunt J, Ryan M, Ohlander, L, Peoples, M (2015) Break crops and rotations for wheat. Crop & Pasture Science, 66, 523-552.
Kirkegaard J, Ryan M (2014) Magnitude and mechanisms of persistent crop sequence effects on wheat. Field Crops Research 164, 154–165.
Lawes R, Renton M (2010) The Land Use Sequence Optimiser (LUSO): A theoretical framework for analysing crop sequences in response to nitrogen, disease and weed populations. Crop & Pasture Science 61, 835–843.
Lawes R and Renton M (2015) Gaining insight into the risks returns and value of perfect knowledge for crop sequences by comparing optimal sequences with those proposed by agronomists. Crop & Pasture Science, 66, 622-633.
Lawes RA, Gupta VVSR, Kirkegaard JA, Roget DK (2013) Evaluating the contribution of take-all control to the break-crop effect in wheat. Crop & Pasture Science 64, 563–572.
Renton M, Lawes R, Metcalf T, Robertson M (2015) Considering long-term ecological effects on future land-use options when making tactical break-crop decisions in cropping systems. Crop & Pasture Science, 66, 634-647.
Seymour M, Kirkegaard JA, Peoples MB, White PF, French RJ (2012) Break-crop benefits to wheat in Western Australia—insights from over three decades of research. Crop & Pasture Science 63, 1–16. Text
Acknowledgments
The Grains Research & Development Corporation (GRDC) is gratefully acknowledged for its financial support of project CSA00029.
GRDC Project Number: CSA00029GRDC Project Code: GIA00004,
Was this page helpful?
YOUR FEEDBACK