Harnessing the benefit of crop residues and tillage to enhance the supply of nitrogen phosphorus and sulphur in the soil
Background
Soil organic matter (SOM) is comprised of progressively decomposing plant, animal and microbial residues, including living microbial biomass, and charcoal (all less than 2mm). Aboveground plant biomass such as stubble is termed ‘crop residues’ Both SOM and crop residues are important resources for sustainable and profitable agriculture. In addition to their positive impacts on key soil quality indicators (such as soil structure, soil water holding capacity, and soil biological activity), both SOM and crop residues may serve as important sources of nutrients (such as nitrogen (N), phosphorus (P) and sulphur (S)) and hence have a direct economic value. These nutrients are released following biological decomposition of SOM and crop residues; a process known as ‘mineralisation’. The nutrient supply from these resources will vary with the type of crop residues and across contrasting tillage systems. Crop residues will interact with existing SOM via enhanced microbial activity to further increase C mineralisation and release N, P and S; this process is known as ‘positive priming’. To harness the benefits of nutrient release from tillage and crop residue input to soil systems, growers need to understand:
- The nutrient supply value of SOM and crop residues.
- How management practices (such as contrasting tillage systems) influence mineralisation of SOM and crop residues and hence nutrient supply; and
- The influence of crop residues on the net release of nutrients from soil and existing SOM
Methodology
Two long-term (16 to 46years) field sites were studied: (i) Condobolin (CW NSW) and (ii) Hermitage (SE Qld). The soil types were: (i) a red soil (Red Chromosol) at Condobolin and (ii) a cracking clay soil (Vertosol) at Hermitage.
Table 1: Site description.
| Location | Condobolin Agricultural Research Station (NSW) | Hermitage Research Station (Qld) |
|---|---|---|
| Coordinates | Latitude 33°05'19"S, Longitude 147° 08'58"E (195 m above sea) |
Latitude 28°12'S, Longitude 152°06'E (470 m above sea) |
| History | Trial established in 1998 | Trial established in 1968 |
| Climate | Hot, semi-arid climate; non-seasonal precipitation | Subtropical; summer-dominant precipitation |
| Soil texture | Sandy clay loam | Clayey |
The selected treatments at the Condobolin site were:
- CT = Conventional tillage (with the short fallow wheat/undersown pasture phase in 2013 and transitioning to pasture phase in 2014);
- RT = Reduced tillage (with the long fallow wheat/undersown pasture phase in 2013 transitioning to pasture in 2014);
- NT = No till (after barley in 2013 and transitioning to pulse phase in 2014); and
- PP = Perennial pasture.
The PP represents the least-disturbed system and is selected as a reference treatment for comparison with the mixed cropping and pasture phases (CT and RT), or the continuous cropping phase system (NT). Basal fertiliser was applied to each crop phase at 50kg MAP per ha. Further details of the management practices at the Condobolin site(accessed: 02.07.16).
The selected treatments at the Hermitage site, comprising mainly wheat cropping phases, were:
NT = No till stubble retained with 90 kg urea-N per ha; and
CT = Conventional tillage stubble retained with 90 kg urea-N per ha.
See Long-term carbon mitigation potential of no-till, nitrogen application and stubble retention practices in a subtropical cereal cropping system (accessed: 02.07.16) for further details of the Hermitage trial site.
In Tables 2 and 3, relevant soil properties of the two field sites are reported. Total C and nutrient contents of the crop residues used in this study are presented in Table 4.
Table 2: Stocks of total carbon (C), nitrogen (N), phosphorus (P) and sulphur (S), and mineral N, P and S, in Red Chromosol (0–10 cm) at Condobolin. Values in brackets are standard errors (n =3).
| Treatments |
Total C | Total N | Total P | Total S | Before incubation (day zero) |
||
|---|---|---|---|---|---|---|---|
| Mineral N | Mineral P | Mineral S | |||||
| tonne/ha |
kg/ha |
||||||
| CT | 17.6 (0.9) | 1.5 (0.0) | 0.6 (0.0) | 0.28 (0.01) | 4.3 (1.2) | 29.8 (5.7) | 12.9 (0.5) |
| RT | 18.6 (1.2) | 1.6 (0.1) | 0.6 (0.0) | 0.26 (0.01) | 2.3 (0.8) | 40.7 (2.5) | 3.1 (2.1) |
| NT | 18.9 (0.9) | 1.7 (0.0) | 0.7 (0.0) | 0.26 (0.01) | 18.1 (1.5) | 21.3 (0.8) | 5.4 (0.3) |
| PP | 20.4 (1.7) | 1.7 (0.1) | 0.6 (0.1) | 0.30 (0.04) | 4.6 (1.2) | 10.6 (2.2) | 23.1 (1.1) |
Table 3: Stocks of total carbon (C), nitrogen (N), phosphorus (P) and sulphur (S), and mineral N, P and S, in Vertosol (0–10 cm) at Hermitage. Values in brackets are standard errors (n =3).
| Treatments |
Total C |
Total N |
Total P |
Total S |
Before incubation (day zero) |
||
|---|---|---|---|---|---|---|---|
| Mineral N | Mineral P | Mineral S | |||||
| tonne/ha |
kg/ha |
||||||
| CT | 22.4 (1.1) | 1.3 (0.1) | 1.2 (0.0) | 0.23 (0.02) | 17.6 (1.3) | 110.6 (14.6) | 17.4 (0.7) |
| NT | 21.7 (1.0) | 1.5 (0.1) | 1.1 (0.0) | 0.19 (0.02) | 15.0 (1.8) | 63.9 (5.4) | 21.2 (2.1) |
Table 4: Carbon and mineral nutrient contents in crop residues.
| Crop residue type | Total carbon | Total nitrogen | Total phosphorus | Total sulphur |
|---|---|---|---|---|
| kg/tonne | ||||
| Wheat stem | 454.3 | 3.7 | 1.8 | 0.3 |
| Canola stem | 448.7 | 9.1 | 2.1 | 2.0 |
Soil sampling, laboratory incubation and analyses
Soil samples were collected from the topsoil layer (0–10cm) in May 2014 at the crop pre-sowing stage from contrasting tillage treatments at both field sites and also from the perennial pasture system at the low pasture growth stage at Condobolin. The soils were incubated for one and four months under controlled soil moisture and temperature conditions. The main aim was to quantify the nutrient supply potential of SOM and crop residues (wheat and canola) across contrasting soil types and management practices.
Soil samples, with and without incorporation of crop residue (at the rate of 10tonne/ha), were placed in jars in three separate containers of 35g each. Moisture was adjusted to 60 per cent of soil water holding capacity and the soils were then incubated at a constant temperature (22 degrees C). The CO2-C released (mineralisable C) was periodically measured. Mineral N (NH4+-N and NO3--N), mineral P (PO43--P; standard Colwell-P) and mineral S (SO42--S), were extracted by 2 M KCl, 0.5 M NaHCO3 and 0.016 M KH2PO4, respectively, at one and four months. Net nutrient availability for N, P or S following the simultaneous mineralisation (organic to inorganic forms), immobilisation (inorganic to organic forms) and fixation (adsorption on soil minerals and/or precipitation with metal cations) processes during SOM mineralisation over one month or four months was quantified:
(i) Net plant-available N = Extractable mineral N1 or 4-month – Extractable mineral Nday0
(ii) Net plant-available P = Colwell P1 or 4-month – Colwell Pday0
(iii) Net plant-available S = Extractable mineral S1 or 4-month – Extractable mineral Sday0
The isotopic-C labelled crop residues were used to distinguish sources of residue C mineralisation from the SOM mineralisation. That is, the C released from the added crop residues and existing SOM was separately quantified. This allowed us to quantify the primed mineralisation of C from existing SOM due to the application of residues, which is the difference between C mineralisation in the presence and absence of crop residues. So if there is a positive priming effect of crop residues to enhance SOM mineralisation or mobilise mineral-bound nutrients, there could be additional release nutrients from soil and existing SOM.
Results and discussion
Impact of tillage on mineralisation of carbon in SOM and crop residues in contrasting soils
Over four months, 1.3 to 1.9 per cent (depending on tillage treatment) of C in SOM was released in the red soil at Condobolin (Figure 1), and 1.8 to 2.0 per cent was released in the cracking clay soil at Hermitage (data not shown), across different management practices. There was a greater mineralisation of C in SOM under CT than NT and PP at the Condobolin site. Furthermore, total C mineralisation after the addition of crop residues (i.e. the combined C in SOM and residues) was greater under CT compared to conservation tillage systems (RT and/or NT) across both field sites (data not shown for the Hermitage site). Preliminary results from the red soil at Condobolin show that the addition of crop residues (wheat or canola) increased mineralisation of C in SOM. This priming effect was greater under CT and decreased as the tillage intensity was reduced (for example, in RT and NT systems). Mineralisation of added residue C was also greater under CT than RT and/or NT systems at Condobolin. These results are consistent with the well-established paradigm that less soil disturbance in no-till and perennial pasture systems may stabilise microbial activity and enhance protection of SOM and residues in stable aggregates, consequently decreasing their accessibility to microbial attack, compared to conventional tillage.
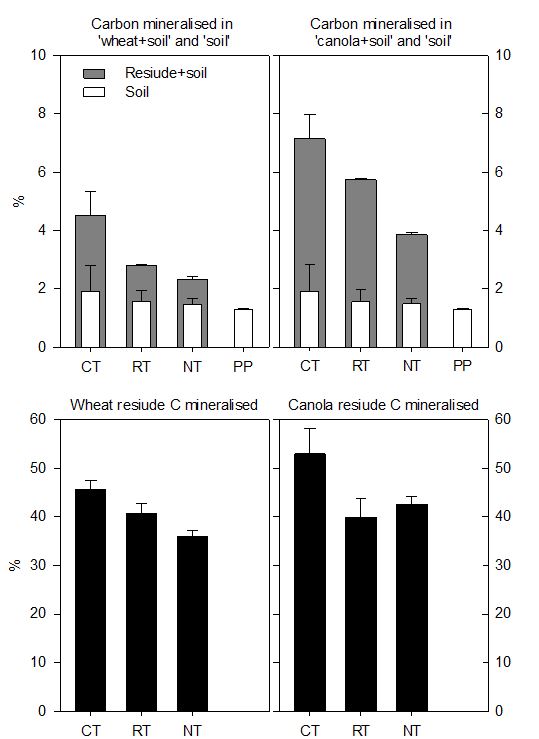
Figure 1: Cumulative percent of soil carbon (C) mineralised (top panel) in the presence and absence of residues, as well as residue C mineralised (bottom panel), over four months of laboratory incubation. Wheat (left panel) and canola (right panel) stem residues were incorporated in the red soil (Red Chromosol) from differently managed cropping systems at Condobolin, except in the PP system. See expanded abbreviation of treatments (CT, RT, NT and PP) in the methodology section.
Interactive effect of crop residue and tillage on the nutrient supply potential in contrasting soils
The results provide useful information on the fertiliser value of SOM and crop residues (wheat or canola) in terms of N, P and S supply in two contrasting soils (the red soil and the cracking clay soil) across contrasting tillage systems. The results show that:
- Plant-available N. Depending on management practices, SOM could supply 12–23kg N per ha over one month (short-term mineralisation), which increased to 15–36kg N per ha over four months in the red soil (Condobolin, NSW) (Figure 2a,d). In the cracking clay soil (Hermitage, Qld), SOM could supply 8–14kg N per ha over one month and 22–24 kg N per ha over four months (Figure 3a,d). Thus, mineral N continued to be released over four months during microbial decomposition of SOM. Consistent with the pattern of C mineralisation, net mineralisable N was greater in the CT than other systems with reduced or no tillage intensity (RT, NT or PP), particularly over the first month.
- Plant-available P. SOM could supply available P i.e. 10–22kg P per ha in the red soil (Figure 2b.e), and 23–56kg P per ha in the cracking clay soil over one month (Figure 3b,e). Over four months, net available P was negative, ranging between 4 and −31kg P per ha at the Condobolin site and between -13 and -101kg P per ha at the Hermitage site. At the Condobolin site, RT resulted in the greatest net P immobilisation and PP the lowest. While at the Hermitage site, CT had the greatest net P immobilisation relative to the NT. This could be due to microbial immobilisation and/or fixation of inorganic P by clay minerals and metal cations in the soils.
- Plant-available S. SOM could supply available S in the range of 5–22kg S per ha over one month (Figure 2c,f), with CT > NT and PP at the Condobolin site (red soil). However, this S released via SOM mineralisation in the short term in the red soil was immobilised over four months, possibly by microorganisms. In the cracking clay soil (Hermitage site), no S was released both over one and four months (Figure 3c,f).
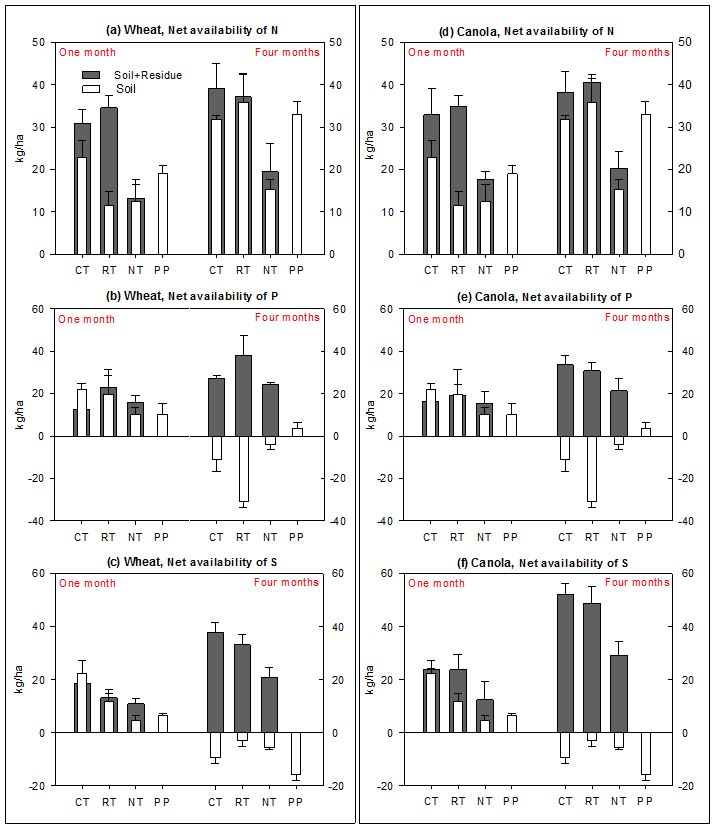
Figure 2: Impact of tillage practices at the Condobolin site (NSW) on net availability of nitrogen (a, d), phosphorus (b, e) and sulphur (c, f) released from soil only, and soil plus added wheat (left panel) and canola (right panel) residues over one month and four months of laboratory incubation. See expanded abbreviation of treatments (CT, RT, NT and PP) in the methodology section for the Condobolin site.
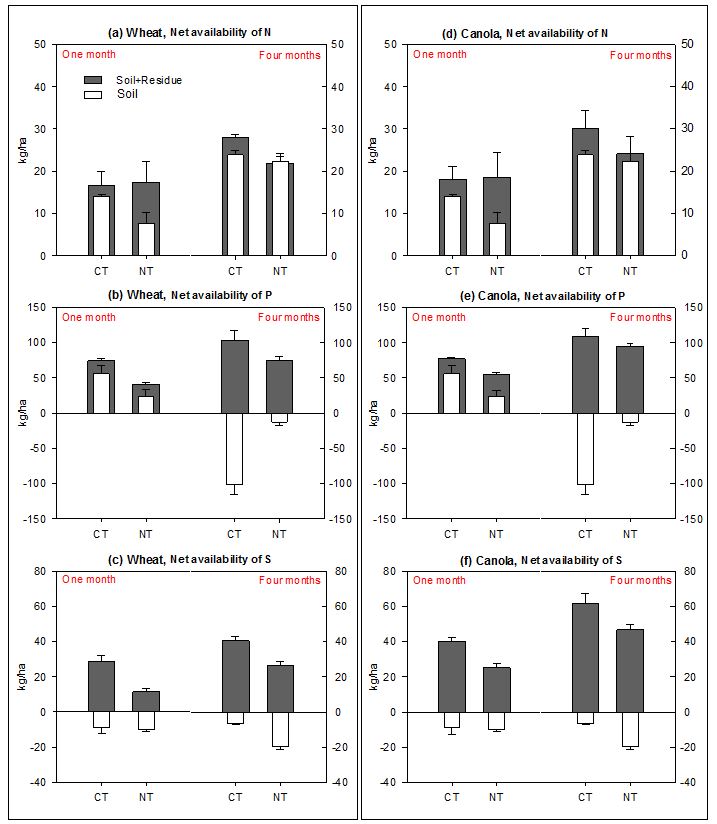
Figure 3: Impact of tillage practices at the Hermitage site (Qld) on net availability of nitrogen (a, d), phosphorus (b, e) and sulphur (c, f) released from soil only, and soil plus added wheat (left panel) and canola (right panel) residues over one month and four months of laboratory incubation. See expanded abbreviation of treatments (CT, NT) in the methodology section for the Hermitage site.
In relation to harnessing the benefits of nutrient supply from crop residues, our results show crop residue incorporation may assist in offsetting the immobilisation process of both P and S in the contrasting soils (red soil and cracking clay soil). For example, microbial activity and mineralisation of existing SOM may be stimulated by the addition of crop residues (Figure 1). Furthermore, crop residue input may mobilise nutrients bound to the soil, particularly P. Thus, these processes have the potential to enhance nutrient supply in the soils beyond the direct input of nutrients via crop residues (Table 3). In summary, our results show that crop residue input at 10tonne per ha across the contrasting tillage systems (with CT greater than or equal to RT and NT) could enhance net nutrient availability by:
Red soil (Condobolin, NSW)
- over one month:
- 13–34kg N per ha (wheat residue) and 18–35kg N per ha (canola residue).
- 13–23kg P per ha (wheat residue) and 15–19kg P per ha (canola residue).
- 11–19kg S per ha (wheat residue) and 12–24kg S per ha (canola residue).
- over four months:
- 19–39kg N per ha (wheat residue) and 20–41kg N per ha (canola residue).
- 24–38kg P per ha (wheat residue) and 21–34kg P per ha (canola residue).
- 21–38kg S per ha (wheat residue) and 29–52kg S per ha (canola residue).
Cracking clay soil (Hermitage, Qld)
- over one month:
- 16–17kg N per ha (wheat residue) and 18–19kg N per ha (canola residue).
- 40–74kg P per ha (wheat residue) and 54–77kg P per ha (canola residue).
- 11–29kg S per ha (wheat residue) and 25–40kg S per ha (canola residue).
- over four months:
- 22–28kg N per ha (wheat residue) and 24–30kg N per ha (canola residue).
- 74–103kg P per ha (wheat residue) and 95–109kg P per ha (canola residue).
- 27–41kg S per ha (wheat residue) and 47–62kg S per ha (canola residue).
Conclusion
- This study indicates that mineral N could continue to be released over a four-month period, while mineral P and S could also be released over a one-month period during SOM decomposition under ideal soil moisture conditions.
- SOM could supply plant-available nutrients in the range of 8–36kg N, 10–56kg P and 5–22kg S per hectare across the contrasting soil types and management practices.
- Conventional tillage can enhance C mineralisation and simultaneously the net release of plant-available nutrients (N, P and S) in soil, relative to NT or long-term PP.
- Growers must however consider a trade-off between enhancing soil C mineralisation and nutrient release through tillage operations that disrupt soil aggregates and expose SOM for microbial attack, versus slowing soil C loss and nutrient release while improving soil structure via NT or inclusion of long-term pasture phases.
- Our data also suggest that any short-term (one month) released mineral P and S could be locked up in the soils via microbial immobilisation or adsorption on minerals over the longer term (four months), particularly if there is a lack of plant C input (e.g. during a fallow period).
- This study shows that crop residue input has the potential to counteract nutrient immobilisation in soil.
- The net release of plant-available P and S resulting from incorporation of crop residues can be greater than the total P and S in the residues due to the interaction with SOM and soil minerals.
- Our data suggest that SOM and crop residues have the potential to enhance the supply of major nutrients (N, P, S) to the value of $3 to $5 billion in Australia ($0.75 to $1.25 billion in NSW). These calculations are based on (a) nutrient costs of $1 per kg N, $3 per kg P and $1 per kg S, and (b) ~20 million hectares of agricultural lands under some forms of crop stubble management in Australia and ~5 million hectares in NSW (Australian Bureau of Statistics).
- It is recommended that the economic value of nutrient supply from SOM and crop residues requires validation under realistic field conditions with variability in environmental conditions (such as high temperatures and low water availability).
Acknowledgements
The research undertaken as part of this project is made possible by the significant contributions of growers through both trial cooperation and the support of the GRDC, the author would like to thank them for their continued support.
Thanks to Luke Beange and Abigail Jenkins for reviewing an early draft of the paper, and Central West Farming Systems for providing access to their long-term trial.Contact details
BP Singh
NSW Department of Primary Industries, Elizabeth Macarthur Agricultural Institute, Woodbridge Rd, Menangle NSW 2568
02 4640 6406; 0410130711
bp.singh@dpi.nsw.gov.au
GRDC Project Code: DAN00169,
Was this page helpful?
YOUR FEEDBACK