A test of nitrogen fertiliser use efficiency in wheat using mid row banding
Author: Graeme Sandral, Ehsan Tavakkoli, Felicity Harris and Eric Koetz (Department of Primary Industries, Wagga Wagga Agricultural Institute, Wagga Wagga, NSW). | Date: 14 Feb 2017
ɸExtra technical comment by Protech Consulting Pty Ltd
Take home messages
- Mid-row banding of urea at sowing provided a higher profit at a lower nitrogen (N) application rate than urea either spread and incorporated by sowing, or spread at DC30.
- Mid-row banding of urea established an ammonium band/tube in the soil at approximately 15cm below the soil surface which was still present at DC31 (end of July). The ammonium band was more pronounced at higher rates of N and not evident at low N rates.
- Roots proliferated around the ammonium band at the highest N rate.
- Nitrogen applied either by mid-row banding or spreading N at DC31 tended to produce higher grain yields, grain protein and N use efficiency than N spread and incorporated by sowing.
Aim
To explore the potential for improving nitrogen (N) use efficiency through the mid-row banding of urea.Background
Fertiliser costs represent a significant component of variable costs for growing grain crops and are generally the largest single variable input for grain production. Fertiliser costs are estimated to represent 15-20% of all cash costs and 20-25% of variable costs (Australian Bureau of Agricultural and Resource Economics (ABARE) 2016). The high cost of fertiliser has caused grain growers to focus on nutrient management in an attempt to control input costs and reduce financial risk.
Typically, N fertiliser is applied to wheat at sowing, for example, monoammonium phosphate (MAP) or diammonium phosphate (DAP), and again in the vegetative phase around DC30 to DC31 (urea). The in-crop efficiencies of N retrieval vary greatly and approximate 50% when considering a large cross section of research findings. This information is used in N budgeting where, for example, the estimated wheat yield (6t/ha) x protein (11%) x 2.34 (conversion coefficient) = crop N requirement (154kg N /ha). Because the retrieval efficiency of N by wheat from soil is approximately 50%, the crop N requirement is divided by 0.5 to provide the soil N requirement (308kg N/ha). From the soil N requirement (308kg N/ha), soil mineralised N is subtracted (estimated 100kg N/ha mineralised over the growing season) to provide an estimate of the fertiliser N required (208kg N/ha). Small increases in the efficiency with which wheat extracts N from the soil can result in significant fertiliser savings. In this example, a 15% improvement in efficiency of N retrieval from the soil, represents a saving of 72kg N/ha or approximately $72/ha where N is valued at $1/kg, for example, urea $460/t at 46% N.
The aim of this research was to investigate the possible improvements in N use efficiency through the use of mid-row N banding. In this first experiment, we compare three methods of applying N for three varieties of wheat.
Theory behind the approach of banding N
The approach to this research was based on some previously existing knowledge. Firstly, that N banding in the mid-row skip-row arrangement (Figure 1) would provide a concentrated tube like formation of ammonium in the soil where the urea was banded. The urea (CO(NH2)2) transforms to ammonia (NH3) and then to ammonium (Figure 2). Ammonium (NH4+) is positively charged and bonds to clay particles ensuring it does not leach easily. Angus et al. (2014) showed that the high concentration of the ammonium band is hostile to bacteria that convert ammonium firstly to nitrite (N02-) and then nitrate (NO3-) which, being negatively charged, leaches easily through the soil profile. Hence, the first important advantage is provided where the banding N approach maintains more N higher in the soil surface profile where root density is higher, compared with surface spreading where the urea is quickly converted to nitrate which is leached deeper in the soil profile where root density is lower. The distribution of N and roots in the soil profile is likely to impact on the efficiency of N uptake based on the opportunity for uptake.
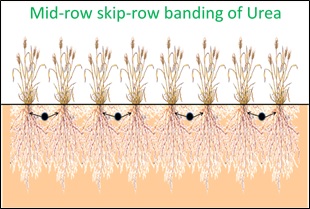
Figure 1. Diagrammatic example of urea placement (black dots) for the nitrogen banded treatment.
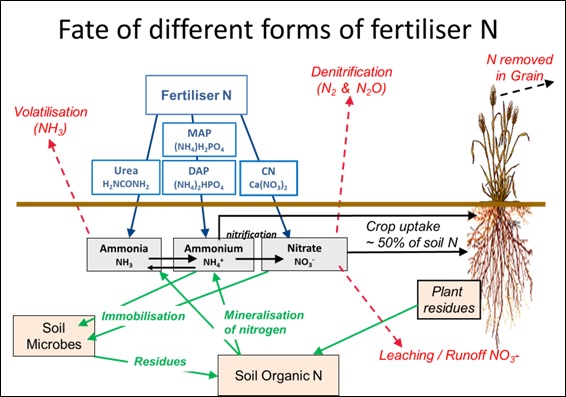
Figure 2. Diagrammatic example of nitrogen based fertiliser pathways in the soil.
Initially, the ammonium tube is not only hostile to bacteria but is also hostile to plant roots. The effect of this is to limit N uptake by seedlings and so prevent excessive vegetative growth that can lead to haying off in dry conditions and foliar disease and lodging in wet conditions. However, through the course of time, the outer ammonium tube is converted to nitrate and plant roots can start to preferentially allocate roots around the band (see photo in Figure 3 provided by John Passioura). Hence this provides the second important advantage where preferential root proliferation around the N band increases the root surface area and potentially the efficiency of N uptake. The third important advantage is that the process of denitrification needs N in the nitrate form and under waterlogging conditions ( greater than 80% of field capacity), the nitrate is converted to nitrous oxide (N2O), nitric oxide (NO) and N gas (N2) and lost to the atmosphere. Hence, if N is in the ammonium form, the process of denitrification cannot occur until ammonium is converted to nitrate. The fourth advantage may not apply to this particular research effort, however this advantage would occur with deeper placement of banded N at approximately 20 to 25cm where soil microbe populations are significantly lower and conversion of ammonium to nitrate would be further delayed keeping N in the ammonium form for longer. In this experiment, N was banded in the 10 to 15cm layer.
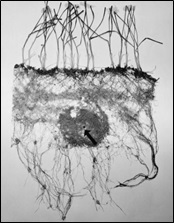
Figure 3. Excavated root system of wheat plants whose roots were provided with a concentrated band of ammonium sulphate at the head of the arrow.
Method
This experiment was conducted at the Wagga Wagga Agricultural Institute. The experimental design was three varieties, six N rates and three N application methods (mid-row banding, spread pre-sowing and spread at DC30) with all N applied as urea (Table 1) as a fully randomised complete block design with four replicates.
Table 1. Varieties, N rates and N application methods.
| Variety | x | N rate (kg/ha) | x | Application method |
|---|---|---|---|---|
| Beckom | 0 | Mid-row banding (4 May) | ||
| Spitfire | 25 | Spread pre-sowing sowing (4 May) | ||
| Corack |
50 80 120 160 |
Spread at DC31 (21 July) |
For all application methods, the rates of N from 50 to 160kg/ha included 25kg/ha applied below each seed row and the rest applied by the specified method. Data presented are primarily for Beckom and Spitfire which are both eligible for Australian Hard (AH) on the wheat quality classification.
The soil at the experimental sites is a red Kandosol, pHCa 5.1 (0-10cm) which had a starting mineral N content of 142kg/ha (4 May). The previous crop was canola. At sowing, phosphorus (P) as triple super was drilled 50mm below seed at 25kg P/ha. At each N rate except the 0 rate, 25kg of N/ha was applied as urea under the seed with the triple super. The mean plant density achieved at DC14 was 125 plants/m2 and was not significantly different between treatments. The experiment was direct drilled with DBS tynes spaced at 240mm using a GPS auto-steer system.
Weed management included glyphosate (450g/L) at 1.2L/ha plus 2,4-D (625g/L) at 320mL/ha during the fallow period (January to April 2016). In-crop weed control was undertaken by applying the pre-emergents Sakura® (pyroxasulfone 850g/L) at 118g/ha and Logran® (triasulfuron 750g/L) at 35g/ha on 4 May and was incorporated at sowing.
Precautionary disease control was implemented, seed was treated with Hombre®Ultraɸa [imidacloprid (360g/L) and tebuconazole (12.5g/L)] at 200mLs/100kg and Prosaro® (prothioconazole 210g/L and tebuconazole 210g/L) was applied at 300mL/ha at DC30 and DC37 to prevent and/or supress rust infections. Early detection of aphids was controlled at late stem elongation with Aphidex® (Pirimicarb 500g/kg) at 250g/haɸb.
ɸaHombre Ultra is not registered for use on rust, only on bunt and smuts. ɸbLabel states 250-300g/ha is the rate for WA only, the rate for all other states is 150 g/ha.
The experiment was harvested on 15 December to determine grain yield. Grain protein and seed quality were estimated using near infra-red (NIR) (Foss Infratec 1241 Grain Analyzer) and Seed Imaging (SeedCount SC5000R), respectively. Nitrogen removal was estimated by protein (%)/5.7 (conversion constant) x grain yield (t/ha). Agronomic efficiency of fertiliser N was calculated by (Y+N – Y-N)/Nrate where Y+N is grain yield with N, Y-N is grain yield with no N and Nrate is the amount of fertiliser N applied. Economic returns after N costs were determined by multiplying grain yield (t/ha) at the plot level by payment ($/t) per tonne. Payment ($) per tonne was either $160 (ASW1), $181 (APW1 >10.5% protein), $209 (H2 >11% protein) or $243 (APH2 >13% protein). All other criteria (test weight, screenings and stained grain) were within grain category standards. Nitrogen costs as urea were assumed to be $1/kg of N, for example $460/tonne of urea at 46% N.
Soil mineral N was measured for the variety Beckom at sowing (4 May), DC31 (29 July) and anthesis (30 September) by coring to 200cm and measuring soil ammonium and nitrate at depths 0-10, 10-20, 20-30, 30-60, 60-100, 100-150 and 150-200cm. Root length was measured in the Beckom plots at the N rates 80 and 160kg N/ha by soil coring to 150cm in the same segment sections used for soil N. Cores were taken 6cm in from the crop row which was also 6cm off the N banding row. Soils were then washed and root retained and root length determined using Winrhizo.
Results and discussion
Soil nitrogen
Soil N measurement at sowing (4 May)
Soil N measured just prior to sowing (142kg/ha) was predominantly concentrated in the top 20cm of soil (dotted line with diamond symbol in Figure 4). Available N was 142kg N/ha and was mostly in the nitrate form with small amounts of ammonium at depth (data not shown).
Soil N measurement at DC31 (end of July)
The pre-sowing N treatment provided increasing soil N as the N rate increased which was most evident at the depth 60 to 100cm and is shown in Figure 4 as the solid line and square symbol at the 80cm depth. Notably, the pre-sowing treatment had N predominantly in the nitrate form (data not shown) in the lower subsoil (Figure 4 graphs on the left hand side).
In the DC31 treatment, the N measurement at the end of July (DC30 solid line and square symbol) shows that N was mostly confined to the soil surface (Figure 4 middle graphs) and this N was largely in the ammonium form but was under rapid conversion to nitrate (data not shown).
In the banding N treatment, N measurement at the end of July showed increasing soil N with increasing N application rates. It also shows at the higher rates of N applied that soil N was conserved in the soil surface (Figure 4, solid line and square symbol, graphs on the right hand side) as ammonium (data not shown) and provides evidence that the conservation of N in the ammonium form from sowing to DC30 (end of July) is possible even under very wet conditions conducive to de-nitrification.
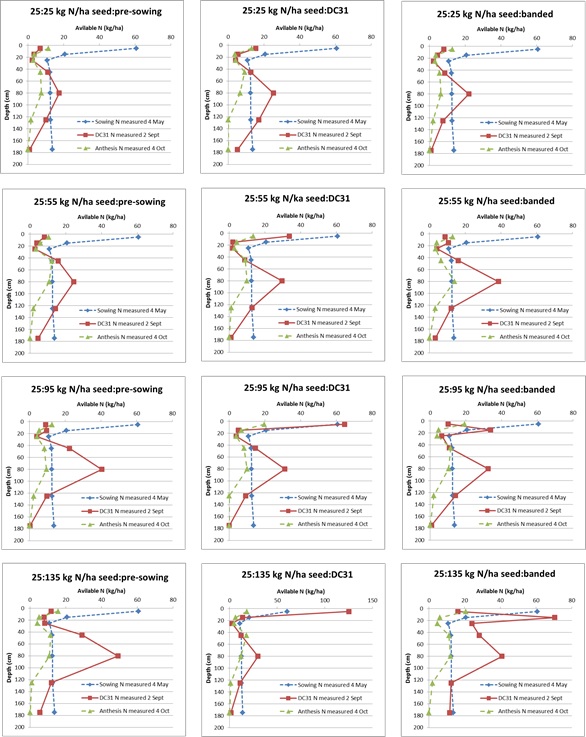
Figure 4. Total soil available N (kg/ha) for the pre-sowing, DC31 and banded N treatments and their rates measured at the time of sowing (4 May) and just after DC31 (2 Sept) and anthesis (4 Oct). Soil measurement depths were 0-10, 10-20, 20-30, 30-60, 60-100, 100-150 and 150-200cm. For graphing purposes, the soil depth data is presented at the following depths 5, 15, 25, 40, 80, 125 and 175cm.
Soil N measurement at anthesis (end of September)
Soil N differences between N application methods and N rates were negligible when tested at anthesis (dashed line with triangle symbol Figure 4), probably because of both high plant N uptake prior to this period and ideal conditions for de-nitrification during 2016, such as warm and wet.
Root length
Root length (cm) was measured at anthesis, 6cm out from the crop row and 6cm out from the N band. Measurements show that at the highest banded N rate of 160kg N/ha (135kg N/ha in the band), root length was significantly higher than for any other treatment (shown in bold Table 2). This effect has been shown in other species to significantly increase the efficiency of nutrient uptake and is a promising feature of this research, but needs to be achieved at lower rates of N.
Table 2. Root length (cm) measured at anthesis for Beckom at depths of 0-10, 10-20, 20-30, 30-60, 60-100, 100-150 and 150-200cm.
| Treatment | 0-10 cm | 10-20 cm | 20-30 cm | 30-60 cm | 60-100 cm | 100-150 cm | Total |
|---|---|---|---|---|---|---|---|
| nil_0 | 2247 | 204 | 148 | 771 | 1035 | 65 | 4470 |
| Banding_80 | 2542 | 533 | 173 | 523 | 1252 | 29 | 5052 |
| DC30_80 | 2444 | 536 | 200 | 829 | 926 | 42 | 4976 |
| PreSowing_80 | 1199 | 433 | 185 | 784 | 946 | 80 | 3627 |
| Banding_160 | 2375 | 1126 | 373 | 901 | 1436 | 49 | 6260 |
| DC30_160 | 2160 | 510 | 210 | 755 | 1243 | 35 | 4913 |
| PreSowing_160 | 1427 | 546 | 218 | 860 | 1716 | 70 | 4837 |
| LSD P=0.05 | 341 |
Grain yield and protein
Grain yield was highest in the banded N (banded at sowing) and DC31 (surface spread at DC31) treatments and lowest for the pre-sowing surface spread N treatment (incorporated by sowing operation), although comparisons between methods of application at the same rate of N were often not significantly different (Figure 5a, 5b and 5c). Peak grain yield was frequently reached at 120kg N/ha. Beckom had significantly greater grain yield compared with Spitfire and Corack, which had similar yields.
Grain protein on average tended to be highest in the N banding treatment, particularly at the higher N rates (Figure 5d). The DC31 treatment had similar proteins to the N banding treatment in most but not all comparisons, while the pre-sowing surface spread N application often resulted in a tendency for lower grain protein.
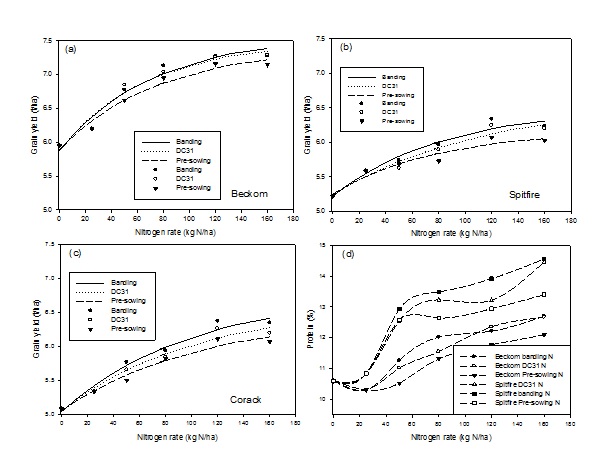
Figure 5. Grain yield response of Beckom (a), Spitfire (b) and Corack (c) to increasing N rates applied by either; (i) ’banding’ urea at sowing between every second crop row, (ii) spreading urea in front of the seeder ’pre-sowing’ or (iii) surface spreading urea at ’DC31’ growth stage. Lines represent the fitted Mitscherlich equation [y = a - b*(e-cx)] and symbols represent the mean data value for each treatment. Figure 1 (d). Grain protein (%) response for BeckomA and SpitfireA to increasing N rate using three methods of application previously outlined above. Symbols represent the mean data value for each treatment.
Agronomic N efficiency and economic returns
Agronomic N efficiency of grain production ranged from 5.1 to 17.9 (kg grain per kg N) and tended to be generally higher with banded N than with N spread pre-sowing (Tables 3a and 3b). There was also a tendency for agronomic efficiency of N to be highest at lower N rates, although this was not always the case.
Economic returns after considering N costs, wheat variety, grain protein, screenings, test weight and stained grain are estimated in Table 3a and 3b for Beckom and Spitfire, respectively. Returns for Beckom were highest in the N banding treatment at 80kg N/ha ($1,409), while the highest return for the DC30 and pre-sowing treatments were at 120kg N/ha ($1,347 and $1,343, respectively). Although these differences were within measurement error ($114/ha), there was a lower risk profile associated with banding N due to the low input cost of N.
Table 3(a). Grain yield (t/ha), protein (%), screenings (%), percent stained grain, agronomic efficiency (kg of grain per kg of N applied), N removal in grain (kg N/ha) and net return after N costs for Beckom calculated at the plot level (not calculated on mean table values). Bold indicates the highest value within each N treatment. Economic returns after N costs are based on $1/kg of N and $160 (ASW1), $181 (APW1 >10.5% protein), $209 (H2 >11% protein) or $243 (APH2 >13% protein).
| Treatment Beckom |
Grain yield (t/ha) | Protein (%) | Screenings (%) | Stain (%) | Agronomic Efficiency | N kg/ha removal | Net ($/ha) after N costs ($1/kg) |
|---|---|---|---|---|---|---|---|
| nil_0 | 5.9 | 10.5 | 1.4 | 0.1 | 110.9 | $1,019 | |
| seed_25 | 6.2 | 10.3 | 1.1 | 0.4 | 10.0 | 111.7 | $1,030 |
| Banding_50 | 6.8 | 11.3 | 1.7 | 0.5 | 16.5 | 133.7 | $1,201 |
| Banding_80 | 7.1 | 12.0 | 2.2 | 0.9 | 14.7 | 150.2 | $1,409 |
| Banding_120 | 7.3 | 12.2 | 2.7 | 1.1 | 11.0 | 155.7 | $1,399 |
| Banding_160 | 7.3 | 12.7 | 2.5 | 1.5 | 8.3 | 161.9 | $1,360 |
| DC31_50 | 6.8 | 11.0 | 1.1 | 0.4 | 17.9 | 132.2 | $1,248 |
| DC31_80 | 7.0 | 11.5 | 1.7 | 0.5 | 13.6 | 142.4 | $1,340 |
| DC31_120 | 7.3 | 12.4 | 1.7 | 1.2 | 10.9 | 157.2 | $1,397 |
| DC31_160 | 7.3 | 12.7 | 2.1 | 1.0 | 8.4 | 161.9 | $1,363 |
| PreSowing_50 | 6.6 | 10.5 | 1.1 | 0.3 | 13.4 | 122.2 | $1,079 |
| PreSowing_80 | 6.9 | 11.3 | 1.6 | 0.3 | 12.5 | 137.8 | $1,225 |
| PreSowing_120 | 7.2 | 11.8 | 1.8 | 0.4 | 10.1 | 147.7 | $1,343 |
| PreSowing_160 | 7.1 | 12.1 | 1.4 | 1.4 | 7.5 | 151.6 | $1,333 |
| LSD P=0.05 | 0.3 | 0.90 | 0.72 | 1.15 | 6.7 | 7.6 | $114 |
Table 3(b). Grain yield (t/ha), protein (%), screenings (%), percent stained grain, agronomic efficiency (kg of grain per kg of N applied), N removal in grain (kg N/ha) and net return after N costs for Spitfire calculated at the plot levels (not calculated on mean table values). Bold indicates the highest value within each N treatment.
| Treatment Spitfire |
Grain yield (t/ha) | Protein (%) | Screenings (%) | Stain (%) | Agronomic Efficiency | N kg/ha removal | Net ($/ha) after N costs ($1/kg) |
|---|---|---|---|---|---|---|---|
| nil_0 | 5.2 | 10.6 | 0.2 | 1.1 | 97.0 | $891 | |
| seed_25 | 5.6 | 10.8 | 0.6 | 0.9 | 14.6 | 106.0 | $955 |
| Banding_50 | 5.7 | 12.9 | 0.5 | 2.0 | 10.3 | 130.2 | $1,247 |
| Banding_80 | 6.0 | 13.5 | 0.6 | 3.3 | 9.4 | 141.4 | $1,322 |
| Banding_120 | 6.3 | 13.9 | 0.6 | 4.6 | 9.3 | 154.8 | $1,420 |
| Banding_160 | 6.2 | 14.6 | 1.1 | 4.7 | 6.3 | 159.2 | $1,355 |
| DC31_50 | 5.6 | 12.5 | 0.5 | 2.8 | 8.1 | 123.9 | $1,174 |
| DC31_80 | 5.9 | 13.2 | 0.5 | 2.7 | 8.4 | 136.8 | $1,253 |
| DC31_120 | 6.2 | 13.2 | 0.9 | 3.1 | 8.6 | 144.8 | $1,292 |
| DC31_160 | 6.2 | 14.5 | 0.9 | 3.6 | 6.1 | 157.2 | $1,347 |
| PreSowing_50 | 5.7 | 12.6 | 0.3 | 2.1 | 9.3 | 125.4 | $1,147 |
| PreSowing_80 | 5.7 | 12.6 | 0.5 | 2.8 | 6.3 | 127.0 | $1,166 |
| PreSowing_120 | 6.1 | 12.9 | 0.6 | 3.0 | 7.1 | 137.9 | $1,252 |
| PreSowing_160 | 6.0 | 13.4 | 1.1 | 3.8 | 5.1 | 141.7 | $1,305 |
| LSD P=0.05 | 0.3 | 0.92 | 0.72 | 1.15 | 6.7 | 7.6 | $114 |
The range of agronomic N efficiency for Spitfire ranged from 5.1 to 14.6kg grain/kg of N fertiliser with the banded N treatments tending to have higher agronomic efficiencies than the DC30 and pre-sowing N treatments, although differences were not significant. Economic returns for banded N at 120kg N/ha for Spitfire ($1,420/ha) were significantly higher than for the best pre-sowing N treatment of 160kg N/ha ($1,305) with the most economical DC30 N treatment also occurring at 160kg N/ha ($1,347).
Nitrogen removal in grain (N off-take) was always higher in the N banding treatment and lowest in the surface spread pre-sowing treatment indicating the banding method had a higher N efficiency (Tables 3a and 3b). The banding treatment also had N off-take amounts similar to or greater than the DC30 treatment. Nitrogen off-take approximated fertiliser N input for both the banding and DC30 treatments at the 160kg N/ha rate.
Conclusion
Mid-row banding of N shows promise as a strategy to improve N use efficiency in wheat. This work has shown that the banding of urea creates an ammonium tube in the soil that reduces the risk of excess seedling growth and which is not readily leached (see banding treatment in Figure 4). It also shows that wheat can increase root length around the ammonium band (Table 2) which has been shown to increase nutrient use efficiency in other species. The highest N removal rates were achieved by banding and the most profitable rate of banded N fertiliser was always lower than with the other application methods (Tables 3a and 3b).
Future research
Future research could examine how P inclusion in the N band improves root length proliferation around the ammonium band as P is known to facilitate this phenomenon in other species. New formulations of N fertilisers, particularly those that inhibit conversion of ammonium to nitrate have not been tested in banding circumstance and this may add efficiencies to banding, particularly at lower N rates. The combination of these factors is worth testing to push N use efficiency further.
References
Angus, J. F., Gupta V. V. S. R., Pitson G. D. and Good A. J. (2014). Effects of banded ammonia and urea fertiliser on soil properties and the growth and yield of wheat. Crop & Pasture Science, 65, 337–352.
Acknowledgements
The research undertaken as part of this project is made possible by the significant contributions of growers through both trial cooperation and the support of the GRDC — the author would like to thank them for their continued support.
Organisation: NSW Department of Primary Industries for funding of this preliminary experiment. Technical staff: BinBin Xu, Vincent Van Der Rijt, Graeme Poile, Wayne Pitt, Andrew Price, Hugh Kansley, Greg McMahon, Jessica Simpson and Hayden Petty.
Contact details
Graeme Sandral
Department of Primary Industries
Wagga Wagga Agricultural Institute, Pine Gully Rd, Wagga Wagga NSW 2650
0409 226 235
graeme.sandral@dpi.nsw.gov.au
@gsandral
@NSWDPI_Agronomy
Was this page helpful?
YOUR FEEDBACK