Effect of nitrogen timing on barley performance in a season with a dry start, wet middle and dry finish (aka 2015 season)
Author: Blakely Paynter and Raj Malik, Department of Agriculture and Food Western Australia | Date: 28 Feb 2017
Key messages
- Despite there being a dry start, a wet middle and a dry finish in this study, there was a strong biomass response (as measured by NDVI) to applied nitrogen (N) and a small increase in plant height. The lack of grain filling rainfall, however, resulted in the grain yield plateauing at 45 kg N/ha (45N). Screenings were generally above the Malt2 limit of 35% even at the lowest rate of N of 15 kg N/ha (15N) (except Dandaragan).
- N rate did not act independently of N timing. High and late N often optimises grain protein without influencing grain yield or other grain quality parameters, but in this study with a dry finish, the high and late N around stem elongation (even a split application) was detrimental to grain yield and grain quality resulting in higher screenings, high grain protein and decreased returns.
- The varieties sown – Bass, Compass, Flinders, Granger, La Trobe and Scope CL – did not consistently differ in their response to applied N or to differences in the timing of the applied N. At first glance this would suggest that the same N strategy can be recommended. Ultimately it is the weakness (be it poor straw strength, low grain plumpness and/or inherent grain protein concentration) of the variety that determines which N strategy can or should be deployed.
Aims
Western Australian growers have access to a wide range of commercial barley varieties with a malt (or under evaluation) classification. These varieties differ in their:
- genetics and pedigree (BVSG 2016),
- duration to awn emergence (Paynter 2015; BVSG 2016),
- straw strength (Malik and Paynter 2015; BVSG 2016),
- grain yield (Hills et al. 2014; Malik et al. 2014; BVSG 2016; Paynter et al. 2016),
- grain yield response to applied nitrogen (N) (Paynter et al. 2015, 2016),
- grain quality traits (Hills et al. 2014; Malik et al. 2014; BVSG 2016; Paynter et al. 2013, 2015, 2016), and
- inherent grain protein concentration (Paynter and van Burgel 2014; Paynter et al. 2015, 2016).
Some of the different phenotypes displayed include:
|
Variety |
Straw strength |
Hectolitre weight |
Grain plumpness |
Grain protein |
|---|---|---|---|---|
|
Commander |
Fair |
Fair |
Moderately good |
Lower |
|
Compass |
Fair |
Fair |
Good |
Lower |
|
Scope CL |
Fair |
Moderately good |
Fair |
Low by yield dilution |
|
La Trobe |
Moderately good |
Good |
Moderately good |
Low by yield dilution |
|
Granger |
Good |
Moderately good |
Moderately good |
Low by yield dilution |
|
Flinders |
Very good |
Good |
Moderately good |
Slightly higher |
|
Bass |
Very good |
Good |
Good |
Higher |
Given this diversity of phenotypes, is there a standard N management strategy that applies to all the new “malt” varieties or should the N strategy used vary by variety? In 2014, different N strategies were applied to three malt varieties differing in their inherent grain protein concentration, Bass, Commander and Granger, by Malik and Paynter (2015). In that study (four trials), a lack of variety interactions with N rate and N timing meant that no differences in N management strategies were observed.
Malik and Paynter (2015) did however observe a consistent interaction between N rate and N timing on grain protein, suggesting that at higher rates of applied N, later application N at 5 or 10 weeks after sowing (WAS) had a much larger impact on grain protein than N applied earlier at seeding (0 WAS). In general a single application at 5 or 10 WAS had a higher grain protein than the same rate split evenly over three timings. This was similar to the observations of Paynter (2017) with La Trobe and implied by Paynter (2005) and Hills and Paynter (2008) for Baudin and Gairdner and Baudin and Vlamingh respectively. The difference between the studies of Paynter (2005) and Hills and Paynter (2008) in comparison to that of Malik and Paynter (2015) was that the varieties assessed did not differ in their inherent grain protein concentration whereas they did in the newer study.
To date, much of the N management research conducted with barley has suggested that N rate is more important than N timing, but that N timing can be used to optimise the N rate required (Paynter 2005; Hills and Paynter 2008; Malik and Paynter 2015; Paynter 2017). Late N, however, improves the chances of delivering grain within the target malt barley protein window but can in some seasons also increase screenings. Early N also promotes taller straw which may increase lodging risk in susceptible varieties.
The aim of this study was look at a wider range of varieties than assessed by Malik and Paynter (2015) to assess whether or not N management strategies (both N rate and N timing) need to vary because of known differences in the phenotype of the varieties being grown.
Method
Six trials were conducted to compare the response of six spring barley varieties (Bass, Compass, Flinders, Granger, La Trobe and Scope CL) to different N management strategies. The trials were located at Dandaragan, Wongan Hills, Cunderdin, Merredin, York and Pingrup in 2015 (Table 1). Each site was sprayed with a knockdown herbicide before seeding. Fungicide treated barley seed (target establishment of 150plants/m2) was direct-drilled into canola stubble at 2–3cm depth with a small plot air-seeder using knife points and on-row packing (press wheels). CSBP Super CZM was banded below the seed at 120kg/ha. Selected treatments received N (top dressed as urea) at varying rates (N rate) at four timings (N timing). N rates were 15, 45 and 105 kg N/ha (15N, 45N and 105N). N timings (WAS, weeks after seeding) were a single application of N at 0 WAS (at seeding), 5 WAS (mid tillering) or 10 WAS (stem elongation) or that rate split evenly over each of the three timings (ie. 15N as a single application at 0, 5 or 10 WAS or 5N at each of the three timings). Post-seeding herbicides were used to control grass and broadleaf weeds as required. Leaf diseases were controlled as required.
Barley establishment counts were recorded at 2-3 WAS. Plots were assessed by NDVI at 10, 14 and 18 WAS using a hand-held Greenseeker®. Plant height (cm to base of ear) and lodging scores (from 9, no lodging, to 0, completely lodged and effectively un-harvestable) were recorded close to harvest. Grain yields were recorded at harvest and cleaned (>1.5mm) samples were used to determine grain quality including 1000 kernel weight (mg, db), hectolitre weight (kg/hL), screenings (%<2.5 mm), grain protein concentration (%, db by NIR), grain brightness (‘L*’ by NIR) and grain hardness (SKCS units by NIR).
Data was analysed within Genstat (VSN International 2013) with a treatment design of 6 varieties x 3 N rate x 4 N timing, a block structure of (rep+colrep)/(variety.N rate)/N timing and a design structure of design structure of variety*N rate*N timing. Each site was sown as six banks of 10m plots with two replicates per bank and a total of three replications per treatment.
Table 1. Details for the six barley agronomy N rate x N timing experiments in 2015 sown into canola stubble.
|
Trial number
|
Location
|
Sown (date) |
May-Oct rainfall (mm) |
Soil pHCa (0-10cm) |
Organic C (%, 0-10cm) |
Soil type
|
|---|---|---|---|---|---|---|
|
15GE19 |
Dandaragan |
03-May-15 |
315 |
5.1 |
1.85 |
friable red loamy earth |
|
15WH15 |
Wongan Hills |
22-May-15 |
315 |
6.5 |
1.57 |
brown sand over gravel |
|
15NO18 |
Cunderdin |
21-May-15 |
167 |
5.5 |
0.95 |
grey shallow sandy duplex |
|
15ME10 |
Merredin |
22-May-15 |
211 |
5.1 |
1.05 |
red sandy earth |
|
15NO19 |
York |
19-May-15 |
201 |
5.5 |
1.29 |
red-brown deep loamy duplex |
|
15KA14 |
Pingrup |
19-May-15 |
167 |
5.5 |
0.90 |
grey deep sandy duplex |
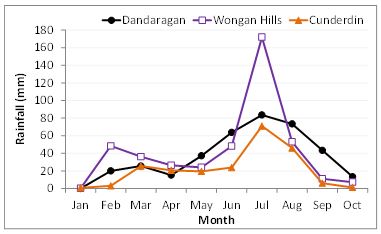
Figure 1a
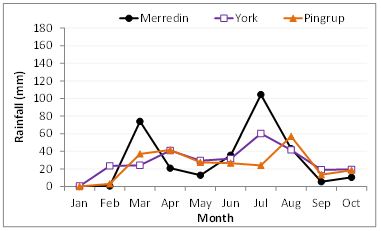
Figure 1b
Figure 1. Monthly rainfall (January to October) at each of the six sites.
Results
Biomass, plant height, lodging and grain yield
The 2015 season can be best described as a season with some summer rain, a dry establishment period and tillering period, a wet stem elongation period and a dry grain filling period (Figure 1).
The varieties sown differed in their phenotype (Table 2). On average, Compass had the highest NDVI at 10, 14 and 18 WAS and La Trobe the lowest. Scope CL was generally the tallest variety and Flinders the shortest variety. Compass and Scope CL had the poorest straw strength. Compass and La Trobe were the highest yielding varieties and Granger the lowest, averaged across sites.
Applied N influenced crop production by increasing NDVI (a surrogate for biomass) and slightly increasing plant height and the lodging risk. Due to the dry grain filling period in 2015, increases in NDVI were not associated with increases in grain yield, except at Cunderdin and Dandaragan (Figures 2 and 3). Grain yield with 45N was higher than 15N at three sites (Dandaragan, Cunderdin and York) and same at the other three. Grain yield with 105N was higher than 15N at two sites (Dandaragan and Cunderdin), lower at one site (Merredin) and the same at the other two. Grain yield with 105N was higher than 45N at no sites, lower at two sites (Merredin and York) and the same at the other four sites. Changes in plant growth in response to increasing applied N were not influenced by variety.
Table 2. a) likelihood of variety, N rate, N timing and their interaction being significant (p<0.05) on plant growth traits across six trials. Significance: rarely = occurred in ≤20% trials, occasionally = 20-40% trials, 50% chance = 40-60% trials, often = 60-80% trials and consistently = ≥80% trials significant, and b) NDVI, plant growth and grain yield as variety, N rate and N timing varied.
|
a) Likelihood of variety, N rate, N timing and their interaction being significant (p<0.05) |
|||||||
|---|---|---|---|---|---|---|---|
|
Trait |
NDVI – 10 WAS |
NDVI – 14 WAS |
NDVI – 18 WAS |
Plant height |
Lodging |
Grain yield |
Grain yield |
|
Source |
(0-1) |
(0-1) |
(0-1) |
(cm, ear base) |
(9-0) |
(t/ha) |
(% 15N at 0 WAS) |
|
Variety (V) |
consistently |
consistently |
consistently |
consistently |
consistently |
consistently |
rarely |
|
N rate (NR) |
consistently |
consistently |
consistently |
consistently |
often |
often |
50% chance |
|
V x NR |
rarely |
rarely |
rarely |
rarely |
rarely |
rarely |
rarely |
|
N timing (NT) |
consistently |
consistently |
consistently |
50% chance |
rarely |
50% chance |
50% chance |
|
V x NT |
rarely |
rarely |
rarely |
occasionally |
rarely |
rarely |
rarely |
|
NR x NT |
consistently |
rarely |
consistently |
rarely |
rarely |
consistently |
consistently |
|
V x NR x NT |
rarely |
rarely |
rarely |
rarely |
rarely |
rarely |
rarely |
|
b) Average biomass, plant growth and grain yield as variety, N rate and N timing varied |
|||||||
|---|---|---|---|---|---|---|---|
|
Variety – main effect |
|||||||
|
Bass |
0.728 |
0.777 |
0.594 |
56 |
8.4 |
3.67 |
106% |
|
Compass |
0.741 |
0.763 |
0.617 |
68 |
7.4 |
4.00 |
103% |
|
Flinders |
0.705 |
0.755 |
0.590 |
54 |
8.5 |
3.73 |
105% |
|
Granger |
0.715 |
0.760 |
0.606 |
64 |
8.4 |
3.59 |
103% |
|
La Trobe |
0.632 |
0.712 |
0.554 |
60 |
8.4 |
3.99 |
105% |
|
Scope CL |
0.736 |
0.784 |
0.660 |
74 |
7.4 |
3.69 |
100% |
|
N rate – main effect |
|||||||
|
15N |
0.681 |
0.700 |
0.542 |
60 |
8.2 |
3.69 |
101% |
|
45N |
0.710 |
0.761 |
0.605 |
63 |
8.1 |
3.87 |
106% |
|
105N |
0.738 |
0.814 |
0.663 |
65 |
7.9 |
3.78 |
103% |
|
N timing – main effect |
|||||||
|
0 WAS |
0.735 |
0.755 |
0.591 |
63 |
8.1 |
3.79 |
104% |
|
5 WAS |
0.716 |
0.747 |
0.581 |
62 |
8.1 |
3.81 |
104% |
|
10 WAS |
0.670 |
0.769 |
0.638 |
63 |
8.1 |
3.72 |
102% |
|
Split |
0.716 |
0.763 |
0.604 |
63 |
8.1 |
3.80 |
104% |
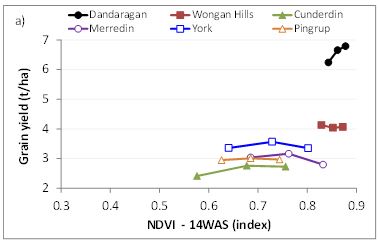
Figure 1a
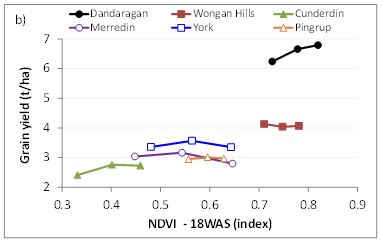
Figure 2b
Figure 2. Relationship between a) NDVI at 14 WAS and grain yield and b) NDVI at 18 WAS and grain yield at each of the six sites. For each location, each data point represents a different N rate (increasing from left to right from 15 to 45 to 105 kg N/ha).
N timing consistently influenced NDVI, did not influence lodging risk (mostly because there was a low lodging risk at most sites anyway) and influenced plant height at three of the sites (Table 2). NDVI recorded at 10 WAS for the 5 WAS, 10 WAS and split N treatments were generally lower than the 0 WAS N treatment (Figure 3). At both 14 and 18 WAS, NDVI for the 5 WAS N treatment was similar to or less than the 0 WAS N treatment, whilst the 10 WAS and split N treatments were generally higher than the 0 WAS N treatment. Averaged across N rates, there was no effect of N timing on grain yield at three sites (Dandaragan, Wongan Hills and Cunderdin). At Merredin, York and Pingrup, the 5 WAS and split N treatments had the same grain yield as the 0 WAS N treatment whilst the 10 WAS N treatment was slightly lower yielding (averaged across N rates). Changes in plant growth in response to N timing were not influenced by variety.
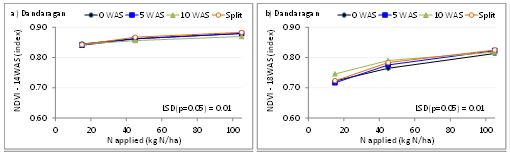
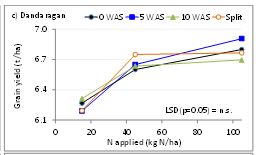
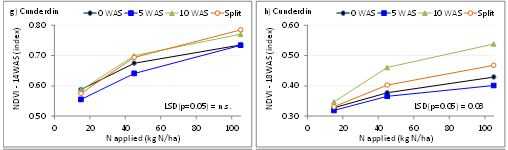
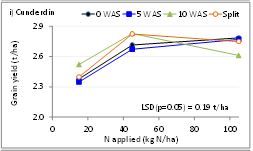
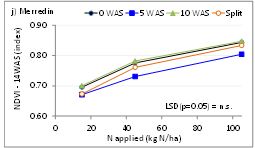
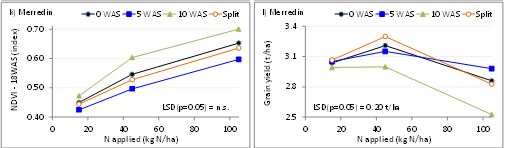
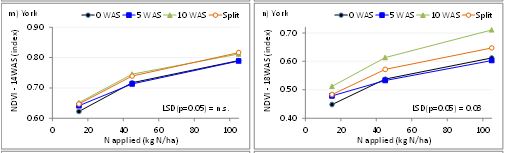
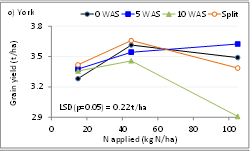
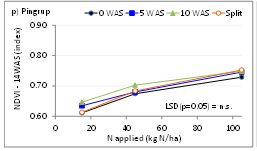
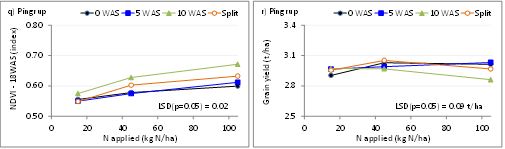
Whilst there were main effects for both N rate and N timing on most plant growth traits except lodging, there was also consistent interactions between N rate and N timing on NDVI at 10 and 18 WAS (not at 14 WAS) and grain yield, but not on plant height (Table 2). At 14 WAS, the change in NDVI (effectively biomass) due to N was the same for each N timing treatment, except at Dandaragan (Figure 3). By 18 WAS, there was a general increase in NDVI with the 10 WAS N treatment compared to the other N timings, except at Dandaragan. At harvest, however, the 10 WAS N treatment resulted in decreases in grain yields, particularly with 105N (except Dandaragan and Wongan Hills) (Figure 3). This would suggest that that treatment simply ran out of water, given the increased NDVI measured at 18 WAS. In general, the yield of a single application of N at 5 WAS gave a similar yield to the same total rate split evenly over three timings. The interaction between N rate and N timing on NDVI and grain yield was not influenced by variety.
Grain quality
Varieties differed in their grain quality (Table 3). Flinders and La Trobe had the lightest kernel weight. Compass had the lowest hectolitre weight and Bass the highest. Compass was the plumpest variety, with La Trobe and Scope CL generally having the highest screenings. Compass and La Trobe had the lowest grain protein. Flinders had the hardest grain and Granger the softest when averaged across sites.
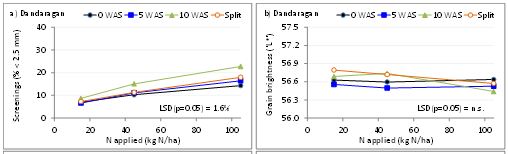
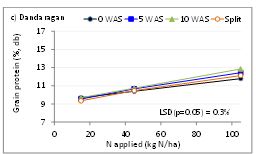
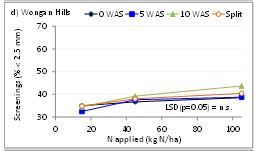
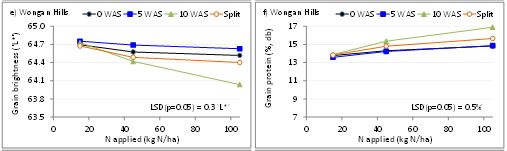
Across sites, applied N decreased kernel weight and hectolitre weight and increased screenings and grain protein (Table 3). Grain brightness was only influenced at three sites, Wongan Hills, Cunderdin and Pingrup, and only slightly (<0.5‘L*’), with no effect at the other three sites (Figure 4). Grain hardness increased at two sites (Dandaragan and Pingrup) and decreased at the other four sites. Grain quality responses to applied N were not regularly influenced by variety.
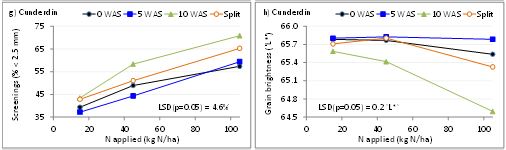
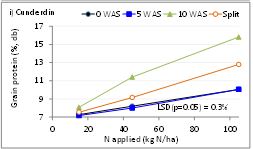
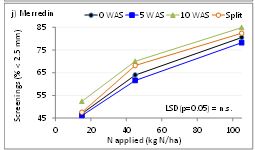
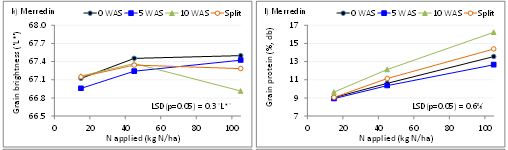
N timing consistently influenced grain quality and largely acted independently of variety (Table 3). Across sites, plots that received late N at 10 WAS had the lowest kernel weight and hectolitre weight and the highest screenings and grain protein (Figure 4). The split N treatment had the next lowest kernel weight and hectolitre weight and the next highest screenings and grain protein. This was different to the grain yield results where the 5 WAS N treatment and split N treatment were generally the same yield, but the split N grain had poorer physical quality and higher grain protein than the 5 WAS N treatment. The influence of N timing on grain brightness and grain hardness was variable, with the 10 WAS more likely to be the N timing treatment with a different quality. For grain brightness applied N at 10 WAS increased grain brightness at two sites (York and Pingrup), was the same at one site and lower at three sites (Cunderdin, Wongan Hills and Merredin). The average change was small being less than 1‘L*’ (Figure 4). For grain hardness, applied N at 10 WAS increased grain hardness at one site (Dandaragan), was the same at one site and lower at four sites (Cunderdin, Wongan Hills, Merredin and York) (data not shown).
Table 3. a) likelihood of variety, N rate, N timing and their interaction being significant (p<0.05) on grain quality traits and return (yield by price minus costs) across six trials. Significance: rarely = occurred in ≤20% trials, occasionally = 20-40% trials, 50% chance = 40-60% trials, often = 60-80% trials and consistently = ≥80% trials significant, and b) grain quality and return as variety, N rate and N timing varied.
|
a) Likelihood of variety, N rate, N timing and their interaction being significant (p<0.05) |
|||||||
|---|---|---|---|---|---|---|---|
|
Trait |
Kernel weight |
Hectolitre weight |
Screenings |
Grain brightness |
Grain protein |
Grain hardness |
Return |
|
Source |
(mg, db) |
(kg/hL) |
(% < 2.5 mm) |
('L*') |
(%, db) |
(SKCS units) |
($/ha) |
|
Variety (V) |
consistently |
consistently |
consistently |
consistently |
consistently |
consistently |
consistently |
|
N rate (NR) |
consistently |
consistently |
consistently |
50% chance |
consistently |
consistently |
consistently |
|
V x NR |
rarely |
50% chance |
rarely |
occasionally |
rarely |
occasionally |
rarely |
|
N timing (NT) |
consistently |
consistently |
consistently |
consistently |
consistently |
consistently |
often |
|
V x NT |
rarely |
occasionally |
rarely |
occasionally |
occasionally |
occasionally |
rarely |
|
NR x NT |
consistently |
50% chance |
50% chance |
50% chance |
consistently |
consistently |
often |
|
V x NR x NT |
rarely |
rarely |
rarely |
rarely |
rarely |
occasionally |
rarely |
|
b) Average grain quality and return as variety, N rate and N timing varied |
|||||||
|---|---|---|---|---|---|---|---|
|
Variety – main effect |
|||||||
|
Bass |
35.5 |
71.4 |
38.7 |
62.6 |
11.7 |
62 |
$390 |
|
Compass |
35.0 |
67.9 |
33.9 |
65.1 |
10.8 |
60 |
$461 |
|
Flinders |
31.8 |
70.0 |
47.5 |
63.1 |
11.8 |
65 |
$384 |
|
Granger |
35.2 |
70.4 |
43.9 |
61.4 |
11.6 |
57 |
$341 |
|
La Trobe |
32.0 |
69.8 |
53.2 |
64.0 |
10.8 |
63 |
$414 |
|
Scope CL |
36.1 |
70.1 |
52.2 |
63.0 |
11.7 |
61 |
$368 |
|
N rate – main effect |
|||||||
|
15N |
36.1 |
70.9 |
35.4 |
63.3 |
9.8 |
61 |
$411 |
|
45N |
34.5 |
70.2 |
44.4 |
63.2 |
11.1 |
62 |
$419 |
|
105N |
32.2 |
68.8 |
54.8 |
63.1 |
13.3 |
60 |
$349 |
|
N timing – main effect |
|||||||
|
0 WAS |
34.9 |
70.2 |
42.0 |
63.2 |
10.8 |
62 |
$404 |
|
5 WAS |
34.9 |
70.2 |
42.0 |
63.2 |
10.8 |
62 |
$399 |
|
10 WAS |
33.2 |
69.4 |
49.7 |
63.1 |
12.5 |
60 |
$384 |
|
Split |
34.1 |
69.9 |
45.8 |
63.2 |
11.5 |
61 |
$384 |
As with NDVI at 10 WAS and 18 WAS and grain yield, there was at least a 50% chance of an interaction between N rate and N timing on grain quality (Table 3). This interaction was not influenced by variety.
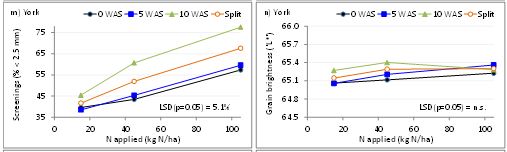
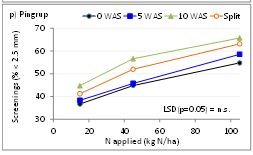
At the three sites with a significant N rate by N timing screenings interaction (Dandaragan, Cunderdin and York), the increase in screenings with applied N was greater with the 10 WAS N treatment followed by the split treatment (Figure 4). At the other three sites, N timing did not influence the increased in screenings due to increased N.
At the three sites with a significant N rate by N timing grain brightness interaction (Wongan Hills, Cunderdin and Merredin), the change in grain brightness with applied N was greatest with the 10 WAS N treatment (Figure 4). At those sites, the grain from the high rate of N (105N), late applied (10 WAS) treatments were significantly darker than any other treatment. At the other three sites, N timing did not influence the change in grain brightness due to increased N.
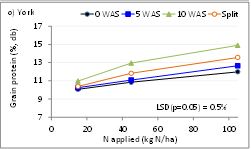
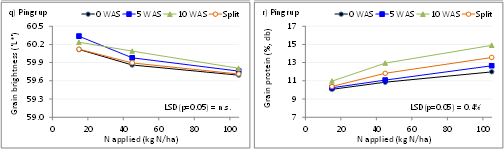
At all sites, increases in grain protein associated with applied N were greatest when the N was applied at 10 WAS, followed by the split application, followed by applying all the N at seeding (0 WAS) or at 5 WAS, which were generally similar (Figure 4).
Economics of N management in barley in 2015
An economic analysis calculating return (yield by price minus costs) was done for each variety, N treatment (rate and timing) and site, using the assumptions in Table 4 and the 2016/17 GIWA Barley receival standards for Western Australia. The average return ($/ha) across all six sites is presented in Table 3. It should be noted that these trials were not designed to determine the optimum N treatment for each variety. The treatments chosen were designed to facilitate the discrimination of varietal performance rather than be economic rates of N application. Operating costs do not take into account differences in disease control that may be required and the analysis assumes all varieties can be delivered to the same bin.
Table 4. Assumptions used in the economic analysis of the six N management trials.
Due to the tight, dry finish screenings were high (generally >35%) at all sites except Dandaragan. Combined with high grain protein, over 95% of the replicate samples assessed at Wongan Hills, Cunderdin, Merredin and York did not meet Malt1 or Malt2 receival specifications (data not shown). Nearly 20% of samples at Pingrup and 75% of samples at Dandaragan, however, met Malt1 or Malt2 barley receival specifications. At those two sites, Bass and Compass generally met Malt1 or Malt2 receival specifications more often than the other varieties evaluated with Granger the least (data not presented).
|
Variety |
Indicative cash price ($/t) |
EPR ($/t) – malt and feed |
1000 seed weight (g) |
Seed rate (kg/ha) for 150 plants/m2 |
||
|---|---|---|---|---|---|---|
|
Malt1 |
Malt2 |
BFed1 |
||||
|
Bass |
$255 |
$220 |
$210 |
$3.50 |
45 |
86 |
|
Compass |
$250 |
$220 |
$210 |
$3.80 |
45 |
86 |
|
Flinders |
$250 |
$220 |
$210 |
$3.80 |
42 |
80 |
|
Granger |
$250 |
$220 |
$210 |
$2.95 |
45 |
86 |
|
La Trobe |
$250 |
$220 |
$210 |
$4.00 |
42 |
80 |
|
Scope CL |
$250 |
$220 |
$210 |
$3.50 |
45 |
86 |
|
Establishment per cent |
80% |
|||||
|
Barley receival + BAMA |
$12.50 |
$/t |
|
|
|
|
|
Freight: farm to port |
$22.50 |
$/t |
farm to bin + bin to natural port |
|
||
|
Seed cost |
$350 |
$/t |
|
|
|
|
|
Seed dressing cost |
$61 |
$/t |
|
|
|
|
|
Germination percent |
98 |
% |
|
|
|
|
|
Operating costs |
$180 |
$/ha |
fuel, P fertiliser, weed control, foliar fungicides |
|||
|
Urea cost |
$420 |
$/t |
|
|
|
|
|
Urea spreading cost |
$5 |
$/ha |
at seeding |
|
|
|
|
Urea spreading cost |
$10 |
$/ha |
at 5 and 10 WAS |
|
|
|
|
R&D levy |
1.02% |
farm gate value |
|
|
|
|
|
Note: cash price for Compass and Granger assumed to be similar to Flinders, La Trobe and Scope CL. |
||||||
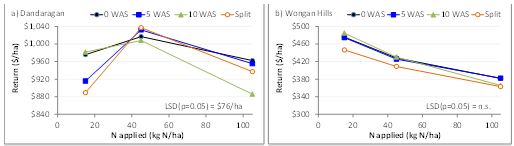
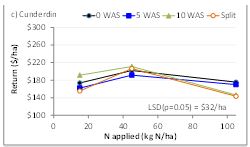
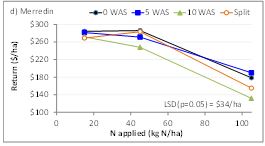
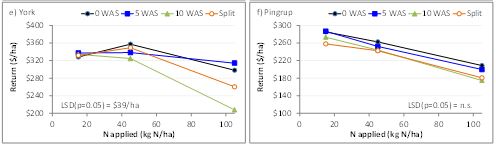
Figure 5. Interaction between N rate and N timing on return (yield by price minus costs) at each of the six sites.
Across all sites, varieties consistently differed in their return (yield by price minus costs), with Compass making more $/ha (assuming the same price and receival standards apply as for an accredited malt variety, although it has not yet been classified by Barley Australia) and Scope CL the lowest (Table 3). On average, the return from 15N and 45N was the same, but decreased when 105N was applied (Table 3 and Figure 5). The timing of the N often influenced the return, with returns from N at 10 WAS lower than at 0 WAS at three sites (Merredin, York and Pingrup), and returns from the even split N treatment lower than the 0 WAS treatment at two sites (Wongan Hills and Pingrup).
N timing, however, often interacted with N rate (Table 3 and Figure 5). At both Wongan Hills and Pingrup, returns decreased with increasing N, with the split treatment having slightly lower returns than the other three single application N treatments (partly because of the extra application costs associated with multiple applications of N). At the other four sites, the return from 45N was similar to or better than the return from 15N and better than the return at 105N. With increasing N, the return from the 10 WAS N application was generally less than the other N treatments, followed by the split application. The return from the 0 and 5 WAS N treatments were similar across the range of N rates and N timings.
Conclusion
In 2015 N application at seeding (0 WAS) and mid tillering (5 WAS) was largely applied to dry soil whilst the N applied at the beginning of stem elongation (10 WAS) was applied to wet soil (Figure 1). At all sites, N increased the biomass (as measured by NDVI) recorded at or around flag leaf emergence (14 WAS) (Table 2). The biomass response to N at 14 WAS was not influenced by the timing of the N, but was when measured at mid grain filling (18 WAS) (Table 2 and Figure 3). By 18 WAS the later applied N (10 WAS and split application) resulted in a larger biomass response to applied N than the earlier applied N, except at Dandaragan. Higher N plots were also taller (Table 2).
With the dry finish to the season, the extra biomass produced from the higher N plots resulted in little change in lodging risk, increased grain yield to 45N but then plateaued at most sites, increased screenings, increased grain protein, had variable effects on grain brightness and produced a lower return (yield by price minus costs) (Figures 4 and 5). As N increased, grain yield and grain quality of the 10 WAS N treatment in particular, followed by the split treatment, was more affected by the dry spring than the earlier applied N treatments.
Varieties differed in their phenotype; that is their NDVI (effectively biomass), plant height, straw strength, grain yield and grain quality (Tables 2 and 3). Surprisingly, they did not regularly differ in how they responded to increasing N nor did they differ in their response to changes in the timing of the applied N. The lack of variety interaction to N rate is consistent with the observations of Paynter et al. (2013) (except for screenings), but not Hills and Paynter (2008) and Paynter et al. (2016). Screenings was the most likely grain quality trait where varietal differences in response to N application were observed.
As per Malik and Paynter (2015), we found no evidence that variety specific N strategies were warranted and that focusing on achieving the right rate of N that matches seasonal conditions should be the primary target. N timing effectively helps to achieve the right rate.
In saying that, N management strategies need to take into account the weaknesses of the variety being sown. For example, the N management strategies for varieties with a narrow kernel and a higher screenings risk will be more tempered than for varieties with a plumper grain and a lower screenings risk. As applied N is more likely to increase the screenings risk of varieties with a narrow grain shape (Figure 4; Hills and Paynter 2008; Paynter 2017; Paynter et al. 2013, 2016), growers cannot be as bullish in applying N to match any increased yield potential as they can with a plumper grain variety. That is it should be easier to get the rate right for a plump grain variety than a narrow grain variety. Whilst varieties may not respond differently except for screenings, if they have weak straw then the effect of high N will be more noticeable on the harvestability of the paddock given they start with poor straw strength even at low N. Also, varieties with an inherent low grain protein concentration will benefit from N application at or after stem elongation, as long as they have plump grain. So ultimately it is the weakness of the variety (ie. poor straw strength, narrow kernels, low grain protein) that determines which N strategy can or should be deployed.
It is clear that seasonality strongly influences the optimum N strategy that maximises grain yield, minimises screenings and optimises grain protein. Although Malik and Paynter (2015) did not find a consistent interaction between N rate and timing on grain yield in a year with a softer finish, with a dry finish in this study, the biomass response to late and high N was detrimental to filling grain resulting in a tempered grain yield result and poor grain quality. In fact, the seasonal finish was so bad in 2015 that even at low rates of N application screenings were already above the Malt2 limit of 35%.
Paynter (2017) observed that a large dose of N around stem elongation was important to producing La Trobe grain within the protein window of 9.5-12.5% for delivery as Malt1. In this study, just looking at the La Trobe data, the average grain protein from 45N applied at 0 WAS was 9.9% (with three sites outside Malt1), 9.9% at 5 WAS (two sites outside Malt1), 11.7% at 10 WAS (two sites outside Malt1) and with split N application was 10.7% (two sites outside Malt1). This supports the recommendations that N applied at or around stem elongation will contribute to maximising grain protein concentration. The same rate but split over several timings is not as effective as a single dose at stem elongation. Additionally, in this study the 45N at 10 WAS in La Trobe gave a similar grain yield to the other N timings at a slightly higher screenings, which is similar to the observations of Paynter (2017). Paynter (2017), however, observed no effect on screenings in seasons with a wetter or more “normal” finish.
Dandaragan was the only site where screenings for most N treatments were below the Malt2 limit of 35%. At this site, N timing did not influence the grain yield response to applied N, with grain yield increasing to 105N. As with the other sites, however, there was a larger increase in screenings and grain protein with 10 WAS N than earlier applied N, and a significant interaction on return. High and late N at this site dropped many varieties into feed either due to high screenings (ie. La Trobe and Scope CL) or high grain protein (Bass, Flinders, Granger and Scope CL), resulting in a drop in return.
To finalise studies on the effects of N rate and N timing on the performance of current “malt” varieties, research undertaken in 2016 looked at N management practices closer to those used by growers (ie. one-third at seeding and two-thirds at mid-tillering or stem elongation). This data will be published at a subsequent update.
References
2017 Barley Variety Sowing Guide for Western Australia (2016) (eds. BH Paynter and GC Trainor). Department of Agriculture and Food Western Australia, Bulletin 4874.
Hills AL and Paynter BH (2008). Managing nitrogen inputs in malting barley. 2008 Agribusiness Crop Updates, Perth WA, 13-14 Feb 2008.
Hills AL, Paynter BH and Malik R (2014). Getting the best from your Bass. 2014 Agribusiness Crop Updates, Perth WA, 24-25 Feb 2014.
Malik R, Paynter BH and Hills R (2014). Commander – a new high yielding, malting barley. 2014 Agribusiness Crop Updates, Perth WA, 24-25 Feb 2014.
Malik R and Paynter BH (2015). Nitrogen rates and timing for new malting barley varieties. 2015 Agribusiness Crop Updates, Perth WA, 24-25 Feb 2015.
Paynter BH (2005). Low protein management in Gairdner and Baudin barley. 12th Australian Barley Technical Symposium, Hobart, Tas, 11-14 Sept 2005.
Paynter BH (2015). Seasonal and genetic differences in the phenology (duration to awn emergence) of barley when sown in late April through to early July. 2015 Agribusiness Crop Updates, Perth WA, 24-25 Feb 2015.
Paynter BH (2017). What influence does nitrogen timing have on La Trobe’s ability to meet malt barley specifications? 2017 GRDC WA Grains Research Update, Perth WA, 27-28 Feb 2017.
Paynter BH, Graham RW, Graham NA, Goss S, Craig S, Malik R, Walters L, Porker K, Hills AL and Menz I (2015). Agronomic assessment of barley varieties in national agronomy trials (variety x nitrogen x seed rate). 17th Australian Barley Technical Symposium, Sydney NSW, 13-16 Sept 2015.
Paynter BH, Graham N, Malik R and Hills AL (2016). National barley agronomy trial series (2012-2014) – Western Australian observations on the interaction between variety, nitrogen and seed rate. 2016 GRDC WA Grains Research Update, Perth WA, 29 Feb and 01 Mar 2016.
Paynter BH, Hills AL, Malik R and McLarty A (2013). Sensitivity of barley varieties to crop management. 2013 Agribusiness Crop Updates, Perth WA, 25-26 Feb 2013.
Paynter BH and van Burgel A (2014). Barley cultivars differ in their protein concentration. 2014 Agribusiness Crop Updates, Perth WA, 24-25 Feb 2014.
VSN International (2013). GenStat for Windows 16th Edition. VSN International, Hemel Hempstead, United Kingdom.
Acknowledgments
Technical support was provided by Sue Cartledge and Rod Bowey and the DAFWA Technical Support Units at Geraldton, Wongan Hills, Merredin, Northam and Katanning. This research was located at the farms of Charles Roberts, Dandaragan; Chris Syme, Cunderdin; Simon Boyle, York; Paul Hicks, Pingrup; and the DAFWA research farm at Wongan Hills. This research is supported by the Department of Agriculture and Food Western Australia with co-funding from the Grains Research and Development Corporation. Rick Graham, NSW DPI and Jeremy Curry, DAFWA provided feedback on a draft of this paper.
GRDC Project Code: DAW00224,
Was this page helpful?
YOUR FEEDBACK