Soil organic matter - maximising biomass is the key
Author: Jayne Gentry, David Lawrence, Rod O’Connor and Brad Taylor, Department of Agriculture and Fisheries, Queensland | Date: 28 Feb 2017
Take home message
Soil organic matter (SOM) is critical for healthy soils and sustainable agricultural production. Growers understand that crops grown in healthy soils perform better and are easier to manage. Levels of SOM are measured by soil testing for soil organic carbon (SOC), as SOM is composed of approximately 60% carbon. Levels of SOC have decreased under cropping systems. As a result this has reduced soil nutrient reserves meaning a greater reliance on fertilisers. Questions are often asked about how SOC levels can be increased. The simple answer is; maximise biomass production via good agronomy.
SOM is critical in the supply of nutrients to plants
Organic matter is fundamental to the physical, chemical and biological functions of the soil. In the northern grain region, SOM’s major role (through its mineralisation) is providing nitrogen and other nutrients in an available form to crops and pastures. To put the value of SOM into perspective, at current fertiliser prices, every 1% of measured SOC is associated with approximately $1500- $2000 worth of nutrients. The other functions (e.g. cation exchange capacity and water holding capacity) will still be influenced with increased SOM but the impact will be largest on sandy soils.
SOM levels have decreased under cropping
Australian soils are generally low in SOM compared to world levels. Initial SOM levels are limited by biomass production (and so climate) for each land type/location. Levels of SOM have declined over the past decades under traditional cropping practices. Changes in SOM and measured SOC levels occur slowly, hence these are difficult to accurately measure in short term experiments. This project sampled and analysed over 1000 paired sites to compare Total Organic Carbon (TOC) during 2012-2015 throughout Queensland and northern New South Wales. Each comparison was taken from two varying land-use patterns with the same soil type on each property. These results confirmed TOC declined dramatically when land is cleared and continuously cropped (Figure 1). This decline affects all soil and land types but is most dramatic for the brigalow/belah soils because their starting SOC levels are amongst the highest in Australia; they have the furthest to drop.
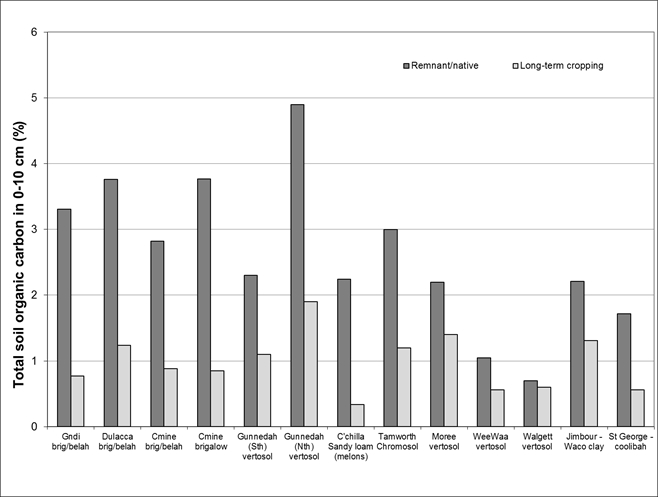
Figure 1. The decline of SOC levels in long-term cropping systems
Current SOM status
Current SOM levels are a result of the historical balance between inputs (e.g. plant residues and other organic inputs) and losses (e.g. erosion, decomposition). The detected decline in cropping systems is largely driven by the length of fallowing and most fallow rain in the northern region (as much as 75-80% in a summer fallow) is lost as runoff or evaporation. This unutilised rain does not grow biomass to replenish the organic matter reserves in the soil. However, increasing stored moisture in the fallow continues to support microbial decomposition of the SOM. This helps accumulate available nitrogen for the next crop, however, SOC levels decrease as a result. The SOM and measured SOC levels will continue to decline until a new equilibrium is reached by which biomass produced in the new farming system can sustain SOM/SOC levels.
Put simply,
‘Crops may make more money than trees and pastures,
but do not return as much biomass to the soil’
Levels of SOC vary within a paddock, from paddock to paddock and from region to region. The paired site results for TOC at 0-10 cm level, also varied enormously across sites. The average was 1.46% however TOC levels ranged from 0.5% to over 5% (Figure 2). Even in their native state (under remnant vegetation) TOC levels varied with soil type and location (Figure 3). For example TOC on a brigalow soil type was higher in a wetter climate like Monto as compared to a drier climate like Roma.
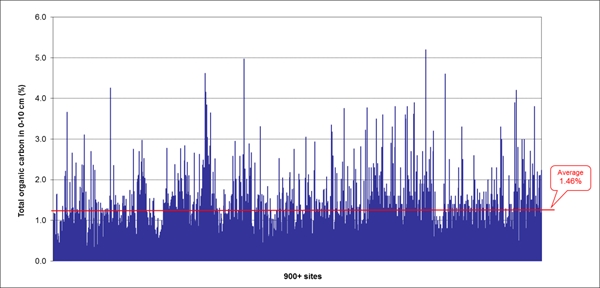
Figure 2. Soil organic carbon levels on mixed farms within the GRDC Northern Region
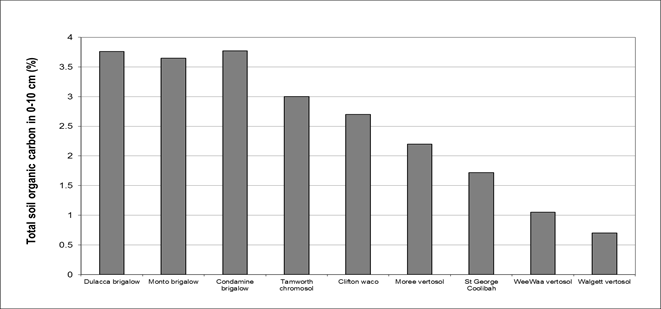
Figure 3. Impact of land-type on total soil carbon levels (0-10cm) under remnant vegetation across northern region
Lower SOM levels = higher reliance on fertilisers
The most important effect of declining SOM levels in the northern grain region is the reduction in the soil’s capacity to mineralise nitrogen. This means an increased reliance on other forms of nutrient supply either from synthetic fertilisers or organic sources. To a lesser extent soil structure and soil moisture retention are also reduced.
Options for reversing the decline in SOM
Soil organic matter is an under-valued capital resource that needs to be managed. Levels of SOM (measured as SOC) are a result of a simple equation:
SOC = inputs – losses
Maximising biomass production (i.e. “inputs”) and minimising “losses” such as erosion and burning/bailing will encourage higher SOC levels. Modern farming practices that maximise water-use-efficiency for extra biomass production are integral in protecting SOM. For example:
- Growing healthier, bigger crops
- Increasing cropping frequency (reducing fallows)
- Adding organic matter e.g. manure/compost
- Reducing tillage, burning and bailing
- Pasture phases
What does current research indicate?
Paired sampling showed that returning cropping country to pasture will increase soil carbon levels (Figure 4). However there were large variations, indicating not all soil types or pastures preform the same. Soil type influences the speed by which carbon levels change, i.e. a sandy soil will lose and store carbon faster than a soil high in clay. As too does the quality and productivity of the pasture; maximising biomass production by ensuring adequate nutrition (especially in terms of nitrogen and phosphorus) will maximise increases in soil carbon over time. The most promising practice to date to rebuild soil carbon stocks in the shortest time frame appears to be the establishment of a highly productive pasture rotation with annual applications of nitrogen fertiliser.
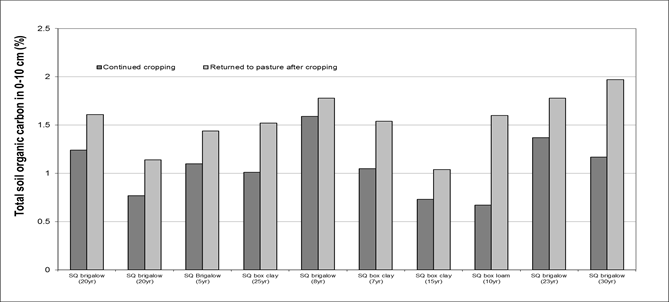
Figure 4. Total organic carbon comparisons for croplands resown to pasture
A trial conducted in Chinchilla, Queensland (2013-2016) on a previously cropped 18 month old Rhodes grass pasture on sandy loam showed the application of 50 and 100 kg N/ha/yr provided 7.8 (~100%) and 14.6 (~200%) tonnes of additional biomass respectively (Figure 5) than the unfertilised pasture. The measured average TOC levels at the beginning of the trial were extremely low (0.22% 0-10cm and 0.12% 10-30cm) reflecting the impact long term cropping has on SOC levels on a light soil. Testing was conducted again at the completion of the trial in August 2016. The mean TOC in the 0-10 layer increased from this very low base by 64% (p=0.000) with four years of pasture growth. However, there was no significant change in 10-30 cm, most likely due to the short term nature of the trial. This change in TOC resulted in significant increases in mean carbon stock (t/ha) to 30 cm across all treatments of 29% (Table 1). The addition of nitrogen fertiliser had a significant increase on both SOC 0-10cm (p=0.000) and carbon stocks to 30cm (p =0.009). There was also an apparent increase in final carbon stocks as the amount of applied nitrogen fertiliser increased (e.g. 100 kg N/ha increased carbon stocks by an average 44% but this was not statistically significant during this short-term trial (Table 2). If real, it is calculated that the 50N treatment had the potential to generate an additional $784/ha of income over the 4 years, or $584/ha ($145/ha/yr) in additional profit, whilst the 100N treatment had the potential for $1460/ha in additional income or $1060/ha ($265/ha/yr) in profit compared to the unfertilised pasture. 1If this pasture could be utilised by cattle this is a win-win situation economically and in terms of improving SOM.
1Calculated using 12:1 Food Conversion Efficiency (FCE), a live weight beef price of $3/kg, and assuming 40% of additional dry matter is consumed it is possible to estimate the economic benefit of these treatments, with urea at $400/t.
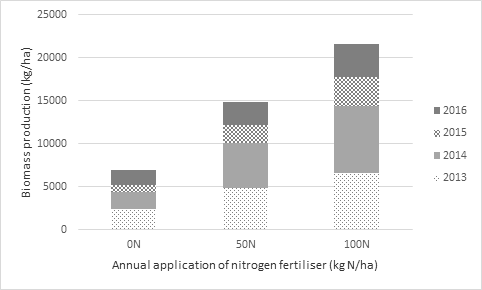
Figure 5. Impact of applying annual applications of nitrogen to grass only pasture – Chinchilla Qld
Note: 2015 season had a dry summer and the 2016 season was cut short due to pig damage
Table 1. TOC and carbon stock in averaged across site (BD (0-10) = 1.31; BD (10-30) = 1.53)
|
Trial average |
Start (2013) |
Finish (2016) |
% change |
P<0.01 |
|
TOC 0-10 cm (%) |
0.22 |
0.36 |
64 |
yes |
|
TOC 10 – 30 cm (%) |
0.12 |
0.14 |
17 |
no |
|
Carbon stock (t/ha) |
6.90 |
8.89 |
29 |
yes |
Table 2. Change in carbon stock (BD (0-10) = 1.31; BD (10-30) = 1.53)
|
Treatment |
Start (2013) |
Finish (2016) |
% change |
|
0 N |
7.46 |
8.89 |
19 |
|
50 N |
7.49 |
9.54 |
27 |
|
100 N |
5.75 |
8.26 |
44 |
These results are consistent with the paired site data indicating that the quality and productivity of a pasture is directly related to the increase in SOC. Data from a similar trial at Brigalow on a brigalow/belah clay soil, is currently being analysed.
The addition of organic matter in the form of manure or compost is another method to boost SOM levels. A trial at Warra, Queensland, investigating the impact applying manure versus equivalent granular fertiliser rates had on SOC levels was conducted from 2013 – 2016. Results showed at commercial rates of manure application (5t every 3 years) there were no difference between treatments in biomass, yield or SOC. However, paired site testing has shown that farming systems that apply large amounts of organic fertilisers regularly under high production systems can increase SOC levels.
Considerations when testing SOC
It is critical to test for SOC correctly to track changes in SOM and ensure meaningful results that can be accurately interpreted. Soil is normally collected in two increments; 0 – 10 cm and 10 – 30 cm. The number of samples collected will be determined by the size of the paddock to ensure accurate representation. Avoid atypical areas including headlands and areas close to tree lines. Do not include crop residues as these are not a part of the SOM system at this point in time. Note: if monitoring for carbon trading there are specific guidelines please visit www.environment.gov.au/climate-change/emissions-reduction-fund for details.
There are various types of analyses available:
- Total Organic Carbon (TOC) - will provide a measure of all the carbon from an organic source. This contrasts with Total Carbon which also measures inorganic CaCO3 on high pH soils and can provide very high carbon test results
- Walkley-Black – used in the past (about 85% of TOC) Caution: be careful when comparing old soil tests to current tests
- Particulate Organic Carbon (POC) – measures the more labile, active carbon fraction which occurs in small particle sizes
- Microbial Biomass Carbon (MBC) – measures the total amount of microbes in the soil
- Fluorescein diacetate hydrolysis (FDA) – measures microbial activity as not all microbes are alive and active
Acknowledgements
The research undertaken as part of this project is made possible by the significant contributions of growers through both trial cooperation and the support of the GRDC; the author would like to thank them for their continued support.
Contact details
Jayne Gentry
DAF
PO Box 102
Toowoomba QLD
Ph: 0428459138
Email: jayne.gentry@daf.qld.gov.au
GRDC Project Code: DAQ00182,
Was this page helpful?
YOUR FEEDBACK