The application of precision phenotyping technologies to a wheat breeding program
Author: James Walter (The University of Adelaide), James Edwards (Australian Grain Technologies) Glenn McDonald (The University of Adelaide) and Haydn Kuchel (The University of Adelaide, Australian Grain Technologies) | Date: 07 Feb 2017
Take home messages
- Application of phenotyping technologies is in its infancy.
- Early use of sensors shows promise for future application.
- Much work is needed in terms of ease of access, ease of use and data management before phenotyping technologies will see widespread uptake.
Background
The adoption of new technologies has historically underpinned improvements in plant breeding. In essence, plant breeders rely on two types of data — 1) genetic, which gives insight as to which genes are present and how plants are expected to react, and 2) phenotypic, which is the physical manifestation of the genetic traits as modulated by environment.
Until recently, the availability of genetic data has been a major bottleneck for plant breeders, however, with the adoption of new technologies (such as molecular markers, next generation sequencing and genomic prediction), genetic data is now readily and cheaply available (Cobb et al. 2013). Because of this, the bottleneck in modern plant breeding programs has shifted to the acquisition of phenotypic data (Cobb et al. 2013).
Due to the large scale of modern breeding programs, collecting phenotypic data other than grain yield for all material within the program has become impractical and unmanageable. Other desirable data, such as basic agronomics and disease susceptibility, are collected for some material within the program, however this is still a time consuming and laborious process.
To speed up the process and overcome this bottleneck, a vast array of sensors has been suggested as potential phenotyping tools. These include (but are not limited to) consumer digital cameras, thermal cameras, multispectral and hyperspectral cameras and LiDAR (laser scanning). Many of these sensors have been tested in controlled environments, with some having been tested in small scale field trials (Deery et al. 2014).
Despite promising results to date, there are still many unknowns as to how these sensors may be applied to plant breeding programs. How easy are these sensors and systems to use? How efficiently do they capture data? How difficult is it to extract and analyse the data? What does the data mean and how can it be used? This last question takes precedence over all others and is the most pertinent to plant breeders. Without a direct use for the data, there is little point collecting it.
This current project aims to investigate the integration of these sensors (primarily consumer digital cameras and LiDAR) within a plant breeding program, from data acquisition through to data application.
Methods
In the early stages of this project, consumer grade digital cameras were used to image plots of wheat in Australian Grain Technologies’ (AGT) breeding trials. These images are being used in collaboration with the University of South Australia Phenomics & Bioinformatics Research Centre (UniSA PBRC) for the creation of algorithms to determine basic agronomic traits such as plant numbers and head numbers, with ground truth data being manually recorded in conjunction with the images.
During the growing season, images were taken of plots expressing physiological yellowing, with visual scores for yellowing also being recorded. These images were processed and analysed with the freely available software Image J, with these digital scores being compared to the visually-obtained scores. This data was analysed with mixed linear models in the freely available statistical software R (R-Core Team 2015).
Alongside this early work, a prototype ground-based phenotyping boom has been developed in collaboration between AGT, UniSA PBRC and Limagrain Netherlands. This phenotyping boom is mounted on a tractor and houses four digital cameras and a LiDAR unit, all of which are triggered via an RTK GPS, capturing data for individual plots within field trials.
This phenotyping boom was used towards the end of the 2016 growing season in trials designed to maximise phenotypic variation (six phenotypically contrasting varieties, with four sowing rates). Digital photos were taken for continued algorithm development and LiDAR scans were captured for height and biomass estimation. Manual plant heights and biomass samples were collected from each plot in the trial. This data is being used, in conjunction with the LiDAR data, in the ongoing development of algorithms for the estimation of plant height and biomass. All data displayed here is from trials grown at Roseworthy, South Australia (SA).
Results and discussion
Digital Imaging
Digital scores for physiological yellowing (percentage leaf area yellow), processed in Image J (Schneider et al. 2012), showed a strong correlation to manually-obtained scores (Figure 1). Heritability (a measure of accuracy used in plant breeding) was 0.48 for manual scores and 0.73 for digital scores, indicating that the digital scores were a more accurate and repeatable measure of physiological yellowing.
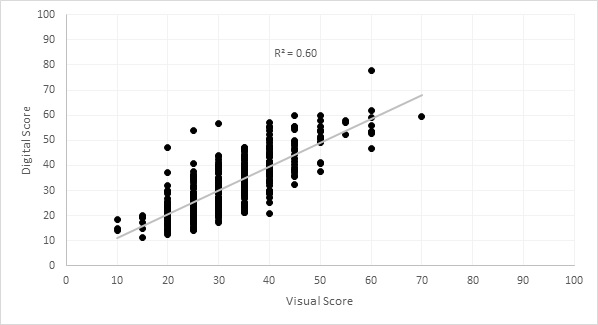
Figure 1. The percentage of leaf area yellow within wheat plots, scored visually and digitally with Image J.
Processing of images to measure physiological yellowing in Image J was a simple process (Figure 2), following similar methods of colour segmentation used by Adamsen et al. (1999), Lukina et al. (1999) and Casadesús et al. (2007).
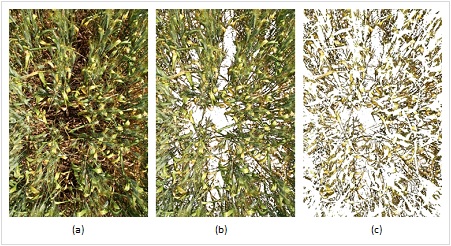
Figure 2. The three levels of Image segmentation using Image J. a) original image (left), b) segmented green and yellow leaf area (middle), and c) segmented yellow leaf area (right).
With Image J being freely available and the relatively simple process required for image analysis, this technique can be readily used by anyone. Potential exists for these methods to be used in the measurement of other traits such as ground cover, early vigour, senescence and perhaps disease. Use of these methods within large scale plant breeding trials will be conducted in 2017.
Algorithm development in collaboration with UniSA PBRC is continuing in 2017.
LiDAR
Data collected from the LiDAR unit can be processed to determine crop canopy height, with this showing a strong correlation to manually-measured canopy heights (Figure 3). LiDAR measurements were consistently lower than manual measurements, with this likely being a result of the way in which the algorithm calculates height from the LiDAR data. Heritability calculated from both the manual and LiDAR measurements showed the same result of 0.99, indicating that LiDAR measurements were on par with manual measurements for accuracy, with the advantage of faster data acquisition.
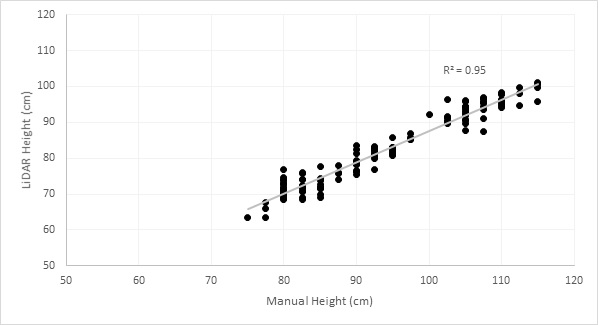
Figure 3. Canopy height of wheat plots as measured manually and with a LiDAR sensor.
The application of this data to statistical analyses within a wheat breeding program is still being investigated, however this data may be useful for breeding other crop species or for agronomic research. LiDAR data is also being investigated for its potential to measure crop biomass, for use in multivariate statistical analyses.
Conclusion
So far during this project, we have collected data from wheat plots using digital cameras and a LiDAR sensor, further extracting information from these relating to potential traits of interest for wheat breeders.
In the case of digital images image capture and data extraction was a relatively simple process, conducted using open source software. These techniques can be used by anyone with a digital camera, simply by photographing plots as you walk along and then post processing the photos in Image J.
LiDAR, on the other hand, is much more difficult to work with. Proprietary software is required to interface with the LiDAR itself, allowing for raw data collection, with this data then needing further processing to make it of any value to researchers. This latter level of processing is achieved with custom coding and scripting (in this case using R) and requires a specialised skill set.
Use of these technologies for agricultural research (in particular LiDAR) is in the very early stages of development, and so it is unsurprising that there are some difficulties applying them to field research. However, as more research is conducted, it is likely that easy to use tools will be developed, allowing a wider audience of researchers to take advantage of these sensors and the data they produce.
This project will continue in 2017 with large scale data capture of digital images and LiDAR data from field trials. Different analysis techniques of this data will be investigated, as well as the different applications this data may have within a wheat breeding program.
Useful resources
Image J
R Statistical Software
User Friendly Interface for R
References
Adamsen, FG, Pinter, PJ, Barnes, EM, LaMorte, RL, Wall, GW, Leavitt, SW, Kimball, BA (1999). Measuring Wheat Senescence with a Digital Camera. Crop Science 39, 719-724.
Casadesús, J, Kaya, Y, Bort, J, Nachit, MM, Araus, JL, Amor, S, Ferrazzano, G, Maalouf, F, Maccaferri, M, Martos, V, Ouabbou, H, Villegas, D (2007). Using vegetation indices derived from conventional digital cameras as selection criteria for wheat breeding in water-limited environments. Annals of Applied Biology 150, 227-236.
Cobb, JN, DeClerck, G, Greenberg, A, Clark, R, McCouch, S (2013). Next-generation phenotyping: requirements and strategies for enhancing our understanding of genotype-phenotype relationships and its relevance to crop improvement. Theoretical and Applied Genetics 126, 867-887.
Deery, D, Jimenez-Berni, J, Jones, H, Sirault, X, Furbank, R (2014). Proximal Remote Sensing Buggies and Potential Applications for Field-Based Phenotyping. Agronomy 4, 349.
Lukina, EV, Stone, ML, Rann, WR (1999). Estimating vegetation coverage in wheat using digital images. Journal of Plant Nutrition 22, 341-350.
R-Core Team (2015). 'The R Project for Statistical Computing.'
Schneider, CA, Rasband, WS, Eliceiri, KW (2012). NIH Image to ImageJ: 25 years of image analysis. Nat Meth 9, 671-675.
Acknowledgements
The authors would like to acknowledge the Grains Research & Development Corporation, the South Australian Grains Industry Trust, the University of Adelaide, School of Agriculture, Food & Wine and the Australian Government Research Training Program Scholarship for their funding support of this project, as well as the University of South Australia Phenomics & Bioinformatics Research Centre and Limagrain Netherlands for their collaboration on the technological aspects of this project.
Contact details
James Walter
Perkins Building, Roseworthy Campus, Roseworthy SA 5371
0421406401
james.walter@adelaide.edu.au
@jdcwalter
Was this page helpful?
YOUR FEEDBACK