Variety specific agronomy package research program
Author: Andrew Erbacher (Department of Agriculture and Fisheries Goondiwindi) and Darren Aisthorpe (Emerald) | Date: 09 Mar 2017
Take home messages
- Targeting planting date and varieties to flower in an optimum window will maximise yield. Heat stress is more likely than frost at flowering on the Western Downs.
- Plant populations greater than 80 plants/m2 established, have maximised yield in these trails. There is no yield penalty for exceeding this population.
- Upfront nitrogen fertiliser application for average yield potential will be most effective in most seasons. In seasons with a wet spring, an in crop application of nitrogen will allow for the additional yield potential of the crop with the added advantage of a small protein benefit.
Background
Cereal grain production is the mainstay of broad acre dryland cropping in QLD and as such been the focus of agronomic research in QLD for many years.
In early 2015, DAF’s newly formed Regional Research Agronomy Network grabbed an opportunity to add value to the extensive Variety Specific Agronomy Package (VSAP) data NSW DPI has been collecting for a number of years. The VSAP research aims to better understand the variety specific characteristics or phenology of new and established varieties, to enable growers are able to make more informed management decisions about what to expect from a specific variety or maturity group given certain planting parameters.
We suggest growers continue to refer to the NVT planting guides and yield results as the benchmark guide for variety recommendations and planting times. However in 2015, the team developed twelve trials across the Queensland wheat growing regions, and repeated in 2016, to evaluate the following questions:
- What affect will altering the time of sowing for 18 different wheat varieties of varying maturities have on phenology and yield ? Do any observed differences remain consistent from region to region?
- Can observed differences be used to optimise planting times?
- What is the impact of varying planting rates in wheat?
- Do different varieties respond differently to varying populations?
- Is there a varietal difference in yield and protein response to Nitrogen application?
To answer these questions, three trials were designed, and replicated across different regions and two seasons. The three trials were a time of sowing (TOS) trial; a population trial; and a nitrogen trial. Each of these trials were located at Emerald, Goondiwindi and Warwick, with additional population trials at Jambin, Meandarra and Brookstead.
Time of sowing
The TOS trial had 18 varieties of varying maturities, planted at a traditional main sowing window for the region, as well as an early and a late time of sowing four weeks either side of this date. The planting dates in 2015 for each of the locations are as follows: Emerald, 15 April, 12 May and 9 June; Goondiwindi, 27 April, 26 May and 8 July; Warwick, 15 May, 12 June and 10 July.
The important factor in maximising yield is the date on which the variety flowered, early flowering had increased risk of frost, while late flowering increased the yield penalty from heat stress. The overall trend across all sites in Qld was that maximising the time for grain fill gave maximum yield potential. This meant that planting early yielded the most, except for the early frost events at Warwick (2015 & 2016) and Goondiwindi (2016).
For the Goondiwindi 2015 trial the earliest variety flowered on 01 August, with an 8% risk of frost. The critical date for yield decline at this Goondiwindi site was 10 September (Figure 1), with varieties flowering after this date suffering heat stress during flowering and grain fill, and yielding less as a result of it. This date happens to coincide with the date that CliMate (www.australianclimate.net.au) suggests the risk of heat stress rapidly increases. These later flowering varieties have also reduced days to flowering relative to their earlier planting date (Table 1). This accelerated development combined with a hot dry finish has also resulted in reduced seed size and increased screenings in the late flowering varieties.
In-crop rainfall is generally more efficiently utilised, therefore crops planted earlier in the sowing window will have access to more plant available water (PAW). In addition to this, if the flowering date runs into the heat stress period, the plants will need to transpire more to cope, resulting reduced water use efficiency (WUE; kg grain/mm PAW). At the Goondiwindi site the accumulated effect of these factors resulted in 40mm less PAW and a 60% reduction in WUE between TOS 1 and TOS 3. This resulted in a two tonne per hectare (50%) reduction in yield.
Table 1. Days to flowering and Grain yields (kg/ha) of the 2015 Goondiwindi Time of Sowing site. Letters indicate significant differences between TOSs within a variety (p = 0.05).
|
TOS 1 (27 April) |
TOS 2 (26 May) |
TOS 3 (08 July) |
|||||||
|
Variety |
Days |
kg/ha |
Days |
kg/ha |
Days |
kg/ha |
|||
|
Average |
114 a |
4055 |
a |
109 b |
3065 |
b |
91 c |
2059 |
b |
|
LongReach Dart |
96 |
4125 |
a |
99 |
3869 |
a |
83 |
2669 |
b |
|
LongReach Spitfire |
102 |
4181 |
a |
105 |
3906 |
a |
91 |
2411 |
b |
|
Sunmate |
107 |
4327 |
a |
106 |
3863 |
a |
87 |
2760 |
b |
|
Elmore CL Plus |
108 |
4564 |
a |
106 |
3340 |
b |
90 |
1669 |
c |
|
LongReach Crusader |
109 |
4064 |
a |
105 |
3431 |
b |
86 |
2074 |
c |
|
Baxter |
110 |
4125 |
a |
108 |
3408 |
ab |
89 |
2245 |
b |
|
Kennedy |
113 |
3891 |
a |
108 |
3053 |
b |
95 |
1737 |
c |
|
Suntop |
114 |
4120 |
a |
107 |
3415 |
ab |
90 |
2580 |
b |
|
LongReach Viking |
114 |
4377 |
a |
110 |
2609 |
b |
91 |
2186 |
b |
|
Sunguard |
115 |
4030 |
a |
109 |
2947 |
b |
91 |
1677 |
c |
|
LongReach Gauntlet |
116 |
4324 |
a |
108 |
3150 |
b |
93 |
1653 |
c |
|
Sunvale |
117 |
3937 |
a |
111 |
3032 |
a |
93 |
1922 |
b |
|
EGA Burke |
117 |
4585 |
a |
110 |
2505 |
b |
92 |
1641 |
b |
|
Mitch |
119 |
4329 |
a |
110 |
3503 |
ab |
89 |
2574 |
b |
|
LongReach Lancer |
120 |
4368 |
a |
111 |
2671 |
b |
95 |
1527 |
c |
|
EGA Gregory |
121 |
3536 |
a |
112 |
2518 |
b |
92 |
2118 |
b |
|
Strzelecki |
124 |
3629 |
a |
116 |
2232 |
b |
92 |
1960 |
b |
|
EGA Eaglehawk |
139 |
2478 |
a |
121 |
1723 |
b |
96 |
1647 |
b |
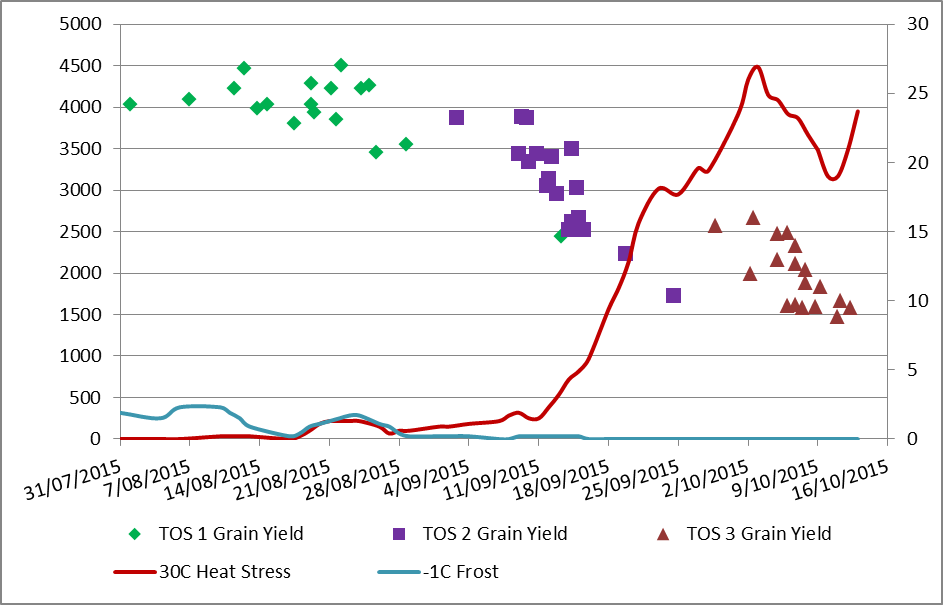
Figure 1. Grain yields of wheat for the date at which 50% anthesis occurred. The lines indicate the probability of Goondiwindi screen temperatures <0C and >30C (www.austalianclimate.net.au).
Table 2. Average grain yield and quality and water use across the three planting dates
|
Time of Sowing (TOS) |
TOS 1 |
TOS 2 |
TOS 3 |
|
Grain Yield (t/ha) |
4.05 a |
3.07 b |
2.0 b |
|
1000 Seed weight (g) |
37.0 a |
27.0 b |
25.6 b |
|
Screenings (%) |
16 a |
41 b |
44 b |
|
Fallow Water (mm) |
102 |
102 |
131 |
|
In-crop Rainfall (mm) |
195 |
165 |
126 |
|
Total PAW (mm) |
297 |
267 |
257 |
|
WUE (kg/mm) |
13.6 |
11.5 |
7.8 |
Population
The population trials had six varieties with four target populations ranging from 30 to 150 plants/m2. This trial was replicated over six sites (Emerald, Jambin, Meandarra, Goondiwindi, Brookstead and Warwick) and repeated over two seasons. The varieties tested in these trials were LongReach Dart, LongReach Lancer, LongReach Spitfire, LongReach Gauntlet, Suntop and EGA Gregory.
The first trend that was consistent across all sites was that increasing population planted reduced the percentage of seeds that established. For example, to double established plants from 30 to 60 plants per square metre required more than double the planting rate.
The other trend that was consistent across all sites was that decreasing populations below 60 plants/m2 has resulted in a decrease in yield. Optimum yields varied between sites, ranging from 60 to 90 plants/m2. Equally as important is that at none of the sites was a yield penalty observed by establishing higher than optimal populations.
Two of the 12 trials demonstrated a difference in yield response between the varieties for changing populations. At these sites the optimum population was still the same for all varieties, but LongReach Dart suffered a greater yield penalty for low populations, whereas Suntop, LongReach Gauntlet and EGA Gregory had the least severe yield reductions at the lowest population.
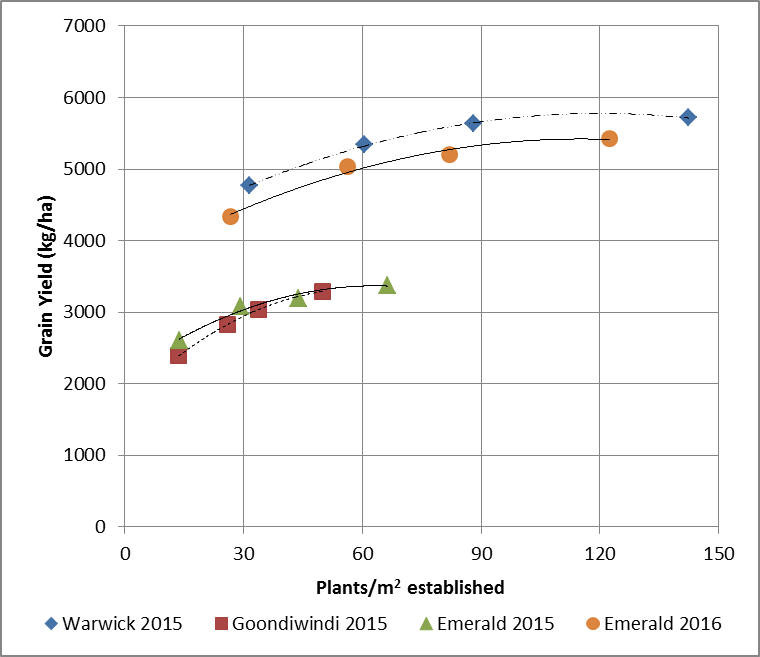
Figure 2. Grain yields for varying populations of wheat at four sites.
Nitrogen fertiliser
The nitrogen trial had five varieties, including known high and low protein producing varieties, with a nitrogen budget completed based on APSIM modelled seasonal yield potentials. A fertiliser rate was then set to meet this demand, as well as lower and higher rates and applied up front and a final treatment where the budget rate was split between an upfront and an in crop application.
The trend across sites was that adding nitrogen fertiliser increased grain yield, however treatments with low rates of nitrogen fertiliser applied (5-15 kg N/ha) often had no benefit and sometimes a slight yield reduction.
Yield and protein changes for increasing nitrogen rates were consistent between varieties; however there were differences between varieties for the average protein across nitrogen rates (Table 3). The varieties LongReach Spitfire and LongReach Lancer consistently achieved higher protein levels, whereas EGA Gregory and Suntop achieved lower proteins, with 1 to 1.5% differences in protein between these high and low protein achieving varieties.
The addition of extra nitrogen beyond the budgeted yield potential has generally not increased grain yield, but has resulted in increased grain protein. In 2015 at Goondiwindi site, there was only one rainfall event after the in crop nitrogen application, so there was no yield benefit achieved from this application and only a small increase in protein.
In contrast the 2016 Goondiwindi site had a cool wet spring after the application of the in crop nitrogen. In this season there was a small yield and protein benefit for the split application over the equivalent rate of nitrogen applied up front. This 2016 site exceeded estimated yield potential by 2 t/ha, as such the 150% of yield potential nitrogen rate was the highest yielding treatment. Despite the high yields achieved, none of the treatments achieved yield limiting proteins (<12%). This is because the crop was able to tap into a bulge of nitrogen below 90cm (126 kg N/ha for 90 to 150cm).
As previously suggested, the application of low rates of nitrogen fertiliser has resulted in lower fertiliser use efficiency than the other rates of upfront fertiliser. At 2016 Goondiwindi site the small yield benefit from splitting nitrogen between upfront and in crop, has resulted in a 10% increase in fertiliser use efficiency (Table 3).
Table 3: Crop data for the 2016 Goondiwindi trial. Values with similar letters are not significantly different.
* p=0.05; *** p=0.001
|
Yield (kg/ha) |
Grain protein (%) |
Fertiliser Use Efficiency |
|||
|
N Rates (R) |
*** |
|
* |
|
|
|
Nil & 50% (0) |
5142 |
c |
13.0 |
b |
|
|
75% (13 kg N/ha) |
5121 |
c |
13.3 |
b |
12% |
|
100% (46 kg N/ha) |
5524 |
b |
13.2 |
b |
22% |
|
150% (112 kg N/ha) |
5780 |
a |
14.0 |
a |
22% |
|
100% Split (23+23 kg N/ha) |
5607 |
ab |
13.5 |
ab |
32% |
|
Variety (V) |
*** |
|
*** |
|
|
|
LongReach Spitfire |
5009 |
d |
14.2 |
a |
|
|
EGA Gregory |
5484 |
b |
12.9 |
c |
|
|
Suntop |
5702 |
a |
12.6 |
d |
|
|
LongReach Lancer |
5557 |
b |
13.6 |
b |
|
|
LongReach Gauntlet |
5178 |
c |
13.4 |
b |
|
Acknowledgements
We would like to thank the growers for their cooperation with the on farm trials in this program. These trials are co-funded by GRDC, NSWDPI and DAF.
Contact details
Andrew Erbacher
22-26 Lagoon St, LMB 2, Goondiwindi Qld 4390
Department of Agriculture and Fisheries
Ph: 07 4671 6711
Mb: 0475 814 432
Email: andrew.erbacher@qld.gov.au
Darren Aisthorpe
99 Hospital Road, Emerald QLD 4720
Department of Agriculture and Fisheries
Ph: 07 4991 0808
Mb: 0427 015 600
Email: Darren.Aisthorpe@daff.qld.gov.au
Varieties displaying this symbol beside them are protected under the Plant Breeders Rights Act 1994.
GRDC Project Code: DAN00167,
Was this page helpful?
YOUR FEEDBACK