Improving harvest management decisions in canola – implications of seed colour change and windrow timing on yield and seed quality
Author: Rick Graham1, Leigh Jenkins2, Kathi Hertel3, Rohan Brill4, Don McCaffery5 and Neroli Graham1 | Date: 27 Jun 2017
1NSW DPI, Tamworth; 2NSW DPI, Trangie; 3NSW DPI, Narrabri; 4NSW DPI, Wagga Wagga; 5NSW DPI, Orange
Take home messages
- Seed colour change (SCC) in canola occurs later on branches compared to primary stems.
- Research examining the partitioning of yield between the primary stem and branches demonstrated that branches contribute more than 60% of total yield.
- Windrowing at the commencement of SCC; before 40% SCC on the primary stem; was shown to reduce yield by up to 55% and oil concentration by 7.7% units.
- Results demonstrated significant yield and quality penalties associated with early windrow timing at the commencement of SCC and before 40% to 60% SCC on the primary stem, with potential for increases in yield and seed oil concentration, at the upper end of current industry guidelines (approximately 60% SCC) for windrowing canola crops.
- Relying solely on SCC from the primary stem for windrowing decisions could result in seed development being underestimated with potential negative impacts on seed size, oil concentration and yield potential.
- This study indicates that SCC should ideally be measured on a whole plant basis and not based solely on assessment from the primary stem.
Background
Windrowing is a widely adopted harvest management practice of canola (Brassica napus L.) production in Australia. Current Australian industry guidelines based on research conducted in the 1970’s and 1980’s, and supported by Hocking and Mason (1993), recommend that canola is ready to windrow when 40% to60% of seeds on the main (primary) stem change colour from green to red, brown or black. Over the past decade however, with the adoption of hybrid canola varieties and changes in farming practices, including lower plant populations and perceived changes to plant architecture, there has been increased discussion about how best to determine seed colour change (SCC; Street, 2014). Whilst there have been requests for further research into windrow timing (WT), particularly in central and northern NSW (Hertel, 2013). The main concerns relate to the proportion of yield contained on the branches (secondary racemes) versus the primary or main stem (primary racemes) and the effect of the differential rate of seed maturity on yield and seed quality parameters.
In 2015 research commenced as a component of the ‘Optimised Canola Profitability’ project (CSP00187; GRDC co-investment with NSW DPI), to examine the relationship between SCC, seed yield and quality parameters, with the aim of assisting growers to make more informed decisions about canola harvest management in northern NSW, and potentially across Australia. This paper outlines preliminary findings from SCC experiments carried out in 2015 and discusses in detail results from a more comprehensive set of experiments conducted in 2016.
Research in 2015
Initial experiments investigating the relationship between SCC and windrow timing (WT) on yield and seed quality parameters were conducted at Tamworth in northern NSW and Trangie in central western NSW. Treatment timings were targeted at 25%, 50%, 75% and 100% SCC. For consistency between experiments, across sites, SCC was defined as when ‘a minimum of two-thirds of the surface area of an individual seed changed colour from green to brown, red or black’. SCC is regarded as the main determinant of WT, whilst there is also need for a clear definition of what constitutes SCC, to enable the development of robust guidelines around WT. This is important, as the view within the canola industry as to when the optimum time to windrow a crop is based on SCC, and those views vary considerably (Hertel, 2012)
Results
Trangie 2015
The Trangie experiment examined the partitioning of seed from pods on the main stem and branches of two hybrid canola varieties Pioneer® 44Y89 (CL) and Hyola® 575CL, over four windrow timings. In this experiment SCC occurred later on branches compared to the primary stem (Table 1). When looking at yield for Hyola® 575CL in response to WT at Trangie, it was observed that at the early WT 1 (average 32% SCC) there was a 0.71 t/ha or 23% decline in yield compared to WT 3 (average 67% SCC) (Table 1). There was also a small but significant decrease in oil concentration of 2.3% points (data not shown).
Variety | Component | 25% SCC | 50% SCC | 75% SCC | 100% SCC |
|---|---|---|---|---|---|
44Y89 (CL) | Primary stem | 65 | 96 | 100 | 100 |
Branch | 44 | 86 | 93 | 99 | |
Average | 55 | 91 | 97 | 100 | |
Hyola® 575CL | Primary stem | 39 | 84 | 98 | 100 |
Branch | 24 | 50 | 58 | 96 | |
Average | 32 | 67 | 78 | 98 |
When assessing the breakdown of yield components; primary stem vs. branches; results showed that branches contributed around 70% of total seed yield averaged across WT’s, variety and target plant densities. There were also varietal differences and variations due to plant density, with the branch component of yield increasing at the lower target plant density of 15 plants/m2 (Figure 1).
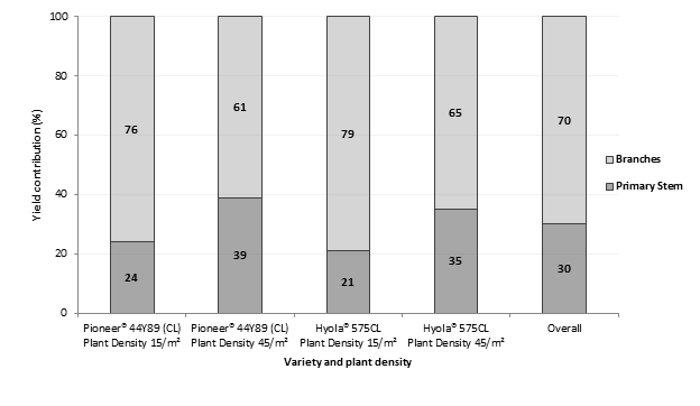
Figure 1. Mean yield contribution (%) of primary stem vs. branches for two target plant densities (15 plants/m2 and45 plants/m2) at Trangie in 2015.
An important observation from this experiment was how rapidly SCC occurred, Hyola® 575CL for example, went from 32% SCC to 78% SCC in six days. Another significant observation was the differential rate of seed maturity between the two varieties, although both reached 50% flowering at the same time. Pioneer® 44Y89 (CL) was more advanced and progressed more rapidly than Hyola® 575CL at any targeted WT.
Tamworth 2015
In a parallel set of experiments at Tamworth, similar results were observed. When assessing the breakdown of primary stem vs. branch yield components for example, it was shown that branches contributed 70% and 73% of total seed yield for Hyola® 575CL and Pioneer® 44Y89 (CL) respectively, averaged across WT’s. Unlike Trangie however, where SCC for WT 1 was relatively advanced, SCC at Tamworth was only 8% and 13% SCC respectively for Hyola® 575CL and Pioneer® 44Y89 (CL). As a result, yield and oil concentration penalties for early WTs were more pronounced. Pioneer® 44Y89 (CL) for example experienced a 1.01 t/ha or 30% yield penalty from WT 1 (13% SCC) vs WT 2 (82% SCC). The oil concentration in Hyola® 575CL was reduced by 7.7% units; 36.4% in WT 1 (8% SCC) compared to 44.2% (62% SCC) in WT 3 (Figure 2). These results highlight the need to accurately determine SCC and hence WT, as there is a 1.5% premium or deduction paid for each 1% units above or below 42% oil content in canola.
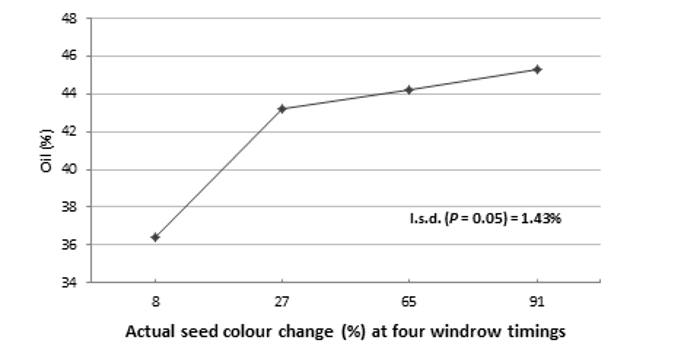
Figure 2. Seed oil concentration (%) and SCC of Hyola® 575CL at four windrow timings at Tamworth in 2015.
Summary of findings - 2015
Overall, these preliminary findings highlighted the importance of correct WT and the need to accurately determine SCC. Windrowing earlier than the current recommendation (i.e. <40% SCC), resulted in significant reductions in yield and oil concentration at both Tamworth and Trangie in 2015. Seed from the primary stem contributed only around 30% of the total yield. Results from Trangie showed that SCC occurred later on the branches compared to the primary stems meaning that if a grower was to rely solely on the primary stem to estimate SCC, overall seed development is being underestimated and likely to impact negatively on yield and quality parameters.
Research in 2016
In 2016, a series of experiments were conducted to further investigate the effect of SCC and WT on canola seed size, yield and seed quality parameters. Replicated field experiments were conducted at sites located at ‘Tarlee’ near Edgeroi on the north west plains of NSW, Tamworth Agricultural Institute in north west NSW and Trangie Agricultural Research Centre in the central west of NSW.
Experiments were sown on 6 May at Tamworth and Trangie, and 10 May at Edgeroi, and were managed using best management practices to limit biotic stresses and nutritional constraints. The same two hybrid canola varieties as used in 2015; Pioneer® 44Y89 (CL) and Hyola® 575CL; with similar flowering times but different maturity ratings, were sown in experiments conducted at Tamworth and Trangie, however only one variety Pioneer® 44Y87 (CL) was sown at Edgeroi. WTs were conducted at 2─3 day intervals (i.e. Monday, Wednesday and Friday) from the start of SCC on the primary stem up until 100% SCC on branches, alleviating difficulties associated with trying to achieve target SCC and hence windrow timings, as was experienced in the 2015 experiments.
Yield and seed quality components were determined by threshing 3 x 1 m hand-cuts taken from the three middle rows at either end of experimental plots, giving 6 m of total cut area. Six plants sampled from the middle rows, three from each end of a plot, were threshed to determine the proportion of yield from branches and the primary stem, with seed moisture percentage and thousand seed weight (TSW) at actual SCC and SCC for contribution to yield (primary stem vs. branches) was recorded. Seed quality parameters measured included oil concentration (adjusted to 6% moisture), determined by near-infrared spectroscopy (NIR) with an Infratec® 1241 Grain Analyser.
The following results focus on overall effects of WT and SCC on canola yield and oil concentration, rather than on varietal differences.
Results
Seed colour change (SCC)
SCC and WT treatments commenced on 4 October at Edgeroi, 7 October at Trangie and 14 October at Tamworth. Consistent with the 2015 Trangie findings, SCC occurred earlier on the primary stem compared to the branches. WT averaged across the two varieties at Tamworth showed that when SCC on the stem was at 61%, branches were only at 20% SCC (Windrow Timing 7, Figure 3). Similarly at Edgeroi and Trangie where SCC occurred earlier than Tamworth, the primary stem was more advanced compared to branches at key WTs. At Trangie for instance, when the primary stem was at 84% SCC (Windrow Timing 7), branches were only at 43% SCC, likewise at Edgeroi when the primary stem was at 80% SCC, branches were at 52% SCC (data not shown). The results from Tamworth also illustrated how rapidly SCC can occur, with SCC on the primary stem progressing in a five day period from 18% to 61% SCC (windrow timing 5 to timing 7) (Figure 3).
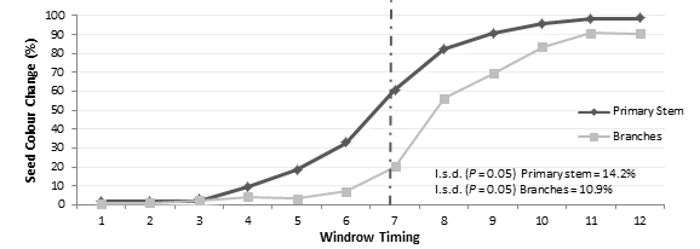
Figure 3. Seed colour change (%) primary stem vs. branches over time as determined by windrow timings at Tamworth in 2016. (Vertical line approximates 60% SCC on the primary stem ~ WT 7).
Seed size
Changes in seed size (TSW) across WT can be used as an indicator of both reaching physiological maturity and yield potential over time. At Tamworth (Figure 4a) and Trangie (Figure 4b) differences in TSW on the primary stem vs. branches was greatest during the earlier WTs, reflecting differences in SCC and maturity. This would be expected given that canola seeds mature progressively up the primary stem and from the lower branches to the upper branches, with changes in seed colour indicative of declining metabolic activity and increasing seed maturity (Hertel, 2012).
Importantly, the optimum TSW for branches occurred at a later WT than current industry recommendations which are based solely on SCC on the primary stem. This is of relevance given that branches contributed 63% and 78% of potential yield at Trangie and Tamworth respectively. A similar pattern of TSW development on branches vs. the primary stem was also observed at Edgeroi (data not shown).
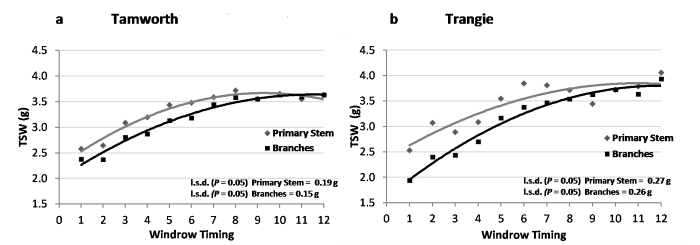
Figure 4. Changes in seed size (TSW) on primary stem vs. branches over time as determined by windrow timing for Tamworth (a) and Trangie (b) in 2016.
Yield
Windrowing at the start of SCC at Trangie (WT 1 SCC ~6% on primary stem) resulted in a 1.34 t/ha decline in yield compared to windrowing at60% SCC on the primary stem (~WT 6), a yield loss of 48% (Figure 5). When looking at the breakdown of yield contribution of the primary stem vs. branches, it was observed that stems only contributed 37% of the total yield at Trangie, averaged across WTs (data not shown). At Edgeroi, yield based on 40─60% SCC on the primary stem ranged from 1.70 to 2.35 t/ha, with yield peaking at 2.42 t/ha (SCC primary stem 89%, branches 65%). The yield penalty at Edgeroi for windrowing at the start of SCC (approximately 6% SCC on primary stem) vs. industry guidelines (40% to 60% SCC primary stem) was 0.6─1.3 t/ha, a potential yield loss of 55% (data not shown). At Tamworth, the penalty for early windrowing at the start of SCC versus industry recommendations was 1.20 t/ha, a potential yield loss of 32% (data not shown). In all three experiments delaying WT to where SCC on the primary stem was >60% either resulted in significant (P<0.001) increases in yield at Edgeroi and Trangie, or trended towards a yield increase at Tamworth.
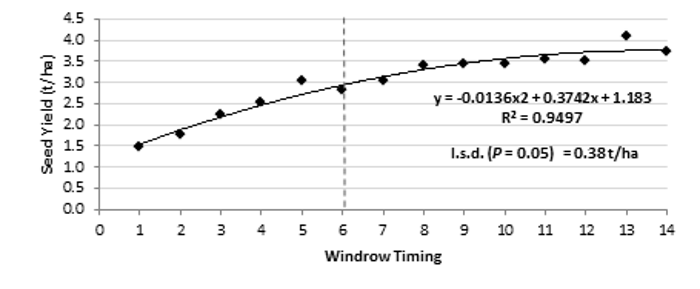
Figure 5. Effect of windrow timing/seed colour change on seed yield (t/ha) at Trangie in 2016. (Vertical line approximates 60% SCC on the primary stem ~ WT 6).
Oil concentration
There were significant (P< 0.001) oil concentration penalties for windrowing at early stages of SCC. At Tamworth, there was a 14% decline or a 6.5% unit reduction in oil concentration (38.9% vs. 45.4%) when windrowing at the start of SCC versus at ~40% SCC on the primary stem (Figure 6). There was also an increase in oil concentration at Tamworth where SCC was >60% on the primary stem, with increases in oil concentration of 0.6─2.0% units. At Edgeroi there was a significant (P = 0.001) decrease in oil concentration with early versus >40% SCC on the primary stem, with oil concentration declining by 3.9% units (Figure 7). Similarly at Trangie, there was a significant (P<0.001) decline in oil concentration of 4%units (early versus >40% SCC), whilst there was an increase of 1.1─1.9% units in oil concentration, with delayed WTs of >60% SCC (data not shown).
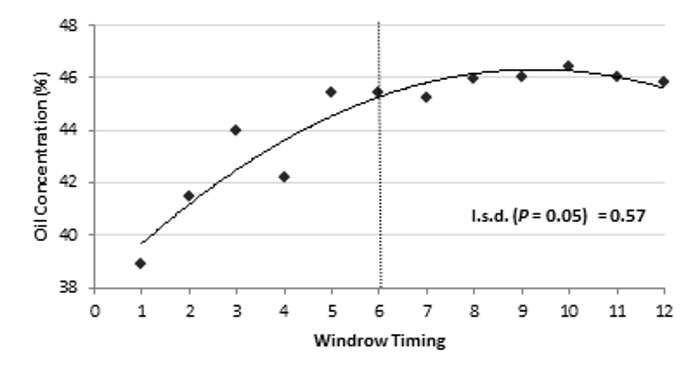
Figure 6. Effect of windrow timing (SCC) on oil concentration (%) at Tamworth in 2016 (Vertical line approximates 40% SCC on the primary stem - WT 6).
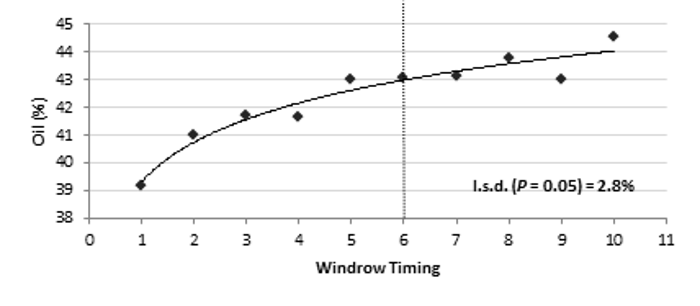
Figure 7. Effect of windrow timing (SCC) on oil concentration (%) at Edgeroi in 2016 (Vertical line approximates ~40% SCC on the primary stem - WT 6).
Summary
Results from these experiments highlight the importance of correct WT and the need to accurately determine SCC. Importantly, it was observed from the partitioning of seed from the primary stem and branches that SCC occurred later on branches compared to the primary stem. This is highly relevant when you consider the breakdown of the yield contribution of the primary stem vs. branches, where stems contributed only 22% to 37% of the total yield averaged across WTs at Tamworth and Trangie in 2016. These findings show that by relying solely on SCC from the primary stem for windrowing decisions overall seed development can be underestimated with potential negative impacts on seed size, oil concentration and yield.
Results clearly demonstrate the substantial yield and oil concentration penalties associated with early windrow timings at the start of SCC and before 40% to 60% SCC on the primary stem. Potential yield and oil concentration benefits are obtained from delayed WTs at the upper end of current industry guidelines (> 60% SCC). Given the significance of the proportion of yield contributed by the branches as opposed to the primary stem there appears to be a need to reconsider the method of how SCC is determined. This study using hybrids indicates that SCC should ideally be measured on a whole plant basis and not based solely on the primary stem. Research in 2017 has included an open-pollinated (OP) variety into experiments to investigate if there are any differences between hybrids and OP varieties. In order to develop robust industry guidelines around WT based on SCC, there is also a need for clear definitions as to what actually constitutes SCC.
Acknowledgements
This project is a component of the collaborative ‘Optimised Canola Profitability’ project (CSP00187) between GRDC, NSW DPI and CSIRO in partnership with SARDI, CSU, MSF and BCG. We gratefully acknowledge the assistance of NSW DPI technical staff with this work including Rod Bambach, Stephen Morphett, Jan Hosking, Jim Perfrement, Michael Dal Santo (Tamworth); Jayne Jenkins, Scott Richards, Liz Jenkins, Joanna Wallace (Trangie); Leah Rood-England, Mitch Whitten, Joe Morphew, and Brooke McAlister (Narrabri). The research undertaken as part of this project is made possible by the significant contributions of growers through both trial cooperation and the support of the GRDC. The authors would like to thank them for their continued support and in particular Peter White and Alex Murray, ‘Tarlee’, Edgeroi.
References
Hertel K (2012) Better canola technology update, Module 7: Harvest management
Hertel K (2013) Canola: the economics and physiology of the timing of windrowing
Hocking PJ, Mason L (1993) Accumulation, distribution and redistribution of dry matter and mineral nutrients in fruits of canola (oilseed rape), and effects of nitrogen fertilizer and windrowing. Aust. J. Agric. Res. 44, 1377-88
Street M (2014) To windrow or not to windrow in 2014? This is the question, but if so, when?
Contact details
Rick Graham
NSW Department Primary Industries
Ph: 0428 264 971
Fx: 02 6763 1222
Email: rick.graham@dpi.nsw.gov.au
Reviewed by
Dr Steven Simpfendorfer, NSW Department of Primary Industries
Loretta Serafin, NSW Department of Primary Industries
® Registered trademark
GRDC Project Code: CSP00187,
Was this page helpful?
YOUR FEEDBACK
