On-the-go protein sensors: Using real-time protein data for more profitable marketing aggregations and nitrogen decisions
Author: Phillip Clancy | Date: 27 Jul 2017
Next Instruments
Take home messages
Protein mapping provides an additional layer of information that complements yield mapping. It enables growers to better identify and diagnose the possible cause(s) of lost revenue in their paddocks due to sub optimal yield and protein premium payments.
Introduction
Precision Agriculture or Precision Farming has provided significant improvements in productivity and profitability in farming. Auto steering and controlled traffic applications can be shown to have relatively quick returns for the investment. However, yield mapping has not been able to deliver the same return and as such variable rate fertilization applications have not really provided the expected benefits to growers. While yield mapping relates nitrogen availability and uptake, but is it only provides only half the story. Real-time protein mapping provides the rest of the story and when yield and protein are combined, the farmer has the tools to determine where and by how much their crops are under performing. This paper introduces an Australian developed technology, an on the go protein sensor, that provides real-time protein mapping as grains are stripped in the paddock. The paper provides several examples of where growers have been able to use this new layer of data to increase their yield and profitability.
Description
The CropScan 3000H On Combine Analyser has been developed by Next Instruments, an Australian company that specialises in Near Infrared analysers for farmers. The CropScan 3000H consists of three components; Remote Sampling Head, NIR Spectrometer and Touch Screen PC, see Figure 1.

Figure 1. Three components: Remote Sampling, Head, NIR Spectrometer, Touch Screen PC
Figure 2 shows a schematic of how the system is configured and connected on the combine harvester.

Figure 2. Schematic of the CropScan 3000H setup on a combine harvester
As grain travels up the clean grain elevator, seeds drop into the remote sampling head mounted to the side of the elevator. The grains are held by a flap at the bottom of the head. NIR light passes through the grains and collected by a fibre optic cable that transmits the light back to the NIR spectrometer located in the cabin. The NIR spectrometer generates the NIR spectrum and sends it to the Touch Screen PC where the calibrations models are applied for protein, moisture and oil. The results are displayed on the PC screen in the form of tabular data and real-time field maps. Figures 3 and 4 show examples of the screen displays. As the combine’s bin fills with grain the bin averages are displayed so that the combine operator can decide to segregate the grain into separate field bin, or the selectively strip different parts of the paddock to optimise the protein grade for the bin load.

Figure 3. Screen display of protein and moisture in wheat

Figure 4. Real-time Protein map
When the out loading auger is extended from the combine, a window pops up on the screen to allow the operator to record the tonnage for the bin load, the bin averages for protein, oil and moisture, and the storage location or the truck where the grain will be placed, Figure 5 shows the pop up window used by the operator to record each bin load. When completed, the data is posted to the Cloud where it can be accessed by a Smart Phone, Tablet or PC.

Figure 5. Bin load record window
Making better decisions
There are two applications for an on-the -go protein sensor, ie, CropScan 3000H:
Tactical:
- In paddock blending of grain to maximize protein grade payments.
- In paddock segregation and storage to maximize protein grade payments.
- On farm segregation and storage into on farm silos.
Strategic:
- Protein/Nitrogen/Yield Optimization to find the “Sweet Spot”.
- Reduction in Nitrogen Fertilizer or better use of Nitrogen Fertilizer.
Case Study 1: Tactical 1 - In Paddock Blending
Mark and Jordan Hoskinson farm 8000 hectares at Kikora, NSW. They installed a CropScan 3000H into their John Deere combine in 2014. In one large wheat field, Jordan quickly realised that there was a 4% to 5% variation in protein across the field. He started to strip grain from one section of the field where the protein content was up to 15%. As the bin filled he would monitor the bin average for protein as displayed on the PC. He would monitor the tonnage in the bin and when it reached 5 tonne, he then stripped grain from another section where the protein was 9-11%, thereby blending the grain based on protein. He would monitor the bin average for the protein as he filled the bin with the lower protein wheat. When the average reached 13.5%, he would go to the field bin and out load the grain. He stripped this field over several days and reported that they trucked every load to the GrainCorp silos at Kikora and had every load accepted as APH1 grade (minimum 13.5% protein). At that time APH1 was paying $30 per tonne more than APW grade. The Hoskinson’s reflected that in previous years this field had produced a mixture of low and high protein grades. Overall, the ability to blend in the fields across their farm had generated an estimated $40,000 in higher payments as compared to previous years. Figure 6 shows the Protein Map for the field mentioned above.

Figure 6. Protein map for wheat
Case Study 2: Tactical 2 - In Paddock Segregation
Figure 7 shows a protein map of a field on the Eyre Peninsula, SA. Mr Wilmont used the used 2 x 55 tonne field bins to segregate wheat into the field bins based on protein being above or below 11.5%, ie, ASW and APW grades. He reported that he was able to blend from the two field bins into trucks so that all loads delivered to the Kimba silos went APW or higher grade. The table below shows a calculation of the additional revenues he made by segregating grain based on protein.

Figure 7. Protein map for a wheat field in Kimba, SA
| Zones | Hectares x yield (t/ha) | Tonnes of grain | Price ($) | No blending ($) | In field blending ($) |
|---|---|---|---|---|---|
| ASW | 89 x 4 | 356 | 159 | 56,604 | |
| APW | 211 x 3.6 | 760 | 171 | 129,892 | 235,392 |
| H2 | 223 x 3.2 | 714 | 186 | 132,730 | 132,730 |
| Total | 319,225 | 368,121 | |||
| Additional profit | 48,896 |
Case Study 3: Tactical 3 - On Farm Segregation and Storage
Luke Follett, Pindara, Euston, NSW grows approximately 6000 tonne of wheat, barley and lentils. He operates 2 CASE 8130 combines and he installed a CropScan 3000H onto one of his combines in 2014. Luke has 6 x 1000 tonne silos on farm where he segregates his wheat into ASW, APW, AHI and AH2 grades. Luke uses the local AgFarm agent to market his wheat to domestic users. The CropScan 3000H software calculates the bin average for protein for each bin load and then posts the bin average to the internet in real-time. The combine operator uses the bin average data to segregate the loads into specific field bins based on grade. Trucks are filled from the field bins and taken back to the farm’s silo complex. The protein, moisture and weight of every truck load that is stored into each silo is received from the internet and stored in the farm’s PC.
Fabian Devereaux, AgFarm, has access to Luke’s data by signing into the CropNet web site. He can see what is stored in each silo as shown in figure 8 and 9. Fabian can then market the grain in each silo based on the running average with confidence that the protein will meet the buyer’s requirements.

Figures 8 and 9. Plots of protein and moisture of wheat stored in silos 2 and 5
Luke advised that AgFarm were able to secure an additional $5 per tonne for 1000 tonne of wheat from the buyer in guarantee that the average was >12% protein. He also commented that all truck deliveries passed inspection by the buyer. Since Euston is over 400km from Melbourne, rejected truck loads have in previous years cost him thousands of dollars in penalties and/or returned loads.
Strategic 1 - Protein/Nitrogen/Yield Optimization to find the “Sweet Spot”
Figure 10 shows the plot of yield Vs nitrogen applied (kg/ha) and the protein%.
The optimum protein level for growing wheat or barley is between 11% and 12%. At this protein level, the yield should be approximately 4tonne per hectare if there is sufficient nitrogen and moisture in the soil and there are no micro nutrient deficiencies. The objective should be to achieve the highest yield at the highest protein premium. Nitrogen needs to be available at both the tillering stageand the reproductive stage in order to achieve optimum yield at the correct protein level, ie, the “Sweet Spot”.

Figure 10. Protein/Nitrogen/Yield Optimization Plot
There are four scenarios that relate Yield and Protein.
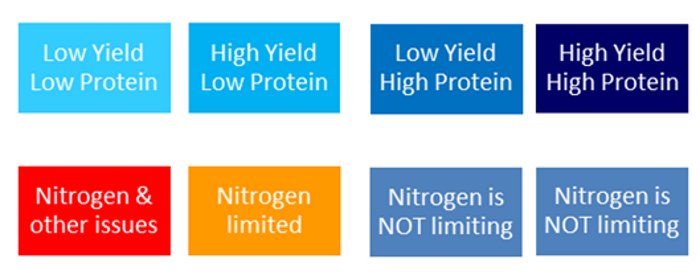
- Low yield and low protein indicate that Nitrogen is the limiting factor.
- High yield and low protein indicates that there was sufficient Nitrogen at the time of planting but insufficient Nitrogen to fully develop the plant.
- Low yield and high protein indicates insufficient Nitrogen in the soil at the emergence and tillering stages. High protein shows that there was Nitrogen available at the flowering and grain filling stages but that the tiller count was low and therefore yield could not be recovered.
- High yield and high protein indicates that the plant has reached its’ full potential and reached the “Sweet Spot”.
Case Study 4: How to use a Protein Maps for better Nitrogen management
Michael Ayres, Injecta, SA, points out “The yield map correlates directly to soil performance and the protein map is a very good proxy for plant performance. The nitrogen data is what makes everything else fit together, ie, productivity and performance. “
Figures 11 and 12 show the protein and yield maps for a property in Manangatang, Victoria. The maps show a typical inverse relationship between yield and protein, ie, following the ‘dilution theory’. On the left hand side of the field, the yield is low and the protein is high. On the right hand side, the yield is high and the protein is low. If only the yield data was looked at, then the data suggests the left hand side was Nitrogen deficient, however the high protein data shows that there must have been Nitrogen available in the flowering and grain filling stages. The yeld map does not provide the complete story. The protein map shows that the problem with yield was that there was insufficient Nitrogen available in the emergence and tillering stages but there was enough Nitrogen for the growth stages. On the right hand side the yield is higher than the left hand side. However the Protein map shows that on the right hand side the average protein level was less than 10% or ASW grade. If more Nitrogen had been applied on the right hand side and the protein level had been increased to above 10.5%, i.e. APW grade, then the farmer could have realised an extra $15-20 per tonne or approximately $5900 to $7880. If the yield was also increased across the paddock by .5t/ha then another $2880 in revenues could have been achieved. The message is that this farmer was leaving approximately $10,000 in the paddock because he did not achieve the optimum yield and protein grades across the paddock.
Farmer: Leeton Ryan
Location: Manangatang, VIC
Field: Ellertons Paddock
Size: 315ha
Yield Av: 2.5t/ha
Protein Av: 10.2% ASW Grade

Figure 11. Protein Map for Wheat & Figure 12. Yield Map for Wheat
Conclusion
Farming is about converting water into grain. When there is sufficient water available, then the farmer’s task is to optimize the yield and to get the best price for the grain. By combining yield and protein maps, farmers can more completely understand the variations that occur across the paddock. Farmers are then able to use variable rate fertilisation applications to achieve the optimum yield across fields, and real-time protein data can help to determine where in the field Nitrogen should be applied and at what rate.
Contact details
Phillip Clancy
Next Instruments
Ph: 02 9771 5444
Email: phil.clancy@nextinstruments.net
Was this page helpful?
YOUR FEEDBACK