Analysis of risks and returns for different crop sequences. Climate and financial risks associated with rotations of differing types and intensities
Author: Jeremy Whish (CSIRO Agriculture and Food, Queensland), Lindsay Bell (CSIRO Agriculture and Food, Queensland), Andrew Zull (Department of Agriculture and Fisheries (DAF), Queensland) and Peter DeVoil (QAAFI, University of Queensland) | Date: 28 Feb 2018
Take home messages
- Intensifying a crop rotation beyond the environmental capability of the site can increase downside risk for minimal economic benefit.
- If your risk of a failed crop moved from 1 crop in 10 to 1 crop in 5, would an annual average increase of $100/ha be worth it? Everyone’s risk profile is different so the decision to intensify is personal.
- All environments will provide opportunities to intensify, identifying when and how often these occur is the dilemma.
- Structuring a crop sequence to ensure the highest value crops receive the best opportunity for success can significantly improve sequence productivity.
Introduction
This paper reports on some of the work conducted as part of GRDC’s Northern Farming Systems project. One of the goals of this project is to use both experimental research and simulation modelling to understand the benefits and trade-offs associated with different crop rotations across the northern grains region. For this paper we will use the term rotation to mean a sequence of crops and fallows that regularly follow each other in a cyclic pattern. We are aware that not all grain growers follow a structured fixed rotation and we are not advocating this approach. However, by examining rotations in this structured way, key features (benefits and costs) of the sequence can be observed. This paper reports the first step in our process, future work will look at more opportunistic and pure rule based crop selection sequences.
The components of a grain rotation include the crops and the fallows (periods without crops) and aims to maximise returns by achieving yield potentials while minimising the development of crop yield reducing constraints such as weeds and diseases. In addition, most crop rotations are intertwined with herbicide and pesticide rotations used to minimise the development of resistance.
This analysis builds on earlier work that looked at the probability of achieving a crop yield by measuring the soil water at sowing. This work concentrates on matching a rotation (sequence of individual crops) to an environment and the trade-offs between the components of the rotation as crop intensities increase. The ability of the rotation to manage weeds and diseases is not presented as part of this discussion.
Methods
Simulations
This study is a simulation analysis that uses the APSIM systems framework (Holzworth et al., 2015) to simulate crop rotations from historic climate records (1900-2012). APSIM has a long history of simulating northern farming systems (Carberry et al., 2009; Whish et al., 2007) and uses environmental signals to trigger appropriate management decisions. However, these simulations only considered the dynamics of water and nutrients. Losses due to waterlogging, heat or frost shock events, disease, pests, weeds or crop nutrition other than nitrogen were not considered by these simulations.
The simulations of all crop sequences were phased, so that each year of the rotation was exposed to each year of the climate record.
Rotations
The rotations presented are a subset of those analysed, and are considered the dominant rotations used across the northern grain region, based on interviews of leading growers and advisers. The rotations used in this discussion cover a range of intensities, but have been restricted to only include the northern region’s most commonly grown crops (Table 1).
Table 1. Summary of key management rules applied to crops across the set of simulations
Crop | Sowing window | Minimum planting soil water (mm) | Variety | Row spacing (cm) | Plant density (#/m2) | Starter fertiliser (N kg/ha) |
|---|---|---|---|---|---|---|
Wheat | 15 May-1 Jul | 100 | Gregory | 25 | 100 | 25 |
Chickpea | 1 May-1 Jul | 100 | Amethyst | 50 | 30 | 0 |
Sorghum | 15 Oct – 15 Jan | 100 | Buster | 100 | 7 | 25 |
Mungbean (spring) | 15 Oct-15 Nov | 60 | Green Diamond | 50 | 30 | 0 |
Mungbean (double crop) | 15 Nov – 15 Jan | 60 |
Table 2. Rotations presented and their cropping intensity measured as number of crops per rotation cycle
Rotation | Rotation code | Crops and rotation length (years) | Intensity (crops/year) |
|---|---|---|---|
Wheat, long fallow, Chickpea, long fallow | Wx|xx|Chx|xx | 2 crops in 4 years | 0.5 |
Sorghum, long fallow, Chickpea, fallow, Wheat, long fallow | Sx|xCh|xW|xx | 3 crops in 4 years | 0.75 |
Sorghum, long fallow, Chickpea, fallow Wheat, fallow, Chickpea, fallow, Wheat, long fallow | Sx|xCh|xW|xCh|xW|xx | 5 crops in 6 years | 0.83 |
Sorghum, fallow, Sorghum, fallow Sorghum, long fallow, Chickpea, fallow, Wheat, long fallow | Sx|Sx|Sx|xCh|xW|xx | 5 crops in 6 years | 0.83 |
Wheat, fallow, Wheat, fallow, Chickpea, fallow | xW|xW|xCh | 3 crops in 3 years | 1 |
Sorghum, fallow, Sorghum, fallow, Mungbean, double crop Wheat, long fallow | Sx|Sx|MgW|xx | 4 crops in 4 years | 1 |
Sorghum, fallow, Sorghum, double crop Chickpea, fallow, Wheat, long fallow | Sx|SCh|xW|xx | 4 crops in 4 years | 1 |
Sorghum, fallow, Mungbean, double crop Wheat, fallow, Chickpea, double crop | Sx|MgW|xCh | 4 crops in 3 years | 1.3 |
Sorghum, double crop Chickpea, fallow, Wheat, double crop Sorghum | SCh|xW|Mgx | 4 crops in 3 years | 1.3 |
All rotations were run at each of the 6 sites (Table 3) to highlight the importance of matching crop choice and intensity to the environmental conditions. The sites were selected to represent a transect from the summer rainfall dominant north to the more equal summer winter split in the south with representative sites from the more marginal cropping areas to highly productive sites. Each site used a locally representative soil (Table 3).
Table 3. Soil details used in simulations at the 6 locations across the northern grains region
Location | Soil description | APSoil No. | Soil plant available water capacity (PAWC) (mm) | Annualrain | ||||
|---|---|---|---|---|---|---|---|---|
Wheat | Sorghum | Chickpea | Mungbean | (mm) | ||||
Pampas | Black Vertosol | 006 | 290 | 234 | 290 | 211 | 698 | |
Goondiwindi | Grey Vertosol | 220 | 188 | 188 | 167 | 140 | 619 | |
Gunnedah | Loam over clay | 615 | 176 | 203 | 176 | 104 | 620 | |
Mungundi | Grey Vertosol | 157 | 186 | 201 | 186 | 141 | 505 | |
Coonamble | Sandy clay duplex | 247 | 181 | 194 | 181 | 134 | 546 | |
Trangie | Medium clay | 684 | 192 | 207 | 192 | 129 | 498 | |
Economic analysis parameters
Average annual gross margin (GM) analysis was conducted for each phased crop sequences using the equation below. Long-term average grain prices (2008-2017) and current variable input prices were used and these were held constant across all locations. Insurance and levy costs together were 2% of the grain income value and were deducted from grain prices. The price for nitrogen (N) fertiliser applied was set at $1.30/kg N and each fallow spray was set at $17/ha excluding GST. The simulations did not account for application losses of N fertilisers; therefore, an additional 30% of applied N was used to ensure fertiliser N reached the soil mineral N pool. The baseline “variable cost” for each crop included planting, non-N nutrients and in-crop pesticide applications. Harvesting costs, N fertiliser and fallow spray frequency were included separately, as these varied between the crop sequences or if crops failed. Crops were considered as failed if the yield was less than the thresholds (Table 4) and harvesting costs were not included. Machinery costs were based on an owner-operated production system; therefore, fuel, oil, repairs and maintenance (FORM) costs where included in the variable costs.

Table 4. Crop prices and variable costs used in gross margin calculations for crop sequences
Crop | Average price ($/t)# | Harvest cost ($/ha) | Variable costs ($/ha) | Failed crop threshold (kg/ha) |
|---|---|---|---|---|
Wheat | 264 | 40 | 175 | 500 |
Sorghum | 225 | 55 | 218 | 800 |
Chickpea | 569 | 45 | 284 | 340 |
Mungbean | 710 | 55 | 276 | 300 |
#farm gate price with grading & additional harvesting costs already deducted
Do higher intensity sequences increase gross margins?
One strategy of improving profitability is to increase the number of crops grown and reduce the number of fallows. This increasing intensity aims to use water that would otherwise be lost through drainage or evaporation to improve system water use efficiency and increase profitability. However, this idea depends on exploiting slack in the current system. One fear with intensification is that inefficiencies within the system, which can work as a buffer from seasonal variability, are lost resulting in similar or lower profits for more work (ie more crops, more work, greater risk but similar returns).
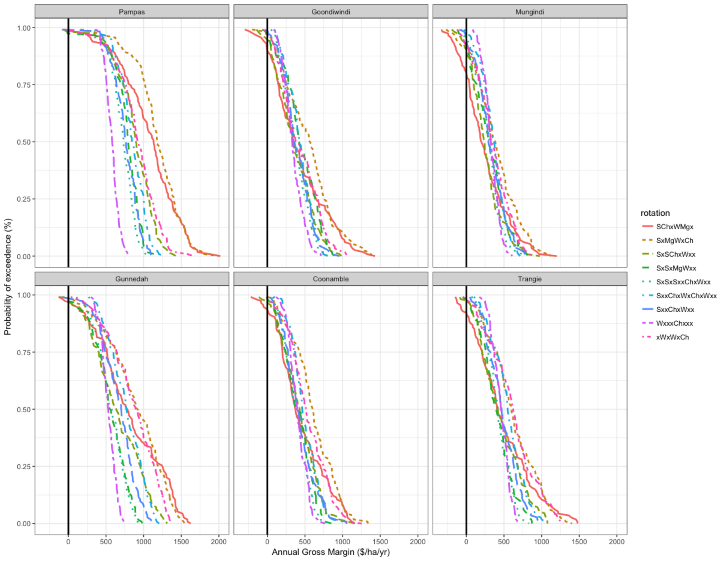
Our initial analysis looks at the annual gross margin for each sequence at each site (Figure 1). The most conservative crop sequence long-fallow, wheat, long-fallow, chickpea, (Wx|xx|Chx|xx) lies on the left hand side (lowest GM) of the gross margin exceedance plot for the highly productive environments (high rainfall and/or high soil PAWC) of Pampas and Gunnedah. Yet as we move to areas with lower average rainfall and soil PAWC, this conservative approach is only on the left side (lowest GM) (bottom half of the figure 25% Mungindi, 38% Coonamble, 25% Trangie) more productive wetter years. Moving from the top of the figure to the bottom reflects a ranking of the cropping seasons from worst to best. It is important to note that the conservative approach does not produce a negative annual gross margin at any site in any season.
The aggressive strategy of the high intensity cropping 1.3 crops per year (SCh|xW|Mgx, Sx|MgW|xCh) produce the greatest gross margin in environment with good water supply (large PAWC or rainfall, (Pampas, Gunnedah) and for more than 50% of seasons at the other sites – but what was the cost?

Figure 1. Comparison of the nine crop rotations examining their probability of exceeding an annual gross margin. The solid black line marks the zero gross margin point with negative gross margins occurring to the left of this line.
Should I increase my cropping intensity?
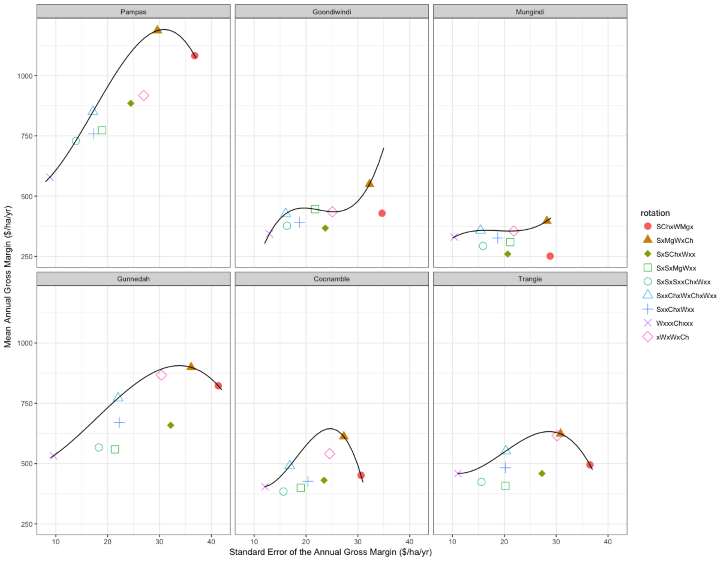
Gross margin is only part of the story; the use of a diverse rotation has many practical and logistic considerations beyond the scope of this presentation. However, increasing the intensity of cropping has risks. One way to consider this risk is to look at the variability of the gross margin (Figure 2). If the variability (or standard error) around the average gross margin is large, then the potential for a boom bust pattern increases. If the variability is low, then gross margins are more stable over time.
Fitting a boundary curve to data highlights those rotations that have the highest gross margin for the least risk. As you move along the boundary towards the top of the curve, the mean gross margin tends to increase as does the risk. Once you pass the top of the curve or move to the right of the line, risk increases but returns do not. This figure also shows how the different environments favour rotations with different patterns. The northern summer dominant patterns favour sequences with summer crops while winter dominated rotations are favoured as you head south (Trangie).

Figure 2. Mean annual gross margin compared to the standard error of the mean annual gross margin. The solid line represents the boundary between increasing returns and increasing variability (risk) around the gross margin mean.
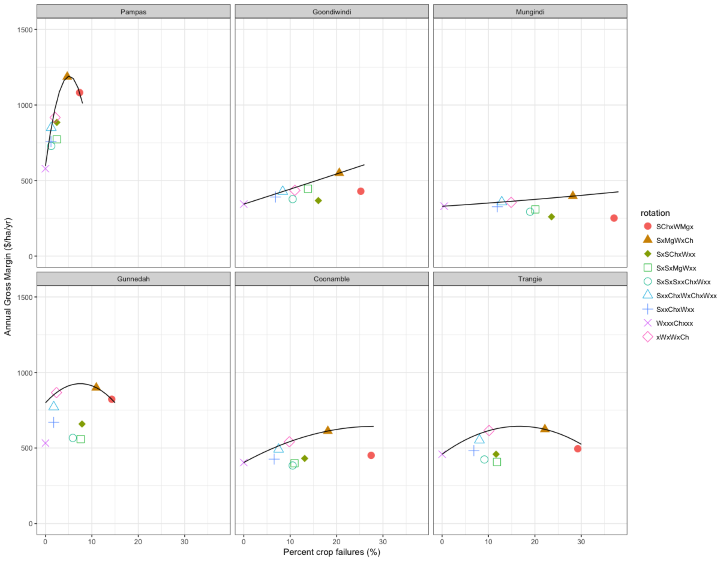
One difficulty with thinking about risk in this statistical way is the standard error does not discriminate between upside and downside risk. An alternative approach is to look at the number of failed crops that may occur (Figure 3). For this analysis a crop was considered to have failed if it generated a negative or zero gross margin. The shape of the boundary fitted to the point where gross margin is maximised and crop failures are minimised, highlights the potential resource supply of the different environments. For example, in Gunnedah swapping from a (SCh|xW|Mgx) to (xW|xW|xCh) will result in similar annual gross margin. The greater supply of water (rainfall and/or PAWC) at Pampas and Gunnedah increase potential yields with few crop failures, less than one crop in 10 failing for most rotations, including the intensive 1.3 crops/year (SxMgWxCh) rotation at Pampas.
The boundary line for the southern and western sites flattens and lengthens suggesting smaller economic benefit for an increase in potential crop failure (risk). This is particularly apparent at Mungindi where the high intensity rotation would have 1 in 3 crops failing. The benefit of sorghum in northern rotations can also be seen with rotations that have little sorghum being less profitable. In contrast, moving south the rotations with little sorghum have fewer failures.

Figure 3. Mean annual gross margin compared to the percentage of failed crops. The solid line represents the boundary between increasing returns and increasing chance of a crop failure
If I increase my cropping intensity will this reduce the amount of water I store during fallows?
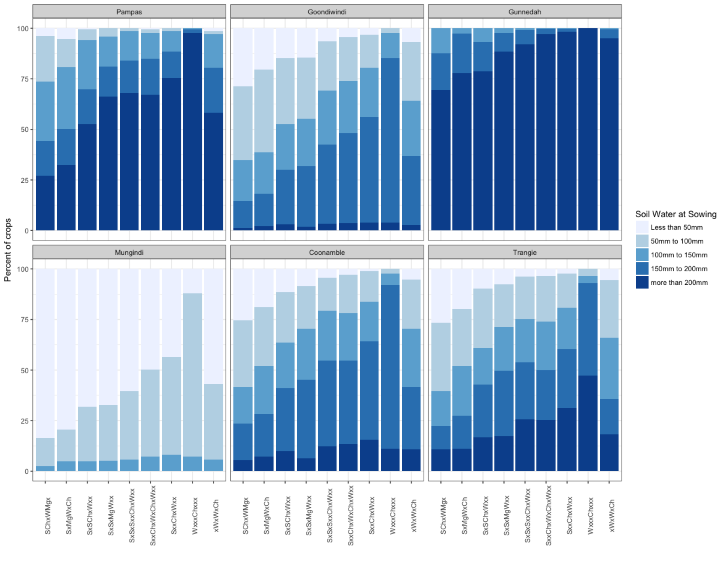
The key to understanding the risk of an individual crop in northern farming environments is to know how much water is stored within the soil prior to planting. This same rule applies when examining a sequence of crops within a rotation. The order of different crops within a sequence can have a significant influence on how well water infiltrates into the soil. The increased water infiltration, resulting in increased water storage, following a spring millet cover crop during a long fallow, is testament to this (Whish et al., 2009. The level of risk (amount of soil water at sowing) an individual is prepared to take is a personal decision. However, the simulations completed during this analysis aimed to plant following a 20mm sowing rain with 100mm (2ft wet soil in a clay soil) of stored water. If this had not been achieved by the end of the sowing window the crops were planted anyway. This allowed us to see those rotations that regularly planted on good soil moisture and those that planted, and how often they planted, on less than ideal soil moistures (Figure 4). A clear difference can be seen between those sites that had a soil with high PAWC and an environment that provided sufficient rainfall to refill the soil. The high intensity systems reduced the initial soil water for all crops. Progressing to the dryer environments of Condobolin and Goondiwindi the more conservative rotations regularly, > 70% of the time, had more than 100mm of stored water at sowing, but as cropping intensity was increased this declined to less than 50 %.

Figure 4. Percent of crops within a rotation sown on a set soil water range (less than 50mm,
50 to 100mm, 100-150mm, 150-200 mm and more than 200mm)
Conclusion
Will increasing the cropping intensity improve returns? The short answer is yes, but risk may also increase. Therefore, before making changes a detailed knowledge of the farm environment and its location is required. Alternatively, increasing the cropping intensity does not have to mean a significant change to an existing rotation. We are currently conducting simulation studies looking at opportunistically including additional crops within the rotation when conditions are favourable. This approach could more accurately be described as tactically including fallows when conditions are unfavourable. Nonetheless, recognising that each crop will have consequences for those crops that follow it is an important decision when aiming to reduce negative and increase positive consequences across the sequence.
Intensification can increase returns, but this increase needs to be placed in context with the known trade-offs, potential for failed crops, increased work load, additional grain storage needs, and logistic and management concerns. Looking at the annual gross margins (Figure 1) the highly productive environments (high rainfall, high soil PAWC) had the widest spread between the different rotation options for the greatest number of years. The rotations at the other sites were similar (little spread) for 50% of the time and then began to separate in the more productive (wetter) seasons, suggesting that intensification is valuable during this time only. Identifying productive seasons at sowing is not possible, but using simple soil water rules may help predict them. A future analysis will compare the benefits of a fixed rotation to those of a structured opportunistic rotation that uses soil water to try and predict the more productive seasons.
One interesting observation from this study is the comparison of the two high intensity rotations. One used the pulses (mungbean and chickpea) as double crops to swap between seasons, the other ensured the pulses were always planted following a fallow and the cereals (wheat and sorghum) became the double crops. The difference in gross margin between the two, highlight how restructuring an existing rotation can improve returns without changing intensity. Shifting the focus within a rotation to ensure the most valuable crop receives the greatest opportunity for success is one way to increase profitability without forsaking the good agronomic practices of the rotation.
The reliability of the ultra-conservative long-fallow wheat long-fallow chickpea in the more marginal cropping regions offers the notion of a base rotation which can be intensified when the opportunity arises; this allows the cropping intensity to match the variability of the environment. However, this approach requires strict rules to ensure the lure of high prices for specific crops does not negate good agronomic principles.
This study has focused on the biotic factors of water, temperature, and nitrogen supply, to look at the productivity of different crop rotations. As acknowledged earlier, there is far more to the design of a rotation than looking at which sequence uses resources efficiently. However, it is hoped that by providing insight into how a rotation interacts with its environment, better decisions can be made to improve the resilience and productivity of crop sequences.
Acknowledgements
The research undertaken as part of this project is made possible by the significant contributions of growers through both trial cooperation and the support of the GRDC, the author would like to thank them for their continued support.
References
Carberry, P.S., Hochman, Z., Hunt, J.R., Dalgliesh, N., McCown, R.L., Whish, J.P.M., Robertson, M.J., Foale, M., Poulton, P.L., van Rees, H., 2009. Re-inventing model-based decision support with Australian dryland farmers. 3. Relevance of APSIM to commercial crops. Crop Pasture Sci. 60, 1044–1056. doi:10.1071/CP09052
Holzworth, D.P., Snow, V.O., Janssen, S., Athanasiadis, I.N., Donatelli, M., Hoogenboom, G., White, J.W., Thorburn, P., 2015. Agricultural production systems modelling and software: Current status and future prospects. Environmental Modelling & Software 72, 276–286. doi:10.1016/j.envsoft.2014.12.013
Whish, J.P.M., Castor, P.A., Carberry, P.S., 2007. Managing production constraints to the reliability of chickpea (Cicer arietinum L.) within marginal areas of the northern grains region of Australia. Crop Pasture Sci. 58, 396–405. doi:10.1071/AR06179
Whish, J.P.M., Price, L., Castor, P.A., 2009. Do spring cover crops rob water and so reduce wheat yields in the northern grain zone of eastern Australia? Crop Pasture Sci. 60, 517–525. doi:10.1071/CP08397
Contact details
Jeremy Whish
CSIRO
306 Carmody Road, St Lucia QLD 4067, Australia
Ph: 07 4571 3215
Email: Jeremy.Whish@CSIRO.au
GRDC Project Code: CSP1406-007RTX,
Was this page helpful?
YOUR FEEDBACK
