Barley agronomy results from the central west and Riverina NSW, 2017
Author: David Burch, Nick Moody (NSW Department of Primary Industries, Condobolin) Felicity Harris (NSW Department of Primary Industries, Wagga Wagga) | Date: 13 Feb 2018
Take home messages
- The target flowering date for barley sown in central west NSW is the last week of August to the first week of September.
- La Trobe and Compass are responsive to nitrogen (N) fertiliser provided sufficient rainfall occurs during the grain filling period.
- New barley varieties provide improved yield potential if there is adequate rainfall, however La Trobe remains the yield benchmark in low yielding environments.
2017 seasonal and production summary
The 2017 growing season was impacted with lower than average winter rainfall throughout much of NSW, resulting in an estimated statewide barley yield of 1.5t/ha. This is a 26% decrease on the 10 year average to 2016. Barley total production in 2017 fell by 56% compared to the record year of 2016, with a total statewide production of 1,185 kt (ABARES, 2017).
Frost events were widespread across the state with yield losses attributed to stem frost and frost induced sterility. Low rainfall inhibited the production of later tillers, although above average rainfall in October boosted crop yields in milder longer season regions of the state. The world indicator price for barley (France feed barley, FOB Rouen) was forecast to average US$180 per tonne (December 2017), a 14% increase on 2016 prices.
New barley varieties
AGTB0015 (Australian Grains Technologies)
AGTB0015 is suited to the medium to high rainfall areas with yields comparative to or in excess of the current yield benchmarks and with improved standability, head retention and grain size. AGTB0015 entered the malt accreditation process in 2017, with a decision due in 2020.
Biere (GrainSearch)
Biere (GS 9516-06) is a short season variety with malt potential. Flowering seven days earlier than La Trobe, it is intended for medium to low rainfall zones due to faster maturity, and is most suited to 2-3t/ha environments. It has entered stage 1 malt accreditation in 2017, although it will be repeated in 2018 due to insufficient seed.
Bottler (GrainSearch)
Bottler (HV16) is an export malt type grain suited to medium to high rainfall zones currently being evaluated to replace Baudin. While it has malt characteristics, it has currently not been entered into the malt accreditation process.
Compass (University of Adelaide)
Compass is derived from Commander, with improved grain yield and plumpness. It is slightly later to flower than La Trobe, with an increased tendency to lodge in wet conditions. Compass is currently undergoing stage 2 malt evaluation, with a possible decision by 2018.
Explorer (University of Adelaide)
Explorer is a late season, high rainfall variety, intended for a similar environment to Westminster. Field trials indicate its yield is consistently 12% higher than Westminster with similar agronomic traits.
RGT Planet (Seed Force)
RGT Planet was released in Europe in 2010 and has since been the top yielding malt variety in many countries. It was introduced to the NVT program in 2016 and was the highest yielding variety in 60% of the sites in NSW. Field trials indicate RGT Planet is early flowering and late maturing, with the flexibility to adapt to early or late season finishes.
Spartacus CL (InterGrain)
Spartacus CL is an imidazolinone tolerant barley with similar grain yield, quality and agronomic characteristics to La Trobe. Spartacus CL is higher yielding than Scope CL, flowering 10 days earlier and has a lower risk of head loss. Spartacus CL has been released as a feed barley although it is being evaluated for malt accreditation, with a possible decision by March 2018.
Varietal response to sowing date at Condobolin 2017
The date in which a barley crop flowers is determined by varietal selection and environment. It is important for growers to be aware of the differences in a varieties’ phasic length in order to maximise yield when making varietal and sowing decisions. Early flowering varieties’ such as Hindmarsh and La Trobe have become popular due to their yield stability in medium to low rainfall cropping zones, however, early flowering dates expose the crop to the risk of frost damage. Conversely, late flowering times can result in moisture stress during grain fill and subsequent yield penalties. Experiments conducted in 2017 assessed the flowering date and yield response of a number of commercially available varieties over a range of sowing dates in central western NSW.
Method
A replicated split plot experimental trial was conducted at Condobolin in 2017 (Table 1). The site received below average rainfall at the beginning of the growing season, and was impacted by frost damage throughout the flowering period. Sowings were conducted at three dates in order to represent early, main and late season sowings.
Table 1. Site characteristics for Condobolin Agricultural Research and advisory station 2017.
Soil Type | Red-brown chromosol |
|---|---|
Rainfall | GSR (Apr-Sep): 99mm (LTA GSR 209mm) |
Previous crop | Fallow |
Fertiliser | 70kg/ha MAP (sowing) Starting N 114kg/ha |
Results and discussion
Eighty-four frost events occurred throughout the growing period in Condobolin, with 26 nights recording temperatures of below -2°C. Frost and low rainfall were the major limitations to crop yield.
There were significant effects observed between varieties (P < 0.001), and sowing dates (P = 0.003) at Condobolin (Table 2). The 12 May (mid-season) sowing date had the greatest grain yield overall, with a mean yield of 1.68t/ha in Condobolin. The late season sowing was the lowest yielding at Condobolin with a mean of 1.50t/ha.
Table 2. Grain yield and flowering date of sixteen barley varieties from three times of sowing (TOS) at Condobolin 2017.
TOS 1 - 24 April, 2017 | TOS 2 - 12 May, 2017 | TOS 3 - 25 May 2017 | ||||
|---|---|---|---|---|---|---|
Variety | Grain Yield | Heading date | Grain Yield | Heading date | Grain Yield | Heading date |
AGTB0015 | 1.86 | 28-Aug | 1.73 | 9-Sep | 1.69 | 16-Sep |
| Biere | 1.45 | 12-Aug | 1.48 | 30-Aug | 1.36 | 10-Sep |
| Bottler | 1.94 | 8-Sep | 1.57 | 17-Sep | 1.48 | 21-Sep |
| Commander | 1.85 | 9-Sep | 1.95 | 20-Sep | 1.79 | 25-Sep |
| Compass | 1.78 | 25-Aug | 1.90 | 10-Sep | 1.59 | 22-Sep |
| Fathom | 1.72 | 24-Aug | 1.86 | 8-Sep | 1.86 | 15-Sep |
| Hindmarsh | 1.11 | 20-Aug | 1.55 | 8-Sep | 1.36 | 14-Sep |
IGB1305 | 1.81 | 11-Sep | 1.72 | 18-Sep | 1.38 | 23-Sep |
IGB1512 | 0.99 | 18-Aug | 1.73 | 8-Sep | 1.71 | 16-Sep |
| La Trobe | 1.61 | 20-Aug | 1.82 | 8-Sep | 1.54 | 17-Sep |
| RGT Planet | 1.88 | 4-Sep | 1.56 | 12-Sep | 1.56 | 18-Sep |
| Rosalind | 1.36 | 17-Aug | 1.38 | 7-Sep | 0.95 | 23-Sep |
| Spartacus CL | 1.32 | 19-Aug | 1.61 | 7-Sep | 1.46 | 18-Sep |
| Urambie | 1.74 | 17-Sep | 1.41 | 22-Sep | 1.39 | 26-Sep |
| Westminster | 1.60 | 17-Sep | 1.68 | 22-Sep | 1.18 | 26-Sep |
WI4982 | 1.48 | 7-Sep | 1.96 | 10-Sep | 1.73 | 17-Sep |
Mean (TOS) | 1.59 | 31-Aug | 1.68 | 13-Sep | 1.50 | 21-Sep |
l.s.d (P<0.05) TOS 0.09 t/ha, Variety 0.24 t/ha | ||||||
Mid-May sowings yielded significantly greater than early and late sown treatments overall, although varieties AGTB0015, Bottler, IGB1305, RGT Planet and Urambie all yielded significantly higher when sown on April 24. All varieties with the exception of Fathom and RGT Planet incurred a yield penalty in the late sowing compared to mid-season.
This experiment and prior years’ experiments indicate that in the central west of NSW, the target flowering date is the last week of August to the first week of September in order to avoid frost induced yield losses and ensure sufficient soil moisture for grain fill (Figure 2). It is important to note that decisions on varieties and sowing dates require knowledge of multi-year trends, as a single season may not be representative of the typical regional growing environment.
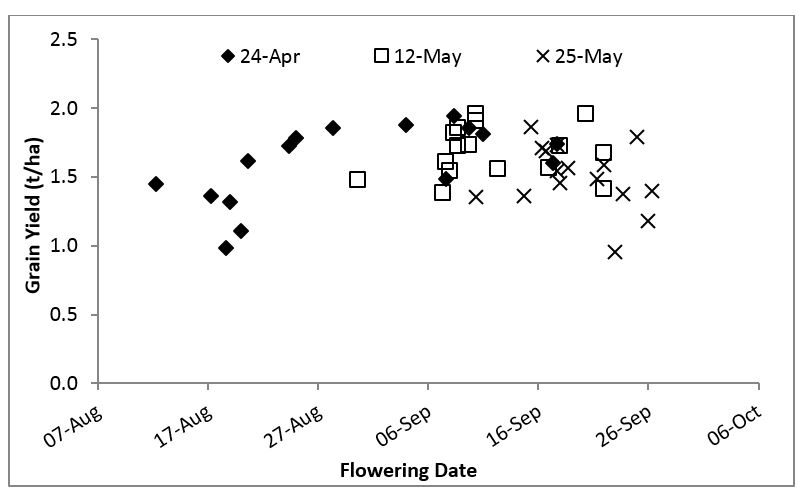
Figure 1. Flowering date and grain yield of barley varieties sown at three dates at Condobolin 2017. l.s.d. (P < 0.05) Time of sowing 0.09 t/ha, Variety 0.24 t/ha.
Yield and quality responses to nitrogen fertiliser
For barley to be accepted for malt, it must have a grain protein concentration of between 9% and 12%. The addition of N fertiliser can boost yields in environments where water is not limiting. However, high N rates combined with moisture stress may result in high grain protein concentration, reduce retention (grain retained above 2.5mm sieve), increase screenings (grain below 2.2mm sieve) and reduce grain weight. Increased lodging may also occur in susceptible varieties such as Commander and Compass. A series of field experiments were conducted to assess the yield and quality responses of four commercial barley cultivars to different N treatments.
Method
Field experiments were conducted in the Riverina and central west of NSW assessing varietal responses to N fertiliser between 2013 and 2016. Malting varieties Commander, GrangeR, La Trobe and Compass (currently undergoing malt accreditation) were sown in randomised complete block trials with 0, 30, 60, 90 and 120kg/ha of N applied as urea at sowing.
Results and discussion
Averaged over all years, there was a significant decrease in yield as N applications increased, while grain protein concentration significantly increased (Table 3). Yield and subsequent quality responses were highly variable over the four years of the experiment, due to large differences in available moisture year to year. Yield reduction following N application can in part be attributed to decreased grain size, which significantly reduced retention and increased screenings. Hectolitre weights were also significantly reduced with increasing N. Number of ears per square metre was unchanged in all varieties except for La Trobe, which significantly increased. There was a significant variety by N interaction for grain protein, screenings, hectolitre weight and anthesis biomass. There was no interaction for yield, retention, grain weight, harvest index, and grain weight per ear, indicating no difference in varietal response to N application.
Table 3. Grain yield and quality of four barley varieties treated with five nitrogen (N) rates between 2013 and 2016.
Grain yield (t/ha) | Grain protein (%) | |||||||
|---|---|---|---|---|---|---|---|---|
N Treatment | Commander | Compass | GrangeR | LaTrobe | Commander | Compass | GrangeR | LaTrobe |
0 | 3.4 | 3.95 | 3.59 | 4.15 | 13.4 | 12.2 | 13.6 | 12.3 |
30 | 3.3 | 3.92 | 3.75 | 4.13 | 13.9 | 12.8 | 14.8 | 13.3 |
60 | 3.14 | 3.76 | 3.54 | 4.25 | 14.5 | 13.7 | 15.8 | 13.7 |
90 | 3.08 | 3.82 | 3.65 | 4.19 | 14.6 | 13.9 | 15.8 | 14 |
120 | 3.16 | 3.73 | 3.55 | 4.09 | 15.2 | 14.5 | 16.6 | 14.8 |
l.s.d (P = 0.05) | Variety 0.24 t/ha, N rate 0.10 t/ha | Variety 0.30 %, N rate 0.21 %, V x N 0.39 % | ||||||
The highest yielding variety in all treatments was La Trobe, while Compass had equal or lower grain protein concentrations to La Trobe. While lower grain protein concentrations may be due to yield dilution, a comparison of total protein yield per hectare (Figure 2) indicates that La Trobe and GrangeR convert N fertiliser into grain protein more readily, while Compass has a greater capacity to convert N fertiliser into yield while suppressing grain protein.
An analysis of agronomic efficiency (kg grain yield per kg of N applied), it was found that La Trobe and Compass were significantly more responsive to N fertiliser than GrangeR and Commander. The agronomic efficiency of all varieties decreased at higher N applications, indicating that in sites where yield is limited by other nutrients or moisture limitation, high N applications may only serve to decrease grain size and increase protein.
Agronomic efficiency is highly dependent on moisture availability. In a comparison of low rainfall years, such as that in 2015 compared with high rainfall years such as 2016 demonstrated, a 72% increase in the efficiency of all varieties’ capacity to convert N fertiliser into protein was observed. In higher yielding environments additional N applications may need to be applied to a low protein variety such as Compass in order to ensure its grain protein concentration is sufficient for malt quality.
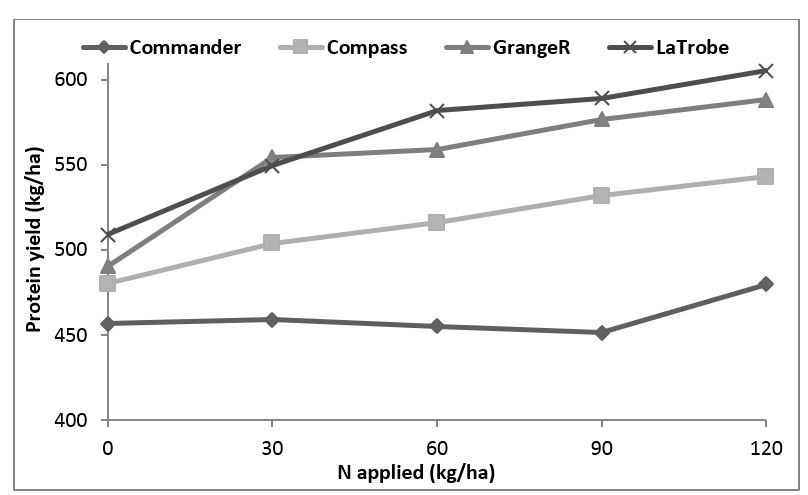
Figure 2. Protein yield of four barley varieties treated with five concentrations of N fertiliser. l.s.d (P < 0.05) (Variety) 22 kg/ha.
Comparison of four high yielding varieties under different water treatments at Condobolin 2017
Since its commercial release in 2013, La Trobe barley has become the most widespread malting variety in the low and medium rainfall zone, due to consistently high yields and desirable malt characteristics. Since then, several barley varieties have entered the market, with comparable yield and quality characteristics, providing varietal alternatives for growers in the medium to low rainfall zone. This experiment assesses the performance of La Trobe against newly released barley varieties Compass, Rosalind and RGT Planet under different irrigation treatments.
Method
Please refer to Table 1 for site conditions. Four irrigation treatments were applied to the experiment, as described in Table 4. The growing season was divided into pre and post anthesis phases, assuming an anthesis date of September 1. The rainfed treatment was naturally occurring rainfall, while full irrigation consisted of 120mm of additional water. Pre and post-anthesis irrigation consisted of 60mm of irrigation water applied either before or after anthesis.
Table 4. Four irrigation treatments applied to four barley varieties at Condobolin, NSW 2017.
Watering timing | Rainfed | Pre-anthesis irrigation | Post-anthesis irrigation | Full irrigation |
|---|---|---|---|---|
Pre anthesis | 93 | 153 | 93 | 153 |
Post-anthesis | 6.2 | 6.2 | 66.2 | 66.2 |
Total | 99.2 | 159.2 | 159.2 | 219.2 |
Results and discussion
Yield
There was a significant yield difference in irrigation treatments and variety, with a significant interaction between the two. La Trobe was the lowest yielding variety overall, although there was no significant yield difference between varieties in the rainfed treatment (Figure 3). The highest yielding varieties were Rosalind and RGT Planet in the fully irrigated treatment, Compass and Rosalind in the post–anthesis irrigation treatment and RGT Planet and Rosalind in the pre–anthesis irrigation treatment (Table 5).
Table 5. Yield (t/ha) and yield components of four barley varieties treated with different irrigation regimes.
Irrigation treatment | |||||||
|---|---|---|---|---|---|---|---|
120mm irrigation | Rainfed | 60mm | 60mm | Mean | |||
Yield (t/ha) | Compass | 2.80 | 1.31 | 1.92 | 2.01 | 2.01 | |
| La Trobe | 2.55 | 1.32 | 1.88 | 1.32 | 1.77 | ||
| RGT Planet | 3.01 | 1.22 | 2.36 | 1.68 | 2.07 | ||
| Rosalind | 3.19 | 1.44 | 2.19 | 1.74 | 2.14 | ||
Mean | 2.89 | 1.32 | 2.09 | 1.69 | 2.00 | ||
l.s.d. (P = 0.05) | Variety 0.14, Treatment 0.09, Interaction 0.29 | ||||||
No. grains/m2 | Compass | 9551 | 6277 | 8336 | 7584 | 7937 | |
| La Trobe | 8982 | 6601 | 8130 | 6701 | 7604 | ||
| RGT Planet | 9586 | 5275 | 8899 | 6359 | 7530 | ||
| Rosalind | 9879 | 5485 | 8189 | 6543 | 7524 | ||
Mean | 9500 | 5910 | 8389 | 6797 | 7649 | ||
l.s.d. (P = 0.05) | Variety 645, Treatment 643, Interaction 1290 | ||||||
No. tillers/m2 | Compass | 558 | 375 | 492 | 619 | 511 | |
| La Trobe | 611 | 467 | 578 | 551 | 552 | ||
| RGT Planet | 486 | 316 | 462 | 491 | 439 | ||
| Rosalind | 612 | 429 | 630 | 514 | 546 | ||
Mean | 567 | 397 | 540 | 544 | 512 | ||
l.s.d. (P = 0.05) | Variety 52.4, Treatment 28.2, Interaction 0.29 | ||||||
Grain No/tiller | Compass | 17.2 | 16.9 | 17.4 | 12.7 | 16.0 | |
| La Trobe | 15.2 | 14.2 | 14.3 | 12.2 | 14.0 | ||
| RGT Planet | 19.8 | 16.8 | 19.2 | 13.1 | 17.2 | ||
| Rosalind | 16.5 | 13.1 | 13.3 | 12.8 | 13.9 | ||
Mean | 17.1 | 15.3 | 16.0 | 12.7 | 15.3 | ||
l.s.d. (P = 0.05) | Variety 0.97, Treatment 0.72, Interaction 1.94 | ||||||
Thousand grain weight (g) | Compass | 49.3 | 38.5 | 42.4 | 42.7 | 43.2 | |
| La Trobe | 43.1 | 35.9 | 37.1 | 38.6 | 38.7 | ||
| RGT Planet | 51.2 | 36.9 | 42.0 | 42.2 | 43.1 | ||
| Rosalind | 46.6 | 36.9 | 39.7 | 39.9 | 40.8 | ||
Mean | 47.5 | 37.0 | 40.3 | 40.8 | 41.4 | ||
l.s.d. (P = 0.05) | Variety 0.59, Treatment 0.36, Interaction 1.17 | ||||||
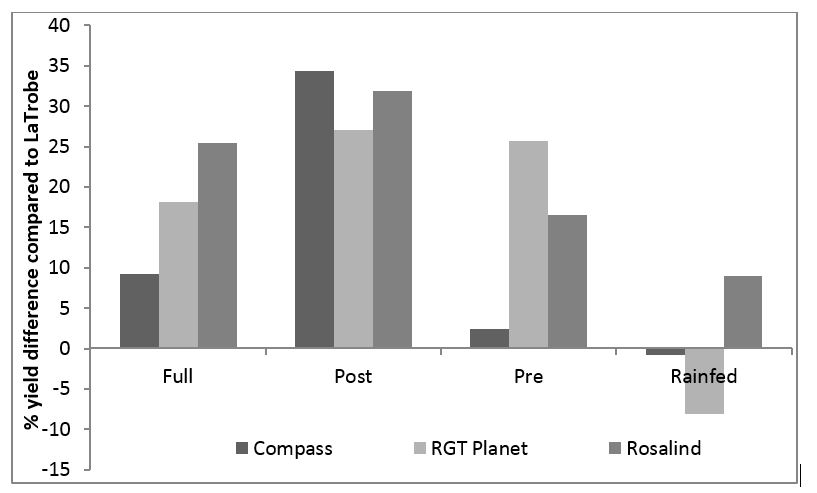
Figure 3. Percentage difference in grain yield of three barley cultivars as compared to La Trobe when treated with four irrigation treatments.
Yield Components
Grain yield is a factor of three components; grain weight, tiller number and number of grains per tiller. The main driver for grain yield in this experiment was total grains per square metre (Figure 4), with an r2 value of 0.88 between grain yield and number of grains per square metre. This indicates that the greatest drivers of yield are tillers per square metre and number of grains per tiller. La Trobe produced significantly more tillers than other varieties, with RGT Planet producing the least. This difference has been offset by more kernels per spike and larger grain weight in RGT Planet.
There was a significant varietal effect from the irrigation treatment on grain number per tiller, thousand grain weight and tillers per m2. Number of grains per m2 was not affected by variety, but was affected by irrigation treatment. When assessing yield stability in high and low water availabilities, La Trobe demonstrated the smallest decrease in yield, grains per m2, tillers per m2 and thousand grain weight. RGT Planet, while yielding competitively in the irrigated treatment, had the greatest decrease in yield, grains per m2, tillers per m2 and thousand grain weight. While RGT Planet has demonstrated a capacity for high yields when moisture is available, it does not demonstrate a yield advantage over other varieties when moisture is limiting.
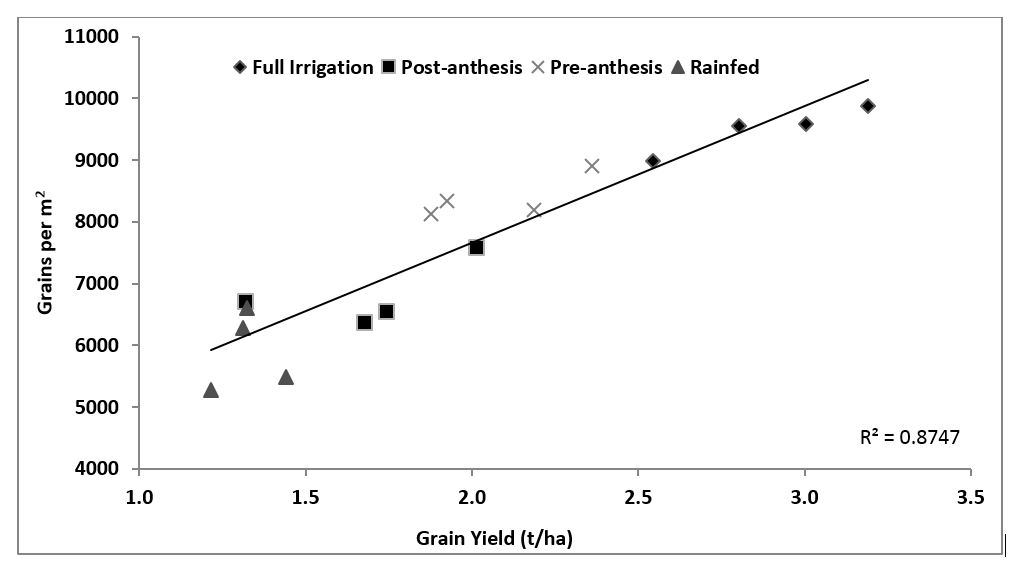
Figure 4. Relationship between grain number per square metre and total grain yield for four barley varieties treated with four irrigation practices.
Quality
There were significant differences between variety and irrigation treatments with a significant interaction for protein, screenings, retention, test weight, harvest index and thousand grain weight (Tables 5 and 6). Compass and RGT Planet demonstrated the greatest ability to suppress grain protein concentration, although this may have been in part due to yield dilution. When moisture stress occurred, RGT Planet demonstrated significantly lower retention rates of 63%, which has the potential to affect receival prices if accepted for malt in the future. There was a significant difference in grain protein concentration within the fully irrigated treatment, with La Trobe significantly higher than RGT Planet, although there was no difference in the rainfed treatment between any of the varieties. As with previous experiments, a high yielding variety like La Trobe can have a genetic tendency to accumulate high grain protein (Table 6).
Table 6. Quality traits of four barley varieties sown using four irrigation practices at Condobolin, NSW 2017.
Irrigation treatment | ||||||
|---|---|---|---|---|---|---|
120 mm irrigation | Rainfed | 60 mm | 60 mm | Mean | ||
Protein (%) | Compass | 12.3 | 13.5 | 12.3 | 14.8 | 13.2 |
| La Trobe | 13.5 | 13.3 | 12.8 | 15.7 | 13.8 | |
| RGT Planet | 12.0 | 13.6 | 12.0 | 14.7 | 13.1 | |
| Rosalind | 12.4 | 13.8 | 13.3 | 15.0 | 13.6 | |
Mean | 12.6 | 13.5 | 12.6 | 15.1 | 13.4 | |
l.s.d. (P = 0.05) | Variety 0.4, Treatment 0.3, Interaction 0.7 | |||||
Test weight (kg/HL) | Compass | 65.9 | 62.3 | 63.8 | 65.1 | 64.3 |
| La Trobe | 67.9 | 64.3 | 64.9 | 66.4 | 65.8 | |
| RGT Planet | 67.6 | 62.6 | 63.9 | 65.6 | 64.9 | |
| Rosalind | 67.2 | 63.7 | 64.8 | 65.4 | 65.3 | |
Mean | 67.1 | 63.2 | 64.4 | 65.6 | 65.1 | |
l.s.d. (P = 0.05) | Variety 0.35, Treatment 0.28, Interaction 0.7 | |||||
Retention (>2.5mm) | Compass | 98.5 | 85.3 | 90.8 | 94.2 | 92.2 |
| La Trobe | 93.9 | 74.3 | 70.0 | 87.7 | 81.5 | |
| RGT Planet | 98.0 | 63.0 | 82.8 | 90.2 | 83.5 | |
| Rosalind | 96.8 | 73.3 | 81.0 | 88.8 | 85.0 | |
Mean | 96.8 | 74.0 | 81.2 | 90.2 | 85.5 | |
l.s.d. (P = 0.05) | Variety 1.8, Treatment 1.4, Interaction 3.6 | |||||
Screenings (<2.2mm) | Compass | 0.4 | 2.1 | 1.2 | 1.1 | 1.2 |
| La Trobe | 0.7 | 2.9 | 4.6 | 1.6 | 2.5 | |
| RGT Planet | 0.5 | 4.1 | 2.0 | 2.1 | 2.2 | |
| Rosalind | 0.5 | 4.6 | 3.1 | 2.0 | 2.5 | |
Mean | 0.5 | 3.4 | 2.7 | 1.7 | 2.1 | |
l.s.d. (P = 0.05) | Variety 0.34, Treatment 0.29, Interaction 0.69 | |||||
Harvest Index | Compass | 0.51 | 0.49 | 0.50 | 0.48 | 0.5 |
| La Trobe | 0.53 | 0.52 | 0.51 | 0.52 | 0.5 | |
| RGT Planet | 0.54 | 0.47 | 0.52 | 0.47 | 0.5 | |
| Rosalind | 0.52 | 0.48 | 0.49 | 0.49 | 0.5 | |
Mean | 0.5 | 0.5 | 0.5 | 0.5 | 0.5 | |
l.s.d. (P = 0.05) | Variety 0.01, Treatment 0.01, Interaction 0.02 | |||||
While new barley varieties on the market have greater yield potential if there is improved moisture availability, if sowing in a region where there is the potential of low rainfall such as central west NSW, there is minimal competitive advantage over the benchmark variety La Trobe. However, under higher rainfall scenarios, new varieties do provide a competitive advantage to La Trobe, although none of the other three varieties assessed in this experiment can currently be accepted for malt.
Cultural management of grass weeds within barley crops.
Herbicide options for in-season control of grass weeds in cereal crops can be limited. While some products are marketed specifically for wild oat control in cereals, herbicide applications must be timed correctly, or they can be ineffective, damage the crop and encourage herbicide resistance in future weed generations. One non-chemical management strategy is to select a cereal variety with sufficient early season vigour to out-compete weeds, precluding, or reducing reliance on herbicide use. This experiment used oat weed surrogates to assess the competitiveness of 18 commercial barley varieties for their capacity to suppress or out-compete weeds during the growing season in 2016.
Table 7. Site characteristics for the Condobolin Agricultural Research and Advisory Station 2016.
Soil Type | Red-brown chromosol |
|---|---|
Rainfall | GSR (Apr-Sep): 467mm (mean GSR 209mm) |
Previous crop | wheat |
Fertiliser | 70kg/ha MAP (sowing) |
Method
Wintaroo oats (Avena sativa L.) were used as a surrogate for wild or black oats (Avena fatua, L.). Seeds were distributed onto the surface of experimental plots with a target plant density of 60 plants/m2 prior to sowing. As plots were sown, some oat seeds were incorporated into the soil, simulating natural weed seed distribution. Barley varieties were sown in accordance with regional farming practices, with a target density of 125 plants/m2.
Results and discussion
Grain yield
As oat biomass increased per m2, barley yields decreased (Figure 5). There was no significant difference in total biomass/m2 in the presence or absence of oats although the number of total tillers decreased in the presence of oats. There was a significant effect on yield of oat affected plots compared to control (oat free) plots (Table 8). All varieties had a yield penalty in the presence of oats with the exception of Bass and Buloke which showed no significant yield difference. The most impacted varieties were GrangeR, Spartacus and Urambie (Table 9).
Table 8. Performance of barley yield components in the presence and absence of Wintaroo oats. ANOVA F probabilities for variety (V), Oat treatment (T), and interaction.
Weed Treatment | ANOVA F probabilitya | ||||
|---|---|---|---|---|---|
Yield Component | Nil | Oats | V | T | V X T |
Grain Yield (t/ha) | 4.28 | 3.45 | NS | ** | NS |
Tillers/m2 | 647 | 516 | ** | ** | NS |
Grain Weight (mg) | 47.29 | 46.34 | ** | ** | NS |
Grains/tiller | 18.35 | 19.51 | ** | * | NS |
Grain weight per tiller (g) | 0.87 | 0.90 | ** | NS | NS |
Grain number/m2 | 11 649 | 9 904 | NS | ** | NS |
Dry matter/m2 (g) | 1 018 | 787 | ** | ** | NS |
Dry matter/tiller (g) | 1.051 | 0.976 | ** | ** | NS |
Harvest Index | 0.45 | 0.48 | ** | ** | NS |
aNS = not significant; * and ** = significant at the 0.05 and 0.01 levels of probability.
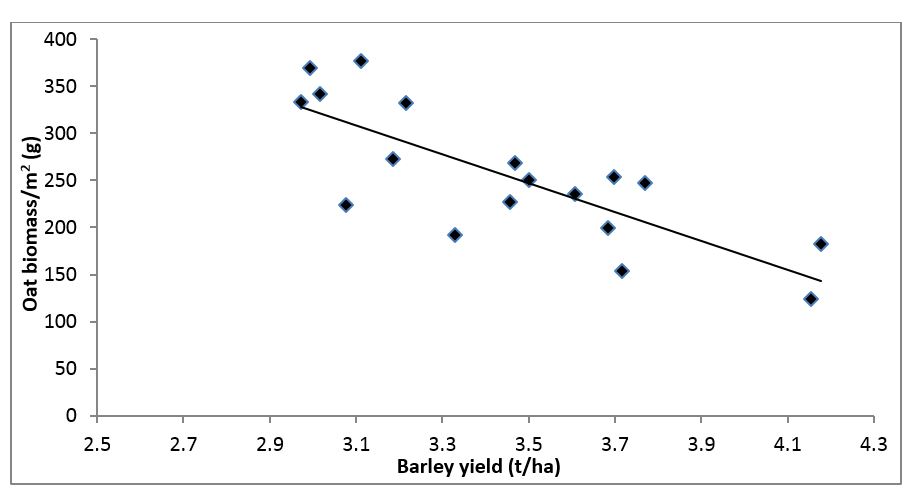
Figure 5. Relationship between oat biomass collected from experimental plots and barley yield (r2 = 0.62).
Yield component analysis
The presence of oats significantly influenced all yield components except for grain weight per tiller (Table 8). Varietal competitiveness was assessed by comparing the percentage change in yield component due to the presence of oats (Table 9) as compared to oat free control plots.
Table 9. Percentage change in yield components in the presence of oats. * indicates a significant (P =0.05) treatment effect.
Variety | Yield | Grain weight | Tillers/m2 | Grains/tiller |
|---|---|---|---|---|
| Bass | 0.2 | -0.8 | -11.4* | 15.8* |
| Buloke | -0.6 | -2.2* | -23.8* | 18.3* |
| Commander | -15.4* | 0.0 | 2.9 | -9.7* |
| Compass | -19.3* | -3.1* | -9.9* | -19.1* |
| Fathom | -13.3* | 1.0* | -26.3* | -0.1 |
| Flinders | -12.4* | 0.6 | -16.1* | -2.2 |
Gairdner | -13.1* | -0.3 | -13.0* | 4.8* |
| GrangeR | -32.4* | -4.8* | -23.5* | -2.2 |
| Hindmarsh | -18.5* | -0.5 | -15.1* | 4.4 |
| La Trobe | -16.8* | -0.6 | -13.7* | 14.6* |
| Maritime | -10.5* | -3.2* | -21.5* | 8.1* |
Oxford | -23.1* | -4.5* | -26.6* | 12.9* |
| Rosalind | -29.5* | -3.3* | -36.7* | 6.1* |
| Scope CL | -14.24* | -1.4* | -20.1* | 15.2* |
| Spartacus CL | -31.27* | 0.8 | -43.5* | 23.3* |
| Urambie | -29.84* | -3.9* | -14.1* | 8.9* |
| Westminster | -28.95* | -5.1* | -34.7* | 8.5* |
| Wimmera | -29.74* | -5.1* | -5.3 | -4.3 |
Varietal capacity to suppress oats
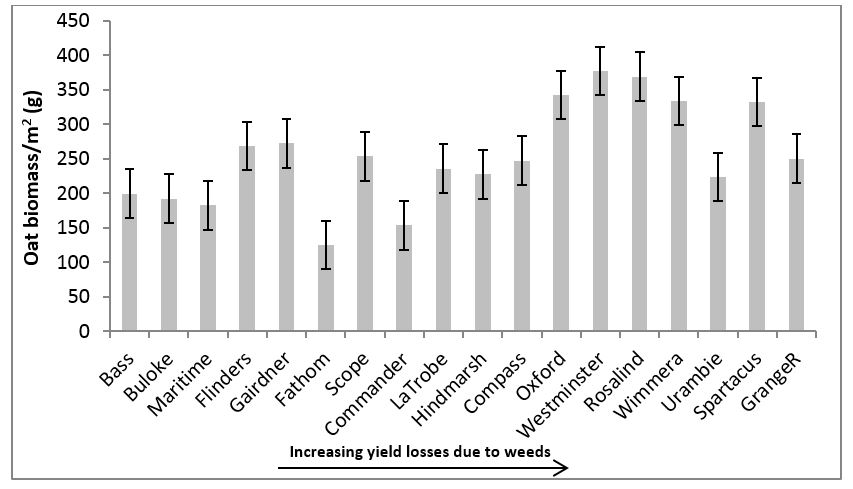
Figure 6. Total biomass/m2 of oats recorded within experimental plots. X axis ranked in order of the percentage yield loss for each respective variety in the presence of oats. Error bars indicate 5% l.s.d. between varieties for total oat biomass present per m2.
Measurement of dry oat biomass/m2 at harvest demonstrated some correlation (r2 = 0.41) with yield. While the capacity to suppress weed development is associated with reduced yield losses, some varieties, such as Flinders and Gairdner demonstrate small yield reductions with average oat suppression. Meanwhile, Fathom and Commander demonstrated the strongest capacity to suppress oat development, although ranked sixth and eighth for yield losses in the presence of oats (Figure 6).
While early season oat suppression is important for maximising yield, other mechanisms contribute to specific varieties’ capacity to perform in the presence of oats. The barley varieties used in this experiment varied widely in morphology and phenology. Despite this variation, and yield losses in oat treatmentsthere was no single trait that led to superior oat suppression. This experiment indicated that a combination of varietal traits such as early season vigour, shading effects and environmental suitability contribute to oat suppression through diverse mechanisms.
Acknowledgements
This research was supported by both the GRDC and NSW DPI and is made possible by the significant contributions of growers through both trial cooperation and the support of the GRDC, the author would like to thank them for their continued support.
A sincere thankyou to Blake Brangwin, Daryl Reardon, Craig Ryan, Leisl O’Halloran, Susi Brangwin, Tara Burns and Sarah Baxter for their technical assistance at Condobolin. Thanks to Neroli Graham for multi-year biometric analysis.
References
Pitts N, Cameron A, Xia C and Hughes, N. December 2017 ‘Australian grains outlook for 2017-18 and industry productivity.’ Australian bureau of agricultural and resource economics and sciences.
Contact details
David Burch
david.burch@dpi.nsw.gov.au
GRDC Project Code: DAN00173,
Was this page helpful?
YOUR FEEDBACK