Comparing canola and lupin varieties by time of sowing in the Northern Agricultural Region
Author: Martin Harries and Greg Shea, DPIRD | Date: 26 Feb 2018
Key Messages
- Lupin yielded 3.0 t/ha and canola 2.0 t/ha from late May emergence.
- Lupin gross margins were competitive with canola, and lupin gave the highest return on investment.
- For both lupin and canola variety selection was important, in particular Jurien lupin performed well from all sowing dates.
Aims
- To see if matching canola and lupin variety maturity to sowing time would increase yields.
- To compare the time of sowing response of canola and narrow leaf lupin.
Background
There is considerable interest in sowing canola early to maximise yield and minimise the risk of missing a sowing opportunity. Traditionally ANZAC day marked the date on which growers would start dry seeding. However, now growers in the Northern Agricultural Region are routinely sowing in Mid-April and are prepared to sow around the first week of April if there is rain at that time. There are also questions about sowing in March but there is little data for canola and no data for lupins.
Initially the purpose of this trial was to test very early/March sowing however, due to the late break to the season this was not possible. Instead this trial compares lupins and canola which have emerged in late May and late June.
Method
A small plot trial (plots 18m by 1.54m) was conducted at Eradu, 50km east of Geraldton. Treatments included 10 varieties (5 canola and 5 narrow leaf lupin) and three sowing times (TOS) (April 11 dry, May 5 dry and May 25).
The varieties included a range of season lengths: Canola - Pioneer 43Y23 RR (Early), GT50 (Mid), GT 53 (Mid), Hyola 600RR (Long), Hyola 725RT (V.long), and lupin varieties - Mandelup (Early), Jurien (Early), PBA Barlock (Early/Mid), Tanjil (Mid), and Danja (Long).
The trial was designed such that species (canola/lupin) and TOS were blocked to enable trial management. Varieties were randomised within these blocks and there were 4 replicates of each treatment. Measurements included plant density, ground cover, plant biomass, weed density, flowering dates, seed yield and seed quality.
Results
Seasonal conditions
Annual rainfall up to October 31 at the site was 256mm, with 181mm recorded from sowing to maturity (Table 1). This compares to a long term yearly average for Eradu of 370mm annual and 294mm May to October inclusive.
Seeding rains did not come until the third week of May hence the initial aim of the trial, to assess yield from very early emergence was unable to be tested. After the third week in May there were a further 4 weeks of dry weather prior to the next opportunity to sow. Conditions over the grain fill period (August – September) were very mild.
Table 1. 2017 monthly rainfall (mm) from BOM Eradu station (8200).
Site | Jan | Feb | Mar | Apr | May | Jun | Jul | Aug | Sep | Oct | Nov | Dec | Annual | GS |
|---|---|---|---|---|---|---|---|---|---|---|---|---|---|---|
Eradu | 43 | 28 | 3 | 0 | 17 | 20 | 36 | 78 | 31 | 7 | 8 | - | 271 | 188 |
Establishment
In an attempt to create sowing time differences and have plants emerge as early as possible TOS1 was planted dry on April 11. TOS2 was planted on May 5, again this was into dry soil. As expected both of these two planting dates established on the same rain events, which occurred in the
third and fourth week of May. The third time of sowing treatment was sown into marginal moisture on May 27.
Density averaged over all treatments was 27 plants/m2. Lupins averaged 29 plants/m2 and Canola 25 plants/m2, both much lower than the targeted 50 plants/m2 and 40 plants /m2 respectively. Plant density differed for each sowing time (P <0.001). Each sowing date resulted in different plant densities, (P <0.001); sowing time 2 the highest density and sowing time 3 the lowest (Table 2).
There was a species by sowing time interaction (P <0.001) with the canola sown at time 3 establishing poorly compared to the lupins. This occurred because conditions were dry after sowing and the top centimetre of the soil, in which canola was sown, dried rapidly whereas lupins were sown deeper at 5 cm. This was apparent at the end of June when lupins from TOS3 were well established and the canola was not.
Field establishment
The same number of viable seed were sown in each plot, 1772 seed for canola and 2215 seed for lupins. A field establishment rate of 70% for lupin and 65% for canola was used to calculate seeding rates. The actual field
establishment rate obtained was much lower; Lupins averaged more than canola at 34% compared to Canola 30%, (P <0.05).Overall there was a wide range from 15 to 47%, as would be expected given the difficult establishment conditions. As with plant density there were significant differences between species (P <0.05) and TOS (P <0.001). The same species by sowing time interaction also occurred (P <0.001) (Table 2). It should be noted that field establishment for seed sown on April 11, which was in the ground for 40 days prior to rain, averaged 32%, only 8% less than TOS2.
Table 2. Plant density (plants/m2) and field establishment (%), in parenthesis.
Variety
| |||||||||||
|---|---|---|---|---|---|---|---|---|---|---|---|
TOS | 43Y23 RR | GT50 | GT53 | Hyola 600RR | Hyola 725RT | Barlock | Danja | Jurien | Mandelup | Tanjil | TOS Av. |
1 | 30 | 25 | 25 | 26 | 27 | 21 | 29 | 31 | 28 | 24 | 27 |
2 | 34 | 31 | 37 | 31 | 36 | 29 | 33 | 37 | 32 | 38 | 34 |
3 | 11 | 17 | 14 | 14 | 12 | 27 | 25 | 28 | 27 | 27 | 20 |
Plant growth
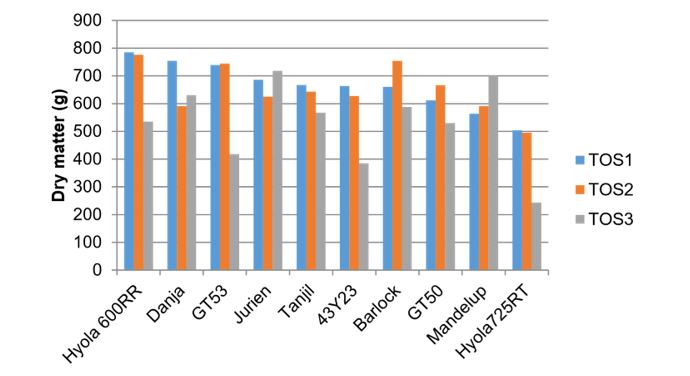
Dry matter averaged over all treatments was 616 g/m2, when measured on October 2. Lupins averaged 652 g/m2 and Canola 582 g/m2, a significant difference (P <0.001). Dry matter production was not significantly different for TOS 1 and 2, which is not surprising given they emerged at the same time. Dry matter production from TOS3 was significantly lower, (P <0.001) approximately 80% of TOS1 or 2. This was caused by a reduction in canola biomass from TOS3. The very low plant density of canola from TOS3 would have contributed to this. Consequently there was a species by time of sowing interaction; lupin biomass significantly greater than canola at TOS3 but not at TOS1 or 2 (Figure 1).
Figure 1. Plant biomass (g/m²) as of October 2
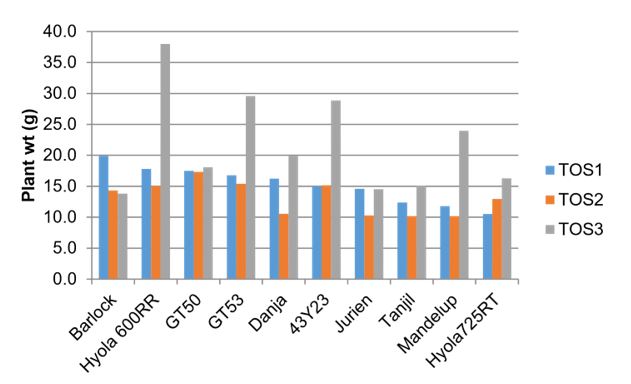
Canola plants were heavier than lupins (P <0.001) and plants from TOS3 were heavier than from the other sowing times (P <0.001). There was a species by sowing time response (P <0.05) canola plants heavier than lupin at TOS3. This could be related to the very low canola plant density at TOS3 and less intraspecific competition (Figure 2).
Figure 2. Single plant weight (g/plant) as of October 2.
Yield
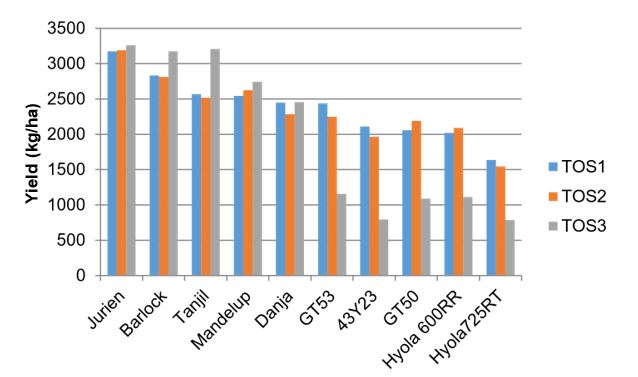
Lupins yielded more than canola (P <0.001) 2789 kg/ha compared to 1683 kg/ha. Yield from TOS1 and 2 were not significantly different for either lupin or canola, as would be expected considering they emerged at the same time. Averaged across all varieties lupins yielded similarly from all sowing times - 2714 kg/ha from TOS1, 2686 kg/ha TOS2 and 2968 kg/ha TOS3.
The result is unusual within the Northern Agricultural Region where delays in crop establishment after early May almost always result in a yield penalty. It is likely the atypical season in 2017, with good stored soil moisture from rain in January and February a higher than average rainfall in August and mild September and October conditions with 11 rain days in September resulted in similar conditions for growth, podding and seed fill for all times of sowing. There was a significant difference in lupin variety yield (P <0.001) with the newer varieties, Jurien and Barlock yielding more than Tanjil and Mandelup, with the 1986 released variety Danja yielding lower than all other varieties.
Yield averaged across all canola varieties was 2053 kg/ha from TOS1, 2009 kg/ha TOS2 and 987 kg/ha TOS3. This was a significant difference across the sowing times (P <0.001). As noted above the TOS3 canola established very poorly and it was mid to late July before plants started to grow well. Hence there was approximately a month difference in establishment from TOS1&2 to TOS3 and a yield loss of approximately 34 kg/ha/day. There was difference in varieties (P <0.001). GT53 was the highest yielding variety and Pioneer 43Y23 RR and Hyola 725RT yielded significantly less than all the other varieties.
Figure 3. Yield of variety when sown on April 11 (TOS1), May 3 (TOS2) and May 25 (TOS3)
Seed quality
Seed weight of both lupin and canola was greater at TOS3 compared to the other two sowing times by 5 and 15% respectively. There was significant variation among the varieties; Jurien was the heaviest seed of the lupins and the later season Hyola 600RR and Hyola 725RT had heavier seed than the other canola varieties.
Canola oil concentration averaged over all varieties was 44.9% for TOS1, 45.3% TOS2 and 40.8% TOS3. This was a significant reduction (P <0.001) at TOS3. The varieties did differ in oil concentration (P <0.001), longer season varieties had the highest oil with a range from 41.6% (Pioneer 43Y23 RR) to 45.3% (Hyola 600RR).
Lupin protein was low, averaging 29% and did not change significantly with sowing time. There was little difference between varieties with a range of 28.8% to 31.1%.
Gross margin
There was a large range in gross margin from -$74/ha to $837/ha. Canola was the most profitable species from sowing times 1 and 2 however low yields at TOS 3 meant it was much less profitable than lupins from this sowing time. Return on investment was highest for lupin due to lower input costs. The later released lupin varieties were more profitable, in particular Jurien performed well from all sowing dates.
Table 3. Total costs ($/ha), yield (t/ha), income ($/ha), gross margin ($/ha) and return on investment ($/input$)
Variety | TOS | Tot cost | Yield | Income | Gross margin | Return on investment | |
|---|---|---|---|---|---|---|---|
GT53 | 1 | $473 | 2.4 | $1,310 | $837 | $1.77 | |
GT50 | 2 | $466 | 2.2 | $1,233 | $767 | $1.64 | |
GT53 | 2 | $473 | 2.2 | $1,208 | $735 | $1.55 | |
Jurien | 3 | $260 | 3.3 | $961 | $701 | $2.70 | |
Tanjil | 3 | $260 | 3.2 | $946 | $686 | $2.64 | |
Jurien | 2 | $260 | 3.2 | $941 | $681 | $2.62 | |
GT50 | 1 | $466 | 2.1 | $1,145 | $679 | $1.46 | |
Jurien | 1 | $260 | 3.2 | $937 | $677 | $2.60 | |
Barlock | 3 | $260 | 3.2 | $936 | $676 | $2.60 | |
Hyola 600RR | 2 | $464 | 2.1 | $1,123 | $659 | $1.42 | |
Pioneer 43Y23 | 1 | $485 | 2.1 | $1,136 | $652 | $1.34 | |
Hyola 600RR | 1 | $464 | 2.0 | $1,085 | $621 | $1.34 | |
Pioneer 43Y23 | 2 | $485 | 2.0 | $1,069 | $584 | $1.21 | |
Barlock | 1 | $260 | 2.8 | $836 | $576 | $2.21 | |
Barlock | 2 | $260 | 2.8 | $830 | $570 | $2.19 | |
Mandelup | 3 | $260 | 2.7 | $809 | $549 | $2.11 | |
Mandelup | 2 | $260 | 2.6 | $774 | $514 | $1.98 | |
Tanjil | 1 | $260 | 2.6 | $757 | $497 | $1.91 | |
Mandelup | 1 | $260 | 2.5 | $750 | $490 | $1.89 | |
Tanjil | 2 | $260 | 2.5 | $743 | $483 | $1.86 | |
Danja | 3 | $260 | 2.5 | $725 | $465 | $1.79 | |
Danja | 1 | $260 | 2.5 | $723 | $463 | $1.78 | |
Hyola 725RT | 1 | $464 | 1.6 | $879 | $415 | $0.89 | |
Danja | 2 | $260 | 2.3 | $674 | $414 | $1.59 | |
Hyola 725RT | 2 | $464 | 1.5 | $829 | $365 | $0.79 | |
GT53 | 3 | $473 | 1.2 | $620 | $147 | $0.31 | |
Hyola 600RR | 3 | $464 | 1.1 | $598 | $134 | $0.29 | |
GT50 | 3 | $466 | 1.1 | $584 | $117 | $0.25 | |
Hyola 725RT | 3 | $464 | 0.8 | $422 | -$42 | -$0.09 | |
Pioneer 43Y23 | 3 | $485 | 0.8 | $410 | -$74 | -$0.15 | |
Grain price based = $537 canola + oil bonus and $295 lupin
Conclusion
The results of this trial are atypical of time of sowing responses observed in the Northern Agricultural Region. They highlight how important spring conditions and stored soil moisture are in determining the productivity of late emerging crops.Both lupin and canola were profitable from the first two sowing dates and it was interesting to note that lupins gave the highest return on investment.
Acknowledgments
Thanks to Stephanie Boyce and the Geraldton RSU for trial management and measurements and Bruce Ley for supplying the site.
Varieties displaying this symbol beside them are protected under the Plant Breeders Rights Act 1994.
GRDC Project Number: DAW00227
Paper reviewed by: Adriano Rossi and Mark Seymour
GRDC Project Code: DAW00227,
Was this page helpful?
YOUR FEEDBACK


