A decision tool to estimate the economic benefits from soil amelioration at a paddock and industry scale
Author: Elizabeth Petersen, Jeremy Lemon and Vilaphonh Xayavong, Department of Primary Industries and Regional Development | Date: 27 Feb 2018
Key Messages
- A new decision tool called ROSA (Ranking Options for Soil Amelioration) can be used by agronomists / consultants / growers to help understand the most cost-effective way to spend a limited budget on soil amelioration.
- Using ROSA, we estimate that the indicative value of lost grain production due to soil constraints is, on average, $330/ha costing the grain industry approximately $4.3billion/year. This equates to approximately half the mediumterm gross average annual value of grain production in Western Australia.
- Using the most cost-effective combination of soil amelioration options currently available to address these constraints, we estimate that ameliorating these soil constraints will cost growers approximately $41/ha/year with a benefit of $124/ha/year (annualised values). This has a benefit cost ratio of 3:1 and a net benefit of $84/ha/year or $1billion/year across the grain-growing regions of Western Australia.
Aim
To use ROSA to provide an indicative estimate the value of lost grain production due to soil constraints in Western Australia, and the value of soil amelioration.
Method
ROSA is intended for use by agronomists, consultants and farmers to provide a return on investment ranking of soil amelioration options that address one or more soil constraints within a farm business. Costs and benefits of individual amelioration options, as well as the different combinations of soil amelioration options, are accrued at different points in time over a 10-year period. The return to investment is based on comparing a Benefit Cost Ratio (the ratio of benefits over costs that have been discounted over time) for each soil amelioration option or combination of options. The Benefit Cost Ratio (BCR) represents the dollar return for each dollar spent - the bang for the buck. A BCR greater than one indicates a positive return to investment. The higher the BCR the better the return to investment.
ROSA include 5 soil constraints, 7 single soil amelioration options, and 15 combinations of soil amelioration options, as shown in Table 1. Average levels of each soil constraint for the eight soil types represented within ROSA are shown in Table 2. Soil properties differ significantly within soil types across the state. Soil properties provided in Table 2 show average soil properties by soil type. Users have flexibility to change these default levels within ROSA to reflect their local conditions. Yield responses and costs associated with amelioration options and their combinations depend on these soil properties and region. ROSA includes the nine Ag Soil Zones in grain-growing regions of Western Australia.[1] Default yield responses and costs are contained within ROSA using average data gathered from experts. These can be changed by users to reflect local responses and costs.
Results
ROSA is applied in this paper to generate indicative estimates of (1) the value of lost production due to soil constraints in cropping regions of Western Australia, and (2) the indicative value of soil amelioration.
Estimating the indicative value of lost production from soil constraints
The indicative value of lost production in Western Australia from soil constraints is estimated by calculating the gap, for each crop type, between actual yield (in the presence of soil constraints) and potential yield (in the absence of soil constraints considered within ROSA). This yield gap is multiplied by farm-gate price and the estimated average area sown to each crop type by Ag Soil Zone. Farm-gate prices are 5-year averages from AGSURF rounded to the nearest $10 minus cartage, grading and levies of $30/ha. They are $290/t, $240/t, $520/t and $290/t for wheat, barley, canola and lupins, respectively. Area of crop type sown annually is calculated from effective farm areas sown to each crop by Zone (7-year average data from Planfarm Bankwest Benchmarks 2008/09 - 2014/15) and the total area of each Ag Soil Zone (van Gool 2015)[2] (Table 3).
Table 1: Soil constraints and associated amelioration options considered within ROSA
| Single soil amelioration options | Acidity: topsoil | Acidity: subsoil | Soil constraints | Soil structure decline | |
|---|---|---|---|---|---|
| Non- wetting | Subsoil compaction | ||||
Claying (C)* | - | - | ✓ | - | - |
Deep ripping (> approx 40cm) (DR) | - | - | - | ✓ | - |
Gypsum (G) | - | - | - | - | ✓ |
Liming to address topsoil acidity (Lt) | ✓ | - | - | - | - |
Liming to address subsoil acidity (Ls)* | ✓ | ✓ | - | - | - |
Soil mixing (< approx 40cm) (SM) | - | - | ✓ | - | - |
Wetting agents (WA) | - | - | ✓ | - | - |
| Multiple soil amelioration options | Acidity: topsoil | Acidity: subsoil | Soil constraints | Soil structure decline | |
| Non- wetting | Subsoil compaction | ||||
C and DR | - | - | ✓ | ✓ | - |
C and SM | - | - | ✓ | - | - |
DR and G | - | - | - | ✓ | ✓ |
DR and Ls | ✓ | ✓ | - | ✓ | - |
DR and SM | - | - | ✓ | ✓ | - |
DR and WA | - | - | ✓ | ✓ | - |
G and Lt | ✓ | - | - | - | ✓ |
Ls and SM | ✓ | ✓ | ✓ | - | - |
Lt and WA | ✓ | - | ✓ | - | - |
C, DR and Ls | ✓ | ✓ | ✓ | ✓ | - |
C, DR and SM | - | - | ✓ | ✓ | - |
C, Ls and SM | ✓ | ✓ | ✓ | - | - |
DR, G and Ls | ✓ | ✓ | - | ✓ | ✓ |
DR, Ls and SM | ✓ | ✓ | ✓ | ✓ | - |
DR, Ls and WA | ✓ | ✓ | ✓ | ✓ | - |
* Claying and liming to address subsoil acidity are listed as single soil amelioration options, but they are not considered in ROSA without soil mixing or deep ripping.
Table 2: Average soil properties for each soil type
Soil type | Nonwetting | Acidity: topsoil | Acidity: subsoil | Soil structure decline | Subsoil compaction | Related MySoils |
|---|---|---|---|---|---|---|
Alkaline shallow duplexes | Moderate | 5.0 | 8.0 | Moderate | Moderate | Alkaline shallow duplexes |
Calcareous loamy earths | Low | 7.0 | 9.0 | Moderate | Moderate | Calcareous loamy earths |
Clays and shallow loamy duplexes | Low | 5.2 | 5.5 | High | Low | Clays and shallow loamy duplexes |
Deep loamy duplexes and earths | Low | 5.2 | 5.0 | Low | Moderate | Deep loamy duplexes and earths |
Deep sandy duplexes | High | 4.8 | 4.5 | Low | High | Deep sandy duplexes, sandy earths |
Ironstone gravels | High | 4.8 | 4.7 | Low | Moderate | Ironstone gravelly soils, stony soils |
Sands | High | 4.8 | 4.5 | Low | High | Coloured sands, pale sands |
Shallow sandy duplexes | Moderate | 4.8 | 4.8 | Low | Moderate | Shallow sandy duplexes |
Source: Author estimates
Water-constrained potential yield is estimated using French and Schultz (1984) equations with adaptions suggested by Oliver et al. (2009)[3]. Soil constraints are not the sole cause of the yield gap between current and potential yields. Other causes include nutritional and management deficiencies and soil or fertility constraints not included in ROSA. To account for this, the yield potential is multiplied by a factor that indicates the proportion of potential yield attainable by applying soil ameliorants considered in ROSA (Table 4).
Table 3: Estimated are of each crop type sown annually by Ag Soil Zone
Ag Soil Zone | Wheat | Barley | Canola | Legumes | Total |
|---|---|---|---|---|---|
Mid West | 0.6 | 0.1 | 0.2 | 0.3 | 1.1 |
Mullewa to Morawa | 0.5 | 0.1 | 0.1 | 0.1 | 0.8 |
West Midlands | 0.3 | 0.1 | 0.1 | 0.1 | 0.7 |
Central-Northern Wheatbelt | 2.8 | 0.5 | 0.5 | 0.2 | 4.1 |
East Moora to Kojonup | 0.8 | 0.4 | 0.3 | 0.1 | 1.7 |
Southern Wheatbelt | 1.2 | 0.6 | 0.4 | 0.2 | 2.3 |
Stirlings to Ravensthorpe | 0.2 | 0.1 | 0.1 | 0.0 | 0.5 |
South Coast | 0.4 | 0.3 | 0.3 | 0.1 | 1.1 |
Salmon Gums Mallee | 0.3 | 0.2 | 0.1 | 0.0 | 0.6 |
Total | 7.0 | 2.3 | 2.3 | 1.3 | 12.8 |
Note: Area of crop type sown annually is calculated from effective farm areas sown to each crop by Zone (7-year average data from Planfarm Bankwest Benchmarks 2008/09 - 2014/15) and the total area of each Ag Soil Zone (van Gool 2015)
Table 4: Percentage of potential yield attainable by soil ameliorants considered in ROSA
Soil type | Percentage of potential yield |
|---|---|
Alkaline shallow duplexes | 95% |
Calcareous loamy earths | 45% |
Clays and shallow loamy duplexes | 80% |
Deep loamy duplexes and earths | 95% |
Deep sandy duplexes | 90% |
Ironstone gravels | 90% |
Sands | 70% |
Shallow sandy duplexes | 95% |
Source: Authors’ estimates
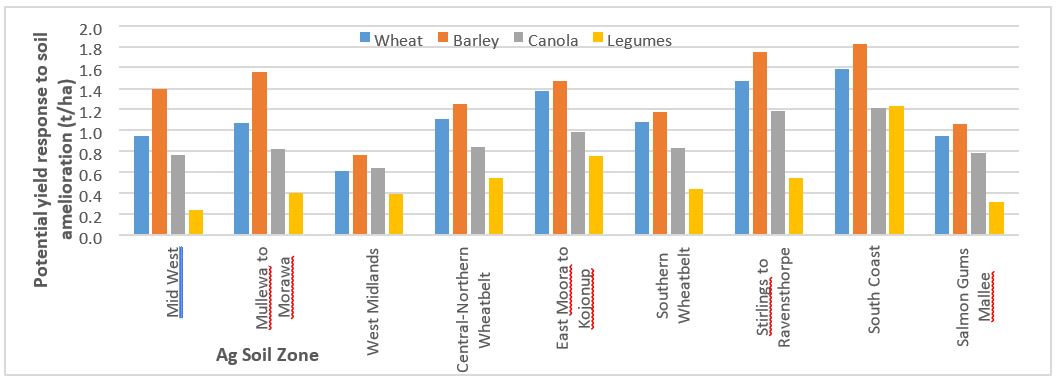
The estimated indicative yield gap between water-constrained potential yield with soil amelioration and actual yields are presented for each crop and each Ag Soil Zone in Figure 1. These indicative estimates suggest that the soil constraints considered in ROSA have the greatest impact on yield on the South Coast, and the least impact in the West Midlands.
Figure 1: Indicative potential yield responses (t/ha) to soil amelioration by crop type and Ag Soil Zone (potential yields3 multiplied by factors shown in Table 4 minus actual yields4)
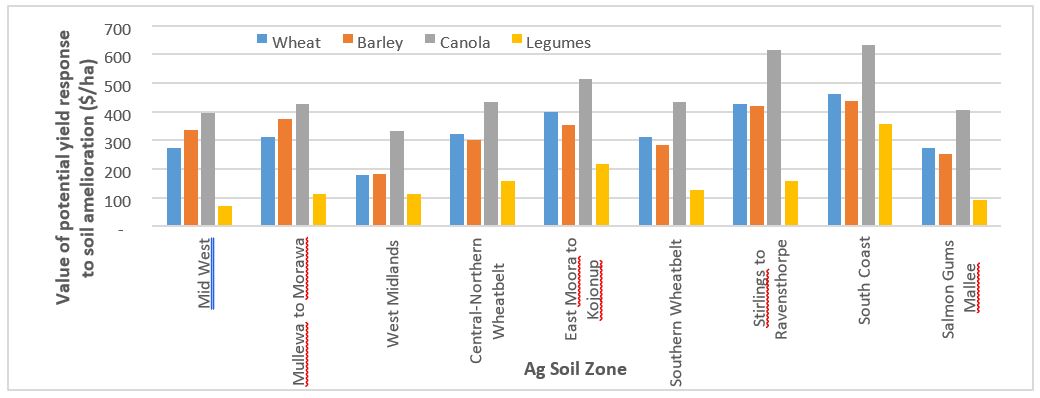
The indicative value of lost production due to soil constraints is estimated to be the indicative yield gap (Figure 1; expressed in t/ha) multiplied by farm-gate price. This is presented in Figure 2 by crop and Ag Soil Zone.
Figure 2: Estimated value of potential yield response ($/ha) to soil amelioration due to soil constraints by crop type and Ag Soil Zone (Yield gap multiplied by farmgate price)
The estimated indicative value of lost production due to soil constraints by crop type and Ag Soil Zone is multiplied by the estimated areas of each crop type sown annually in each Ag Soil Zone to provide an estimate of the losses from soil constraints by Ag Soil Zone (Table 5). It is estimated that the indicative losses from soil constraints in the cropping zone of Western Australia is in the order of $4.3billion/year, dominated by losses in the Central-Northern Wheatbelt (the largest Ag Soil Zone by area).
We estimate that the 7-year average gross value of crop production in Western Australia is approximately 7.5million. Hence, the indicative value of lost production is just over half the current gross value of the crop. The weighted average loss from soil constraints is estimated to be $330/ha on a state-wide basis, with the South Coast being the Ag Soil Zone with the highest weighted average loss at approximately $490/ha. This is due to the higher yield potential in this Ag Soil Zone due to higher rainfall compared with other Zones.
Table 5: Estimated value of losses from soil constraints by Ag Soil Zone
Ag Soil Zone | Value of losses due to soil constraints | % of loss by | Weighted average loss |
|---|---|---|---|
Mid West | 0.3 | 7 | 250 |
Mullewa to Morawa | 0.2 | 5 | 300 |
West Midlands | 0.1 | 3 | 200 |
Central-Northern Wheatbelt | 1.3 | 31 | 320 |
East Moora to Kojonup | 0.7 | 15 | 400 |
Southern Wheatbelt | 0.7 | 17 | 310 |
Stirlings to Ravensthorpe | 0.2 | 5 | 450 |
South Coast | 0.5 | 12 | 490 |
Salmon Gums Mallee | 0.2 | 4 | 280 |
Total | 4.3 | 100 | 330 (weighted average) |
Estimating the indicative value of soil amelioration
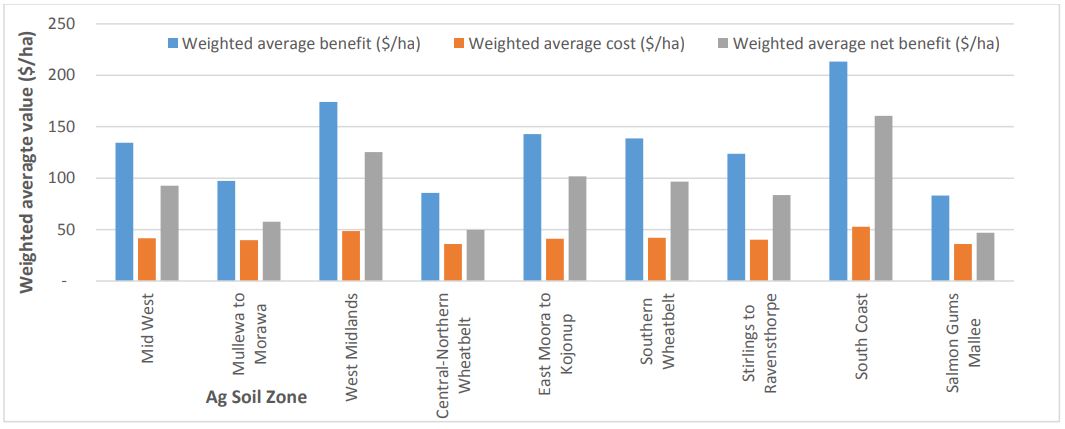
The indicative value of soil amelioration is estimated by using ROSA to (1) identify the amelioration option, or set of options, that addresses all soil constraints for a given crop type and soil type, and (2) estimate the associated gross benefit, cost and net benefit. The proportion of each soil type and crop grown in each Ag Soil Zone is used to calculate the weighted average benefit, cost and net benefit of soil amelioration for each Zone as shown in Figure 3.
These results are multiplied by the cropping area of each Ag Soil Zone to provide indicative estimates of the value of soil amelioration for grain production in Western Australia (Table 6). It is estimated that the annualised gross benefit of ameliorating soil constraints is approximately $124/ha/year with an associated cost of $41/ha/year. This is an annualised net benefit of $84/ha/year. The benefit cost ratio is 3, indicating that for every dollar spent on soil amelioration, a grower receives approximately 3 dollars in return. Across all grain-growing regions in Western Australia, this leads to total benefits of $1.6billion/year at a cost of $520million/year for a net benefit of approximately $1billion/year.
Figure 3: Estimated indicative weighted average value of amelioration of soil constraints by crop type and Ag Soil Zone ($/ha) (within Zones, losses due to constraints are a weighted average for each crop type and response to amelioration by area) Source: ROSA modelling results
Table 6: Benefits and costs of most profitable soil amelioration option(s), weighted by crop, soil type and Ag Soil Zone for the Western Australian grainbelt
| Benefits and costs | Weighted value |
|---|---|
Weighted average benefit ($/ha/year) | 124 |
Weighted average cost ($/ha/year) | 41 |
Weighted average net benefit ($/ha/year) | 84 |
Weighted average benefit cost ratio | 3.0 |
Weighted average benefit ($million/year) | 1,594 |
Weighted average cost ($million/year) | 521 |
Weighted average net benefit ($million/year) | 1,073 |
Conclusion
A new decision tool called ROSA (Ranking Options for Soil Amelioration) has been developed for intended use by consultants, agronomists and growers, to rank soil amelioration options based on their cost-effectiveness. It is applied in this paper to provide indicative estimates of the value of lost grain production due to soil constraints in Western Australia and the value of soil amelioration. It is estimated that the indicative value of lost grain production due to soil constraints is, on average, $330/ha costing the Western Australian grain industry approximately $4.3billion/year. This is approximately half the State’s gross average annual value of crop production.
Using the most cost-effective combination of soil amelioration options currently available to address soil constraints, it is estimated that the annualised cost of soil amelioration is approximately $41/ha/year with an annualised benefit of $124/ha/year. This provides an estimated annualised net benefit of $84/ha/year or about $1billion/year across the grain-growing regions of Western Australia.
Acknowledgements
The research undertaken as part of this project is made possible by the significant contributions of growers through both trial cooperation and GRDC investment as part of GRDC’s Soil Constraints West group of projects, the authors would like to thank them for their continued support. Sincere thanks also go to DPIRD for contributing funding and resources.
This paper has been reviewed and is approved by Chris Gazey, Soil Productivity Portfolio Manager
GRDC Project Numbers: DAW00242, DAW00244, DAW00252
Was this page helpful?
YOUR FEEDBACK


