Nutrition for crops after low yielding seasons – assessing soil stores and input decisions for best returns based on field trial data
Author: Nutrition for crops after low yielding seasons – assessing soil stores and input decisions for best returns based on field trial data | Date: 27 Feb 2018
Key messages
- Residual nutrients are difficult to ascertain at modern crop input rates on many soils and make relatively low contributions to yield in comparison to new season applications.
- Soil testing and analysis is important to identify responsiveness but benchmark values are not “critical” as their name suggests and require careful consideration.
- There is false economy in cutting back or neglecting nutrients at sowing, especially P for cost saving or shifting to in-season N spending.
- Rather than only adding to the cost side of the equation, additional nutrition improves the productivity and profit gains from soil amelioration.
Aims
- Assess the value of soil nutrient stores to crops with or without additional fertiliser application in field trials.
- Provide Growers with robust data to assist decision making on the most appropriate fertiliser rates to optimise productivity and maximise profit.
Background
For a large portion of the WA Wheatbelt, getting crops away in 2017 was a challenge. While late season rains salvaged the year for some growers, inevitably, questions arise about residual nutrients after a season with conditions that dramatically limited yield potential.
In making decisions for supplying nutrients to crops following low yields, there is a tendency to budget for decreases in seeding fertiliser application to very low rates or even nil. This approach has been endorsed by broad scale overviews of some large and long-timescale soil test datasets variably associated with field trial crop growth data across a longer timescale. We have taken a fresh view of this data and present a compilation of recent field trials with directly related soil data, providing evidence that more careful consideration of seeding fertiliser rates be made to prevent growers from missing greater attainable profit.
Method
This paper reviews a body of field research trials pertinent to grower decisions on fertiliser rates and applications. While largely confined to trials in the eastern Wheatbelt we also reference data from trials in other regions where the relevance to profitable decision making is appropriate and transferrable.
Summit Fertilizers established a series of fully replicated, randomised trials in and near the eastern agricultural zone covering a range of seasonal conditions between 2010 and 2017. While designs have varied with site yield potential, they generally incorporate a factorial design of a minimum of four nitrogen (N) and four phosphorus (P) rates ranging from zero to in excess of adequate requirement for maximum yield potential.
Typically, N up to 75kg/ha and P up to 24 kg/ha. In recent seasons, an additional factor of potassium (K) up to 25 kg/ha has been included in select trials. Site selection included comprehensive soil tests of top and subsoils. Collection of harvest yield data and grain quality analysis allowed the assessment of gross margin returns attributable to fertiliser application - gross margin quoted as grain value minus fertiliser retail cost at March of the corresponding year.
Results and discussion
Phosphorus decisions from soil tests
Phosphorus has low mobility in many soils. It is removed by plant uptake, grain harvest or hay cutting and grazing. However, if yields are low due to drought or other factors, how much P not exported by production can be considered readily available in subsequent seasons? The answer can be complex due to the varying forms and solubility of added P that has become “fixed” to varying degrees. This depends on many factors such as soil composition, temperature, moisture and mineralisation from organic matter, and aspects of soil chemistry such as pH will have a strong influence.
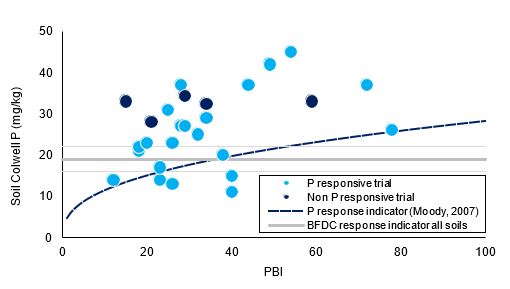
Figure 1. Summit’s cereal N x P rate field trials in the eastern Wheatbelt 2012-2017 were overwhelmingly responsive to P, even when soil tests showed P levels higher than published indicators of P response (Moody, 2007; Watmuff, et al., 2013)
Nutrient balance calculations have shown that P uptake can be as low as 10% of P applied or as high as 90%. It is also well known that availability of applied P decreases over time in soil (Devine, et al., 1968; Barrow, 1980). This is a part of the reason fresh P placed directly in the path of growing roots at seeding is beneficial. Hence, cropping practice has almost universally shifted from topdressing methods to drilled or banded P.
In 2016 we detailed an example of how producing a valid P calibration curve for the eastern Wheatbelt using the Better Fertiliser Decisions for Cropping Systems (BFDC) Interrogator (Watmuff, et al., 2013) - satisfying the robust statistical requirements - required significant filtering of data. Results indicated a soil Colwell P test of 19 mg/kg would be adequate for 90% maximum wheat yield in the eastern Wheatbelt (Gherardi, et al., 2016). Deeper interrogation of this database reveals that only 7 of these 31 P trials in the zone analysed were established after 1990.
Moody (2007) defined a relationship where wheat crops respond to P fertiliser at soil P levels varying with PBI (Figure 1). Reviews and assessments of large soil sample analysis datasets have used guidelines such as Moody’s to conclude that almost all cropping soils in the WA Wheatbelt can be allocated “optimal”, “excess” or “well in excess” P status and that P should be recommended on less than 20% of arable soils (Weaver & Summers, 2013; Wong, et al., 2012). Although caution was advised in determining paddock-level fertiliser strategies based on these findings, the soils overall were considered to have high P fertility with little need for further applications.
In contrast, Summit have extensive evidence from the past eight years of factorial N x P trials in the eastern Wheatbelt overwhelmingly showing significant cereal crop yield increases from P application. The yield increases were found in many cases where soil tests show Colwell P levels above indicators of minimal likely response (Figure 1). Even in low yielding seasons profit margin impacts were mostly neutral or better, rarely negative, and though not always significant the yield response showed the same pattern as higher yielding seasons. Substantial improvement in grower margins with seeding P application (e.g. Table 1) raises important questions about the appropriateness of historic nearmaximum production soil P level definitions to modern cropping system practices.
Areas of concern that may contribute to soil P classification and farm fertiliser recommendations inconsistent with the recent trial growth and yield information include:
- Variation in soil sampling practice and equipment between samples in a dataset, including a chance of a more significant impact of site bias in datasets than previously anticipated
- The evolving trend of increased sampling of subsoils and the adoption of these in interpretation of soil nutrient status as well as crop requirements
- Limitations of soil tests themselves. For example, is the single Colwell P test method the most appropriate reference for the spectrum of crops and soils being farmed or should tests such as DGT or others be more widely applied?
- Evolution of farming practices and fertiliser placement – such as with or below seed contrasting with historic broadcast to surface and incorporation by tillage, appropriate rates of N and split applications – and appropriate field trial practice to simulate this
- Nutrient budgeting on removal by the previous year’s crop limiting P applied to responsive sites
- Consideration of the spectrum of soil nutrients and chemistry, e.g. pH and PBI being prominent factors in any interpretation, yet PBI is approximated by best fit conversion of previous PRI values in old datasets
- Diminishing number of ongoing nutrient rate-response trial programs to ensure analysis and recommendations keep pace with developments in farming methods that lead to agronomic efficiencies and increasing yield potential.
Whatever the causes, the incongruence in data observations may well mean that current advice to farmers is leading to decisions and practices that are limiting yield potential and profitability. Summit’s field trial data strongly suggest there are yield gains and significant profit to be made by applying P at seeding on soil with Colwell P test levels greater than what some have termed “critical” values. Soil testing is very important as a management tool, hence the interpretation of these values in determining on which soils crops will be responsive to P requires more attention.
Value of residual P after low crop yields
In long-term trials at Yealering and Holt Rock, P between 0 and 30 kg/ha was applied annually for 5 years. In years 2011 and 2013, following low crop yields of 2010 and 2012, we continued to see a consistent growth response pattern. Significant increases in yield with increasing P rate applied (Figure 2, left) indicate the impact of any residual nutrient carryover was far outweighed by the application of fresh P at seeding. Notably, at both sites, withholding P in the 5th year decreased grain yield in all plots compared to continued seeding P application. This was regardless of rate and history of P applications (Figure 2, right). Certainly, rates commonly applied in modern cropping programs could not expect significant carryover impact. It was also notable that at both sites, the 12 kg/ha P treatments continually returned the highest gross margins (data not shown). The consistent trends through years and across different sites gives strong evidence that ongoing P supply provides the foundation for sustainable yields and returns.
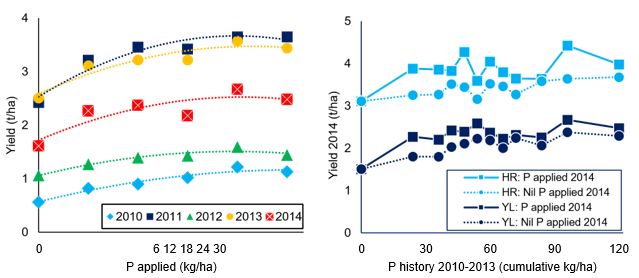
Figure 2. In long-term P trials, annual wheat yield responded to increasing P rates 2010 to 2014 at Yealering (left). Withholding P in a single year (right), even after high annual applications over 4 previous years, resulted in yield decreases at Holt Rock and Yealering sites.
Nitrogen
Since N is the nutrient most required by plants, N is vital for generating the tillers in cereals that set up yield potential, and plays essential roles during grain fill and protein production, it is required at all stages of crop growth and often seen as the main nutritional driver of high crop yields. However, in the nitrate form it is readily soluble and highly mobile. Hence, in most WA soils the season-to-season carryover of applied N is negligible.
With increased continuous cropping and the small annual area planted to legumes, organic sources of soil N are also generally running down, almost without exception in WA soils. Organic carbon levels below 0.5% are commonplace. Hence, mineralisation of N is usually not close to crop requirements and applied N fertiliser is almost a given in WA agriculture. With well-established relationships of total N requirement for target yields, most research focuses on timing of application.
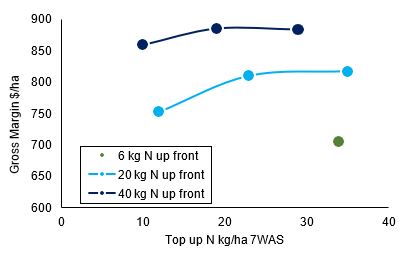
Figure 3. Nitrogen applied up front removed N as an early limit to wheat yield potential, decreased crop requirement for in-season N and improved returns, Binnu 2016.
Nitrogen timing
Timing of N applications has production and risk ramifications. It is not simple, with soil type, sowing time, season and weather variations all having an impact.
High rates of nutrient salts close to seed can affect germination. Some can also move freely away from the root zone with water flow. Conversely, in dry conditions mobile nutrients remain unavailable but can leach away rapidly with water at any time and, essentially, become a sunk cost. Therefore, applying a crop’s entire N requirement up-front, for example, may not be sensible or feasible.
Summit field trials reveal that cereal crops having received a reasonable dose of N at establishment are not exposed to N-limiting conditions during early growth. Comparatively, those receiving little or no N at seeding start to lose yield potential quickly and require larger in-season N inputs to maximise yields but may never reach the productivity or returns of crop with early N (Figure 3).
A split N application strategy allows flexibility, but growers need to be mindful that access to adequate N early generates the tillers and biomass that are the foundations of yield potential. Across a range of trials, we have found that rates of at least 20 kg N/ha at seeding is a highly effective way of managing N, accompanied by one or two followup applications to match crop requirement and potential as the season progresses. There are a number of tools available to assist in this decision.
Influence of phosphorus on cost-effectiveness of nitrogen
A key role of P in plants is within the molecules needed for energy transfer. Limited P means limited ability to store and transport energy that fuels all growth processes. One of the most significant outcomes of our factorial N x P trial series has been the consistent and overwhelming evidence that crops lacking in adequate P supply show impaired ability to respond to either simultaneous or subsequent applications of N (Figure 4).
Supporting this theory is the observation from plant tissue testing in these trials where foliar nitrate concentrations can be high in plants where N has been applied but no P (see Figure 5). That these plants never reach the yields of those receiving P applications suggests that nitrate uptake is occurring but the capacity of the plants to utilise it for growth is limited by the deficiency of P. In short, no matter how much N is applied and taken up by the plant intended for use in photosynthesis and protein generation, without the P-mediated energy transfer this N (and the dollars spent to supply it) will never be fully efficient.
Importantly, there is little chance to adequately rectify a P limiting situation after establishment. So P supply for crops needs to be set up at seeding. The key message from both long term and annual trials is that in spite of yearly growing season variations, for a harvestable cereal crop a strategy of fertilising with a P rate of 3 to 4 kg/ha for each tonne of grain yield being targeted consistently produces the greatest yields and returns. Such a crop can also support higher yields if pushed by N when seasons are favourable.
Table 1. Economics of decreasing phosphorus rates with the intention of making equivalent funds available for nitrogen application using field trial yield data for Calingiri wheat at South Bodallin, 2017.
Treatment | Equivalent Cost Treatment decrease P increase N | |||||||
|---|---|---|---|---|---|---|---|---|
P kg/ha | N kg/ha | Yield t/ha | Return $/ha# | P kg/ha | N kg/ha | Yield t/ha | Return $/ha# | Difference |
6 | 0 | 2.74 | $807 | 0 | 20 | 2.36 | $685 * | -$121/ha |
6 | 20 | 2.81 | $808 | 0 | 40 | 2.59 | $732 | -$76/ha |
6 | 40 | 3.01 | $845 | 0 | 60 | 2.56 | $697 | -$148/ha |
12 | 0 | 2.67 | $761 | 6 | 20 | 2.81 | $808 * | $46/ha |
12 | 20 | 2.75 | $766 | 6 | 40 | 3.01 | $845 | $79/ha |
12 | 40 | 3.23 | $893 | 6 | 60 | 2.56 | $859 | -$34/ha |
* 20 kg/ha of N was applied up-front so no delaying of P spend for opportunistic in-season N # Return = gross margin grain value minus fertiliser cost. Inclusive of 20 kg K/ha on all plots.
Economic case study P versus N
To address the issue of decreasing P to very low or even nil rates to minimise establishment costs and/or shifting these costs to an option of increasing N during the season, we must consider margins closely in addition to yield.
Consider a noodle wheat crop trial at South Bodallin in 2017 where soil Colwell P was 29 mg/kg (0-10 cm), 30 mg/kg
(10-20 cm) and 5 mg/kg (20-30 cm), PBI 27, 47, 63 and pH[Ca] 5.4, 4.3 and 4.3. Rates of P applied were 0, 6, 12 and 18 kg/ha and N 0, 20, 40 and 60 kg/ha with 40 and 60 kg/ha applied as split treatments – 20 kg/ha at seeding and the remainder at 6 weeks after sowing. Using January 2018 retail list prices, 1 kg of P as MAP costs $2.94 ex Kwinana and 1 kg N as urea costs $1.02 (or $1.25 as UAN). Hence, $17.42 for 6 kg/ha of P (as 26 kg MAP) would buy the equivalent of 17 kg/ha of N (as 37 kg urea). If we approximate 17 kg to the 20 kg portions used in the trial we can run some handy comparative economics of replacing P with N.
Rates of P and N applied, yields and gross margins are presented in Table 1 side-by-side with treatments of approximately similar fertiliser cost by shifting dollars spent on P to N. In all cases where no P is applied in favour of applying this money to N, the impact on margins is negative. Indeed, the comparison indicates only decreasing P from 12 to 6 kg/ha may have a positive impact on returns but the effect is not consistent in this trial.
The most pertinent point from this simple economic analysis is that decreasing P rates in order to save input costs can be false economy, potentially to the point of substantially penalising profit margins. The secondary take-home message reaffirms the recommendation that application rates of 3 to 4 kg/ha of P per tonne of cereal grain yield being targeted lays the foundation for optimal returns to be achieved by adjusting N in response to arising seasonal conditions.
Potassium
Since K is an inherent and proportionately large component of soil parent materials and having different soil supply mechanisms involving simple and complex cation exchanges, predicting K fertiliser responses can be difficult. Additionally, different plant physiology relationships whereby K is vital for metabolic and growth processes but, unlike all other nutrients, never becomes a structural component of plant cells mean source-sink and cycling processes also differ.
Despite a large number of field trials utilising K treatments, Summit Fertilizers have no definitive data that support a decision process for K application following a low yield season compared to a high yield season. Work continues in this regard with a strong focus on laboratory methods for measuring soil K relevant to crop growth responses.
Soil constraints and nutrient decisions
It was proposed by Weaver and Summers (2013) that overcoming constraints to crop and pasture production by applying required nutrients, such as K and S, or by applying lime to reduce soil acidity, provides conditions more likely to optimise production than applying more P. In 2017, a factorial N and P rate trial was established with Calingiri wheat at South Burracoppin in conjunction with Warakirri Farming on land that had received 1.5 t/ha limesand in January 2016 and was either immediately ripped to 30-35 cm deep or not ripped and cropped to canola.
In line with Weaver and Summers (2013), significant increase in wheat yield was seen two years post soil treatment due to improved soil conditions. However, in contrast with Weaver and Summers’ view, the increased yield potential from undertaking the soil amelioration operations was leveraged by application of P (Figure 4). By strategically choosing optimal fertiliser rates, which may mean increasing N and P to crops, the significant increases in production can lead to substantial improvement in profitability, improved efficiency of utilisation of applied nutrients even in a lower-than-average rainfall year and, importantly, a considerable decrease in the payback time for expensive amelioration operations (Table 2). The work of Warakirri Farming is demonstrating how a holistic approach to optimal production goals should consider supplementary nutrition, in combination with soil amelioration to provide improved agronomic outcomes.
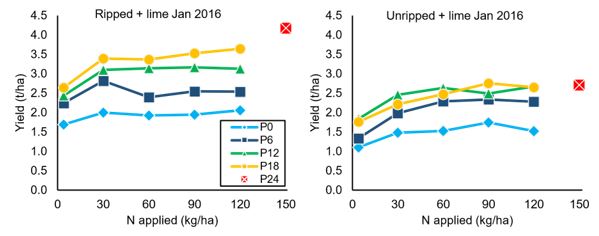
Figure 4. Increased Calingiri wheat yield potential from soil constraint amelioration is realised by increased nutrient application in a Decile 2-3 rainfall year at Burracoppin, 2017. Note both the high-end potential with high inputs and the low efficiency of N without adequate P.
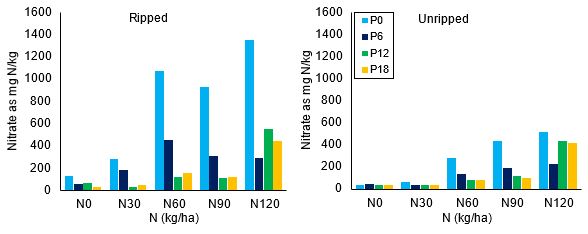
Figure 5. Wheat tissue nitrate analysis – whole tops at ~Z30 – demonstrates N uptake occurring but a poor ability to utilise this N when P supply is deficient. Notable is the much higher N in plants on ripped plots.
Table 2. Impact of 2017 fertiliser application and January 2016 soil amelioration on yield and returns from wheat at South Burracoppin.
Aspect | Yield or margin impact |
|---|---|
Fertiliser impact on unripped country | $34 - $184/ha |
Adding P+N increased returns over no fert | Up to $434/ha |
Max yield | 2.74 t/ha |
Fertiliser impact on deep ripped country | $150 - $230/ha |
Adding P+N increased returns over no fert | Up to $643/ha |
Max yield | 4.18 t/ha |
Deep ripping plus fertiliser impact | Additional $183/ha |
Adding P without N increased ripped return over unripped | Additional $186 - $282/ha |
Adding P + N increased ripped return over unripped | Up to additional $505/ha |
A complication with interpreting or anticipating crop responses to nutrient application after soil amelioration is the lack of understanding and quantification of the effect of soil disturbance on laboratory soil test values. General expectation of soil mixing is a decrease in most extractable nutrients simply by dilution. With the increasing incidence of deep cultivation operations on farms to address subsoil constraints, strategic research attention for better definition of soil analyses on these soils would be beneficial.
Conclusion
Fertiliser decisions for cropping should be based on yield targets and supported by soil testing. Decreasing establishment P rates may be applicable, but only if the appropriate benchmarks are used to interpret soil test results and rarely to zero as yield and profit penalties will occur. Local field trials based on up-to-date farming methods provide the best source of information to growers in assessing how responsive their crops may be.
Work continues on soil test methods and crop-nutrient responses for refining advice to growers. Trials through the eastern Wheatbelt point to 3 to 4 kg/ha of P at sowing per tonne of cereal grain being targeted, 20 kg/ha of N at sowing and managing additional N depending on seasonal conditions to be a consistent and effective strategy for optimising profit from nutrition. Potassium and other nutrients should be addressed much more on a case-by-case basis.
Acknowledgements
The trials referred to in this paper would not be possible without the many growers making their land available. There are too many to list here but extraordinary thanks is due to them for being fantastic co-operators. Occasional operational and harvest assistance from DPIRD, Kalyx and Living Farm field crews is also gratefully acknowledged.
References
Barrow, N. J., 1980. Evaluation and utilization of residual phosphorus in soils. In: F. E. Khasawneh, ed. The Role of Phosphorus in Agriculture. Madison, Wisconsin: American Society of Agronomy & Soil Science Society of America, pp. 333-410.
Devine, J. R., Gunary, D. & S, L., 1968. Availability of phosphate as affected by duration of fertiliser contact with soil. J. Agric. Sci., Volume 71, pp. 359-364.
Gherardi, M., Pol, E. & Marais, K., 2016. Phosphorus responses in the eastern wheat belt highlight challenges in applying critical soil phosphorus value interpretations. GIWA Research Updates, Perth, Western Australia.
Moody, P. W., 2007. Interpretation of a single-point P buffering index for adjusting critical levels of the Colwell P soil test. Australian Journal of Soil Research, Volume 45, pp. 55-62.
Watmuff, G., Reuter, D. J. & Speirs, S. D., 2013. Methodologies for assembling and interrogating N, P, K and S soil test calibrations for Australian cereal, oilseed and pulse crops. Crop & Pasture Science, Volume 64, pp. 424-434.
Weaver, D. M. & Summers, R. N., 2013. Nutrient status (phosphorus). In. Report card on sustainable natural resource use in agriculture, pp. Department of Agriculture and Food, Western Australia.
Wong, M. T. F., Grundy, M. J., Barson, M. & Walcott, J., 2012. A strategic framework to improve phosphorus management in the Australian grains industry, Canberra: CSIRO.
Reviewed by: Ryan Walker and Sean Mason
Was this page helpful?
YOUR FEEDBACK
