The value of water and the options if the temporary price rockets
Author: Rob Rendell (‘Fellow’ with RM Consulting Group Bendigo) | Date: 26 Jul 2018
Take home messages
- NSW General Security (GS) allocations determine water prices.
- It is what you do in the low water price years that counts.
- Determine your buy, sit and sell water price which is unique to your system.
- Short term decisions based on finishing what you have started, seasonal decisions based upon gross margin comparison with selling/buying water, and strategic decisions about infrastructure development and water ownership are based on longer term farm financial performance.
Background
Water is a key input to irrigated cropping systems and the availability and cost varies from year to year and within years. Irrigation farmers are required to make decisions around water purchases/sales on a temporary and permanent basis. Coupled with these decisions are decisions around investment in irrigation infrastructure. The following information is provided to assist farmers to make better decisions.
Available water
Table 1 summarises the available water and the price for different southern Murray Darling Basin climate scenarios, water allocation and use and price – post 2006.
Table 1. Available water (GL) and the price ($/ML) for different southern Murray Darling Basin climate scenarios, water allocation and use and price – post 2006.
Climate Scenario | Allocation level | Frequency | Total water allocated | Price -($/ML) | Comment | ||
|---|---|---|---|---|---|---|---|
Very Wet | Victorian Low security water available, 100% NSW GS | 3 | 6,200 | 5,300 | 20-50 | 50 | Carryover increased |
Wet | 90% NSW General Security | 2 | 5,400 | 5,000 | 65 | 70 | Rice expands |
Average | 55% NSW General Security | 2 | 4,300 | 4,000 | 125 | 130 | Rice sits on allocation |
Dry | 30% NSW General Security | 2 | 3,500 | 3,300 | 150-208 | 210 | Small rice crop as it sells to dairy/cotton |
Drought | 10% NSW GS, 80% NSW HS, and 50% Vic/SA high security | 3 | 2,100 | 1,700 | 300-680 | 600 | Horticulture minimises and cotton/dairy sell mostly, rice fails |
The ‘actual’ refers to what happened in those particular years, whereas the ‘projected’ refers to what would happen if those years were repeated today given the smaller size of the consumptive pool.
Industry use of water has changed
Horticulture (excluding almonds) has continued to slowly increase its water use over the last 50 years from 600GL in 1970 to around 800GL in 2015/16 (Figure 1) and is likely to continue to slowly increase to 900GL in the foreseeable future.
The next drought may limit perennial horticultural growth as horticultural demand is likely to be capped by the total water available on the market.
Almond’s water use has increased from almost nothing in 1999/00 to over 400GL in 2015/16 and is predicted to increase to over 600GL in the foreseeable future.
Since 2010, cotton has continued to replace rice in the Murrumbidgee region. Cotton currently uses 450GL and is expected to increase to up to 700GL in the foreseeable future.
Since peaking in the early 2000s, dairy has reduced its production and water use. This is shown in Figure 1 for the Goulburn Murray Irrigation District (GMID). Dairy is now estimated to use 1,000GL in the southern basin but is expected to reduce to 900GL on average in the foreseeable future.
")
Figure 1. Dairy production in the GMID (ML)
Rice production increased dramatically prior to 1999/00 reaching over 1.4 million tonnes in 2001. However, in recent times production has halved and now varies according to the climate scenario and allocations. This ranges from 0.2 million tonnes to 1 million tonnes (Figure 1). Rice water use now averages 650GL but ranges from 250GL to 1000GL per year.
 rice production over time (tonnes).")
Figure 2. Southern Murray Darling Basin (sMDB) rice production over time (tonnes)
Regional winners and loser
Some industries continue to expand and others decline as the water availability has reduced with the Basin Plan and irrigator’s behaviour has changed. Similarly, some regions have also expanded and others have declined.
In general terms since 1999/00 when water use across the basin was at its peak, it is observed that:
- SA Riverland region has maintained its overall water use.
- Victorian/NSW Mallee region has expanded its water use significantly.
- NSW Murrumbidgee has maintained its High Security (HS) water use but decreased its GS water use. BUT the decrease in water use has been offset by the expansion of cotton which uses less water per ha.
- NSW Murray Irrigation has significantly reduced its water use as the rice industry has declined.
- Victorian GMID area has significantly reduced its water use resulting in a large decline in the dairy industry. With 417GL of the buyback and farm efficiency HS entitlements coming directly from the GMID, and additional indirect back trade of water out of the GMID to other regions where water has been recovered, this has resulted in a 500GL reduction in water use in the GMID. This is almost half of the total reduction (1,169GL) in the sMDB consumptive pool in an average year.
- Over the last twenty years the GMID has had a net decline of 1,000GL/y (almost 50%), with half of this due to the Basin Plan and the other 500GL due to water trade, climate, carryover, new reserve policies and earlier water recovery initiatives such as the Living Murray.
The future estimated water use by industry in sMDB
Table 2. The new projected equilibrium (GL) in the sMDB based on current entitlements and no more recovery.
Sector | Drought | Dry | Average | Med-wet | Wet |
|---|---|---|---|---|---|
Mixed grazing | 121 | 286 | 316 | 416 | 474 |
Rice | 72 | 241 | 631 | 943 | 1,143 |
Cotton | 241 | 676 | 676 | 721 | 721 |
Other crops | 145 | 406 | 541 | 554 | 554 |
Dairy | 435 | 811 | 901 | 970 | 1,067 |
Horticulture | 1,400 | 1,442 | 1,442 | 1,386 | 1,286 |
Carryover to next year | - | - | - | 554 | 554 |
Total (incl. carryover and 500GL of groundwater) | 2,414 | 3,863 | 4,507 | 5,545 | 5,800 |
Water price
The price of entitlements over time is shown in Figure 3.
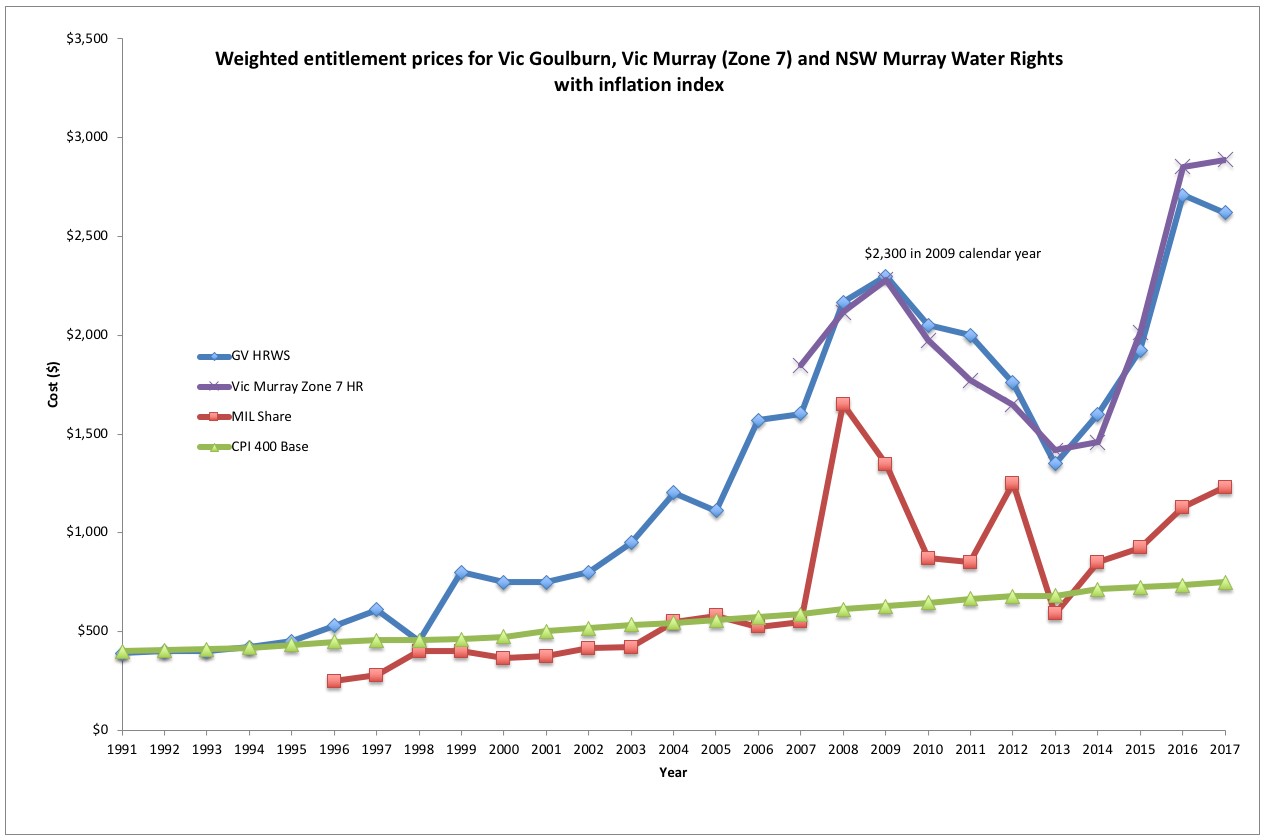
Figure 3. Weighted entitlement prices for Vic Goulburn, Vic Murray (Zone 7) and NSW Murray Water Rights with inflation index
The relationship between the level of allocation and the temporary price in the water market continues to hold with considerable accuracy and is shown in Figure 4 and Figure 5.
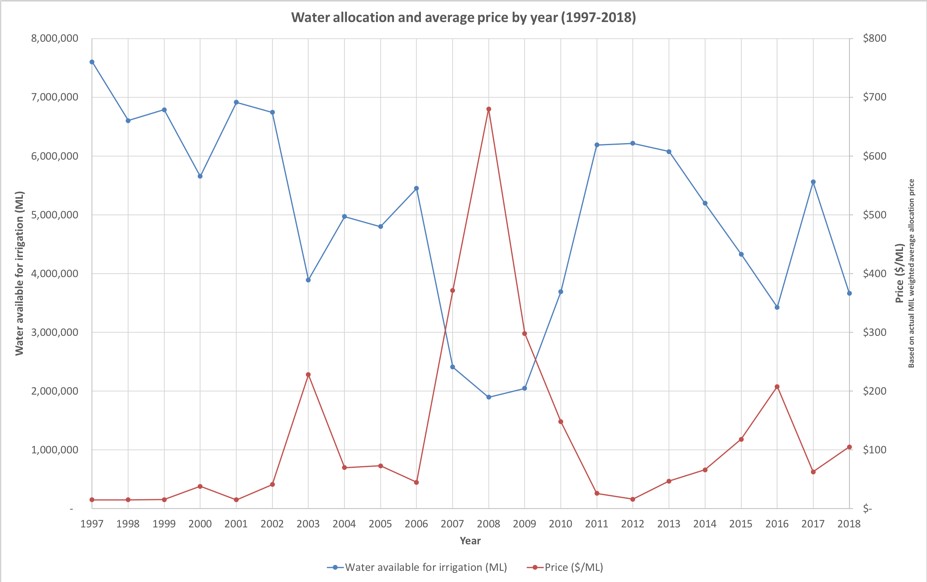
Figure 4. Water allocation and average price
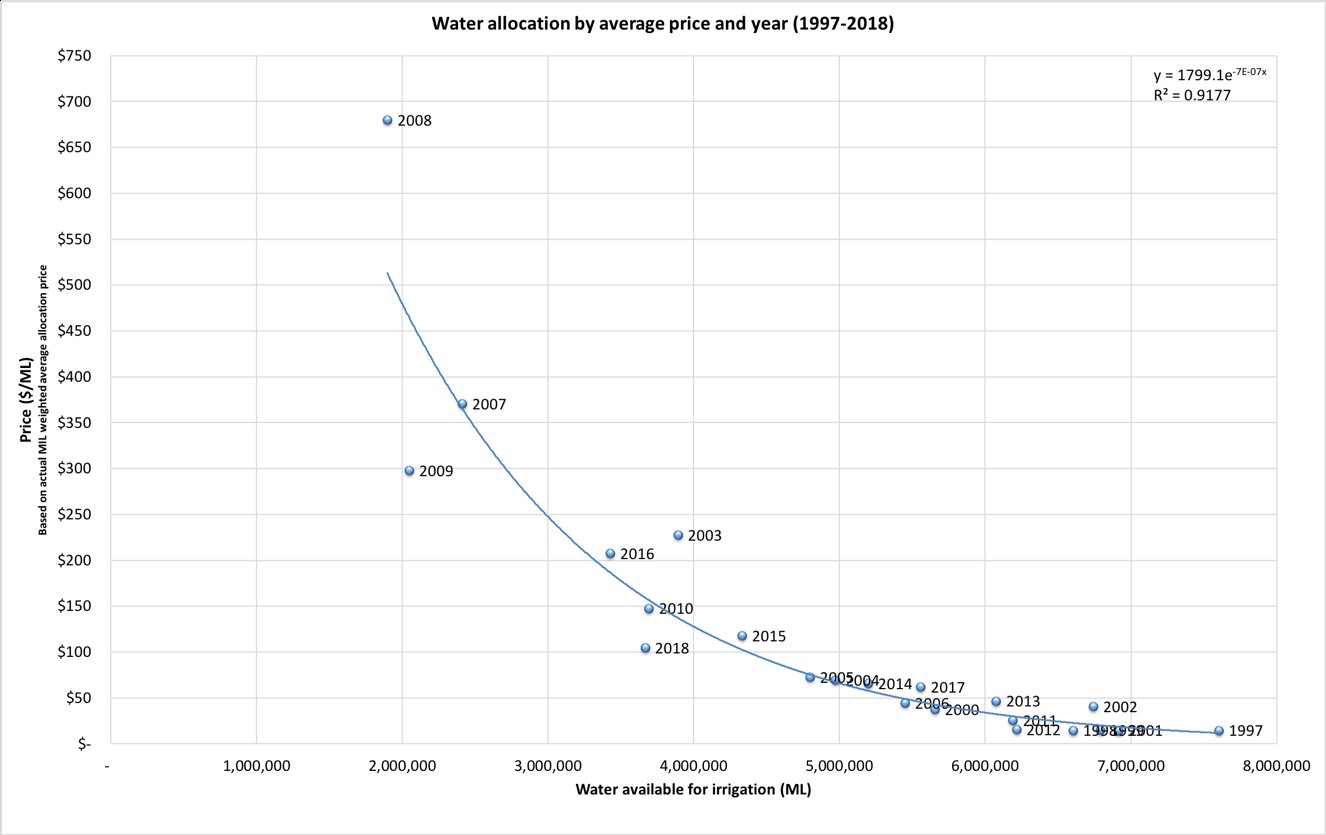
Figure 5. Correlation between water allocation and average price: 1997-2018
The value for 2018 appears to be slightly cheaper than the standard curve would indicate. However, 2018 had a very high level of carryover across the sMDB (at ~ 2,000GL) which effectively provided a greater allocation, i.e. it shifts the effective point to the right on the graph, closer to the standard fit.
The temporary price is shown in Figure 6. From this it can be seen that over the last six years the temporary price has been relatively consistent between regions and has ranged from $120 +/-$100 per ML.
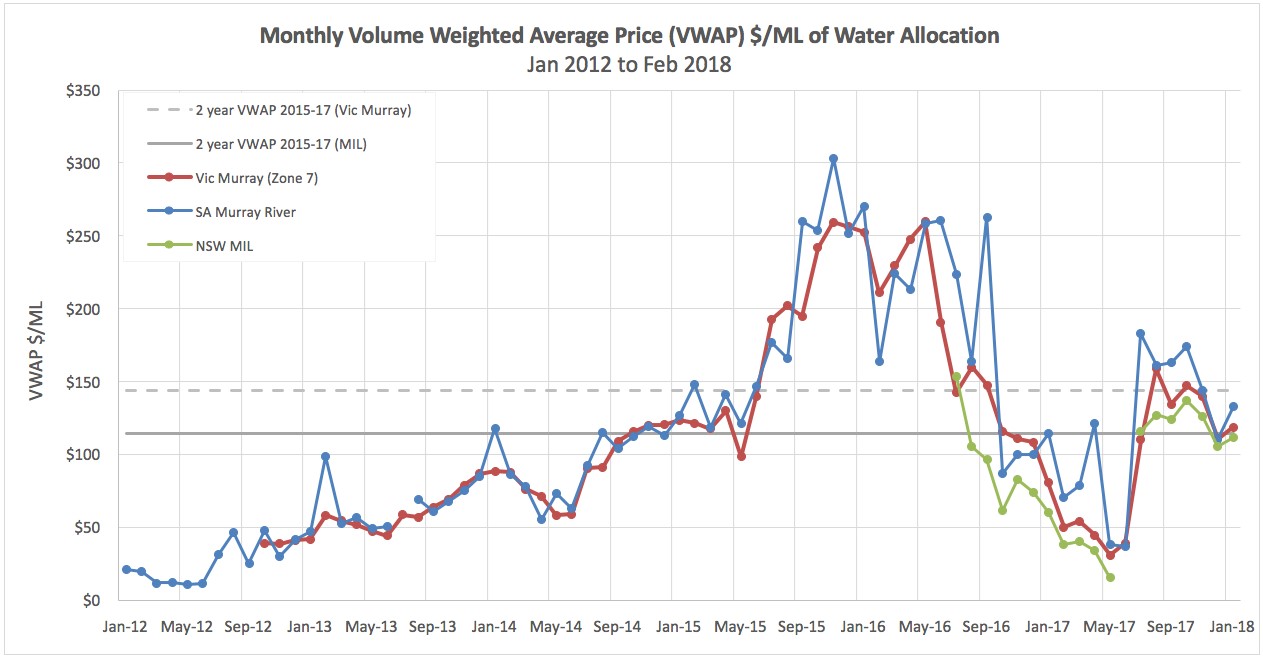
Figure 6. Monthly volume weighted average price (WAP) $/ML of water allocation (2012 – 2018)
Industry data
The number of farmers, the area irrigated and water applied in 2015/16 season is shown in Table 3.
In 2015/16 croppers generally used what water they owned but did not purchase much as the average price was around $200/ML.
Table 3 shows a lot about the region and where croppers fit in.
There are 5,000 irrigated businesses in the regions of which about ¼ irrigate crops excluding cotton and rice. In the NSW Murray and northern Victoria region there are 900 croppers using on average less than 300ML of water per year in 2015/16. The cotton growers use 10 times that amount per grower and the rice growers use over 1,000ML per year per business in a low production year.
Table 3. The number of farmers, the area irrigated and water applied in 2015/16 season.
Commodity description | Number of businesses | Area watered | Volume applied | Application rate | Volume per business |
|---|---|---|---|---|---|
Victoria: Goulburn Broken and North Central/CMA | |||||
Total number of businesses irrigating incl. dairy, hort. & grazing | 2,748 | ||||
Total crops | 479 | 53,789 | 101,490 | 1.9 | 212 |
Cotton | 1 | 96 | 766 | 8.0 | 766 |
Rice | 1 | 182 | 231 | 1.3 | 231 |
New South Wales: Murray/CMA | |||||
Total number of businesses irrigating incl. dairy, hort. & grazing | 1,086 | ||||
Total crops | 472 | 91,814 | 145,554 | 1.6 | 308 |
Cotton | 10 | 1,131 | 8,383 | 7.4 | 820 |
Rice | 79 | 6,608 | 77,262 | 11.7 | 982 |
New South Wales : Murrumbidgee/CMA | |||||
Total number of businesses irrigating incl. dairy, hort. & grazing | 1,124 | ||||
Total crops | 365 | 83,761 | 220,784 | 2.6 | 605 |
Cotton | 97 | 34,352 | 320,271 | 9.3 | 3,303 |
Rice | 194 | 17,450 | 221,318 | 12.7 | 1,140 |
Total of 3 regions | |||||
Total number of businesses irrigating incl. dairy, hort. & grazing | 4,959 | ||||
Total crops | 1,317 | 229,364 | 467,828 | 2.0 | 355 |
Cotton | 108 | 35,579 | 329,420 | 9.3 | 3,045 |
Rice | 274 | 24,241 | 298,810 | 12.3 | 1,091 |
Some things to think about
- What is your buy, sit and sell price for water?
Everyone has a different set of numbers – do you know yours? - Good times make or break your business
In other words, low water prices enable you to produce lots and determine your profitability. It is not what you do when water is expensive – did you buy water last year and make ‘hay’ when the sun shone? - $/ML of gross income is the main measure
Keep it simple – there are all sorts of complicated ways of measuring performance but the simplest is $?/ML gross income - Allocation water as % of income
Think of allocation water cost as a % of gross income i.e. water at $200/ML and maize at 16t/ha and 6ML/ha and $300/t means water is 25% of income – what is your limit? - Be careful of irrigation development
Owning water is an appreciating asset whereas developing irrigation infrastructure depreciates – which has made more money; owning water or irrigation development? - Irrigation development must be used.
Once you develop for irrigation – that money spent is GONE from the balance sheet– so can you make it produce? - Croppers compete with other industries
Do you know their gross income$/ML? i.e. know thy enemy - Short term price
There are short term (immediate, marginal return) decisions i.e. do I finish the crop – this usually means you can afford to pay a lot more for water. Do I buy now or do I buy later? - There are seasonal decisions
Each year the price is different and depending upon the likely average price for the year impacts what and how much crop you will plant. This needs an understanding of gross margins and ensuring you maximise total water use. If you own water the gross margin is always much better than if you have to buy - There are longer term decisions
Over the long term there are strategic decisions around do I stay farming, do I expand land, purchase water or undertake infrastructure development. All of these require a good knowledge of cost of operating (tax returns and some simple data of water use are all you need) and your profit. Also need to factor in purchasing entitlement or temporary pricing. The table provided (Table 7) gives a good basis for these numbers. - Should you own permanent or buy temporary
Probably both but those who own have done well. - Carryover
Always participate in carryover if the price of water is less than your ‘buy’ price. The more water you use at a profitable price the more you make. - Farm efficiency grants
These have been provided as a subsidy which has typically meant instead of having for example 12 years to pay back the development, the payback period is reduced to five years. The big benefit is that it reduces labour which enables farm expansion (replace the water) or enables a longer life for older farmers.
Acknowledgements
The GMID Leadership group and the Goulburn Broken CMA has supported RMCG in undertaking much of this research provided here.
References
“Update on GMID water availability scenarios and Irrigated Production across the Southern connected Basin” Prepared by RMCG for Goulburn Broken CMA - 6 JUNE 2018
Contact details
Rob Rendell
135 Mollison St Bendigo Victoria
0428 510 642
robr@rmcg.com.au
Was this page helpful?
YOUR FEEDBACK