How much economic value can the grazing of dual purpose crop contribute to a mixed enterprise farming system
Author: Cam Nicholson (Nicon Rural Services, Geelong) | Date: 08 Aug 2018
Take home messages
- Successful grazing of crops requires planning from the outset of the season to reduce crop yield losses (e.g. sow earlier) and maximise livestock productivity (e.g. change operation timings to suit, increase number of twin bearing animals).
- Adequate cropped area was important for significant change to farm profit. The rule of thumb is >60% cropped to ensure adequate feed for meaningful change to livestock production.
- Sowing crops earlier saw yield increases that often outweighed the marginal yield declines from grazing and provided feed earlier in the season.
- Increasing livestock production by moving to twin bearing ewes to capitalise on the additional feed available, increased farm profitability. The increased fecundity of ewes and number of lambs increased the dry sheep equivalent (DSE) carried, providing an alternative strategy to buying more stock to match feed availability.
Introduction
The opportunities, risks and ‘rules’ around grazing dual purpose winter crops are reasonably well understood (Creelman et al, 2015; Dove and Kirkegaard, 2014; Nicholson et al, 2016). However economic information on grazing dual-purpose winter crops is often simplistic or lacks rigorous economic analysis that captures the farming systems implications or trade-offs.
The most common economics analysis around grazing crops are simple at best, such as valuing the number of grazing days when on the crop and multiplying this by an agistment rate. Another common approach is to calculate the total energy consumed and then equating this to the equivalent amount and cost if a supplement feed source was used. Both approaches will tend to overvalue the benefits from grazing.
Growers and advisers have also observed other possible effects when grazing a winter crop, such as:
- Changes in grain yield after grazing (often a decline but also sometimes an increase).
- An increase in pasture biomass because pastures are being ‘spelled’ when animals are on the crop.
- Higher animal condition after grazing the crop which flows through into benefits such as greater wool cut, slightly higher lambing percentage and improved growth of young animals.
Growers and advisers also realise that a year when large amounts of crop biomass is available for grazing is commonly a year when there is also ample pasture feed, usually because of a favourable autumn break. Conversely a year with poor autumn pasture growth means that the crop biomass available, albeit less than in a good year, is more ‘valuable’ than in a year of abundance. If livestock prices are poor and grain prices are high, the risk to the overall farm profit, say from a reduction in grain yield, may be greater than in years when livestock are worth a lot and grain prices are low. This complexity makes valuing grazing winter crops difficult.
Method
The Grain and Graze 3 program (principally Zoe Creelman) conducted whole farm modelling on three farms in Western Australia (Moora, Katanning and Esperance), two farms in south west Victoria (Inverleigh and Penshurst) and two farms in South Australia (Kapunda and Minnipa) to appreciate the dynamics of these interactions and the effect on the business ‘bottom line’ (Creelman, 2017). Model farms were based on typical farms for those regions and developed using a combination of APSIM, GrassGro, GrazFeed and @Risk. Farm structure and outputs were verified by local consultants and researchers.
Summary information for the South Australian and Victorian farms are presented (Table 1), with a detailed example from Inverleigh used in this paper. Reports on each location and an executive summary are available from Grain and Graze3 website.
Table 1. Enterprise mix and area of cropping and grazing for each model farm.
| Crops | Livestock | ||||
|---|---|---|---|---|---|
| South Australia | Kapunda |
Wheat (milling and durum) Barley Canola | 650ha |
Self-replacing Merinos First cross Merino x Suffolk | 1850ha |
| Minnipa |
Wheat Field peas Canola | 1300ha | Self-replacing Merinos | 440ha | |
| Victoria | Inverleigh |
Wheat Barley Canola | 240ha |
Prime lambs Self-replacing Merinos First cross Merino x Suffolk | 900ha |
| Penshurst |
Wheat Barley Canola | 110ha |
Vealers Prime lambs Self-replacing Merinos First cross Merino x Suffolk | 935ha | |
Three management scenarios were compared against a baseline of no grazing of any winter crop (the control). The management scenarios chosen were informed from previous investigations (e.g. Kirkeguaard 2013, Hunt et al, 2016) and grower observations. The three scenarios were:
- A ‘typical’ time of sowing and grazing crops only if pasture feed on offer (FOO) was < 750 kg/ha
- ‘Early’ sowing, grazing all ewes on crops, with grazing rules as per scenario 1
- ‘Early’ sowing, increased stocking rate, grazing all ewes on crops, with grazing rules as per scenario 1.
Key outputs presented are for net farm profit and then components of:
- Crop gross margin
- Livestock gross margin
- Lambing %
- Sale weight
- Wool cut
- Supplementary feeding
The model for Inverleigh
The Inverleigh farm was a total of 1,140ha arable area - 240ha cropped (100ha wheat, 70ha barley, 70ha canola). The remaining 900ha was improved pasture with prime lamb and first cross operations. The prime lamb flock contained 2350 breeding ewes (Dorset). The first cross flock contained 1975 breeding ewes (Merino), with half of them used to breed replacement Merino ewes and the other half crossed with a Suffolk sire for first cross lambs. The soil was a clayey sand with a plant available water capacity of 138mm.
Crops were generally sown between late April and late May, with varieties changed to suit the sowing time. Grazing period was July (Table 2).
Table 2. Crop variety, sowing window and grazing period.
| Crop | Variety | Typical sowing date | Variety | Early sowing date | Grazing period |
|---|---|---|---|---|---|
| Canola | Hyola 650 TT | April 25 - May 5 | Taurus | April 11 - April 18 | Not grazed |
| Wheat | Bolac | May 8 - 15 | Revenue | April 1 - 10 | July 1 -21 |
| Barley | Commander | May 20 - 27 | Capstan | May 7 - 14 | July 10 - 31 |
Results (for Inverleigh)
Grazing crops and stubbles at Inverleigh with ‘typical’ sowing dates and grazing resulted in 2.3% increase in average net farm profit of $9,600, although the range was between approximately +$34,000 (9.8%) and -$7,200 (-2%) (Figure 1).
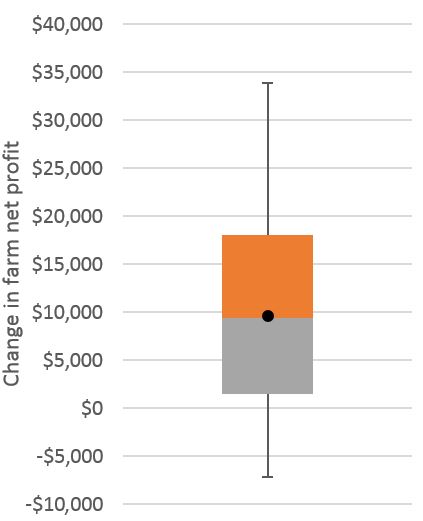
Figure 1. Change in net farm profit with grazing crops compared to a baseline of not grazing.
There was a greater increase in net farm profit during the low rainfall years than the good years, while the top 25% of years only increased 1.2% with grazing crops, the bottom 25% of years increased 4.0%.
Crop gross margin
Grazing crops that were sown on a ‘typical’ date resulted in a decline in crop gross margin (GM) 86% of the time. On average the change in crop GM with grazing was -$21/ha due to yield decline with grazing (Figure 2).
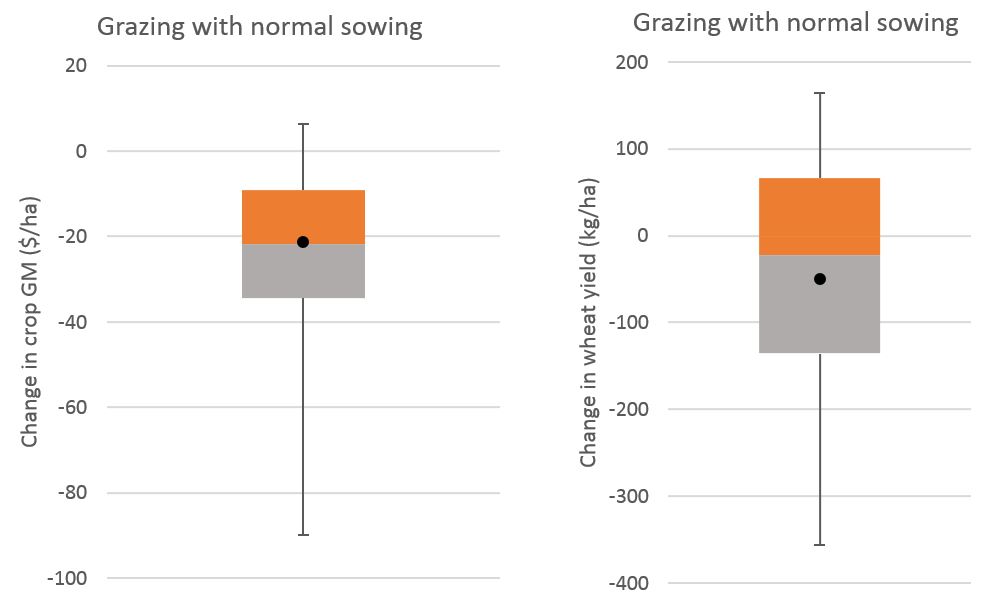
Figure 2. Change in crop GM (left) and wheat yield (kg/ha) with grazing compared to the baseline of not grazing.
Wheat yield decline with grazing was the main cause of decreased crop GM. The larger area of wheat planted than barley (100ha wheat versus 70ha barley) and higher prices of wheat meant the yield declines in wheat had a greater effect on crop margins than barley. Barley yields changed the same proportions from grazing as wheat (n.b. APSIM does not allow defoliation (grazing) of barley so grazed barley was modelled by using the same proportional decline in wheat yields from grazing). Autumn sown canola was not grazed in the model because winter was considered too cold for adequate recovery prior to flowering.
Livestock gross margin
Crops were only grazed when the extra fodder was needed (when green pasture FOO was <750 kg DM/ha animals were put on crop). This resulted in crops not being grazed in most years (Table 3).
Table 3. Frequency of crops grazed.
| Prime lambs | Merino x Suffolk (terminal ewes) | ||
|---|---|---|---|
| Frequency of years | Crops grazed | Frequency of years | Crops grazed |
| 27% | Barley (2-23 July) | 18% | Wheat (9-23 July) |
Livestock gross margin increased with grazing crops 89% of the time. The average GM increased by $12.50/ha (Figure 3).
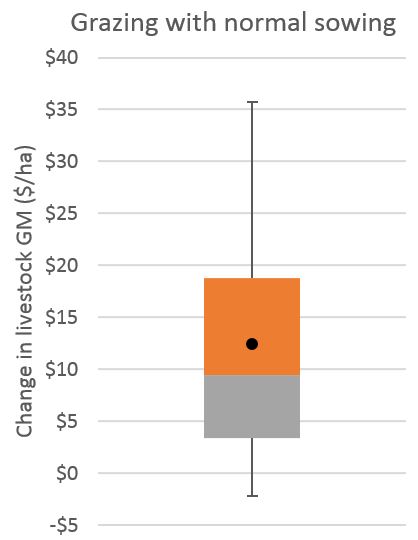
Figure 3. Change in livestock GM with grazing crops compared to a baseline of not grazing crops.
Lambing percentage
Grazing crops marginally increased lambing percentage for the prime lamb mob (average increase of 1%). Grazing crops did not affect the first cross (Merino x Suffolk) lambing percentage because the ‘typical’ lambing time meant ewes could only start grazing the crops an average of two days before lambing. This resulted in minimal change in lambing (Figure 4). Prime lamb ewes grazed crop July 2-23 and lambed on August 11. This meant they were 0.1 condition score (CS) higher at point of lambing, contributing to an increase in lambing percentage.
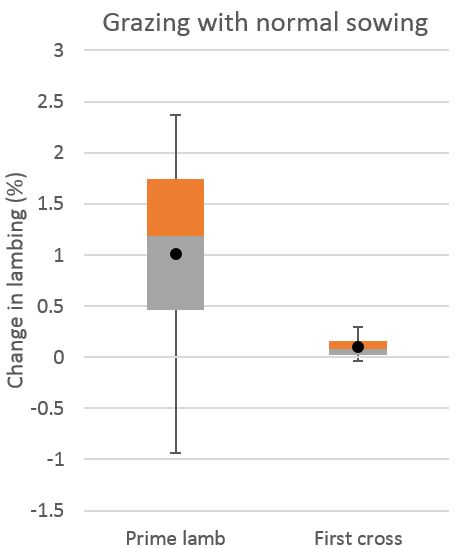
Figure 4. Change in lambing percentage with grazing crops compared to a baseline of not grazing crops.
Livestock sale weight
The only animal class to change sale weight were the first cross lambs and cull for age (CFA) ewes from the prime lamb flock (Figure 5).
Prime lambs were sold when they reached 50kg live-weight (LWT). The first cross self-replacing flock rarely grazed crops so there was no change in the surplus ewe and wether sale weights.
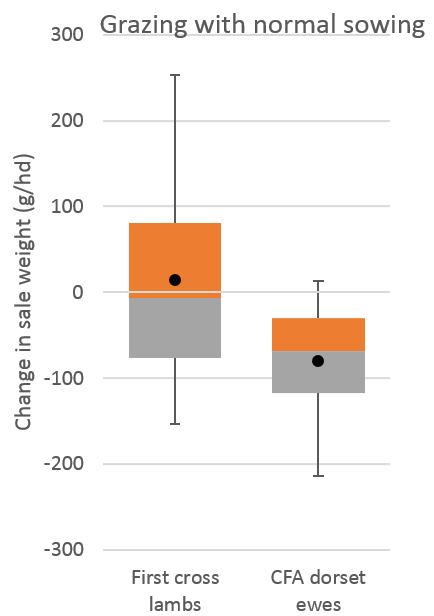
Figure 5. Change in sale weights of first cross lambs and culled for age (CFA) ewes from the prime lamb mob with grazing crops.
On average lambs were sold at about the same weight whether crops were grazed or not grazed. CFA ewes from the prime lamb mob sold on average 81g lighter (-$0.10/hd).
Wool cut
Wool cut increased marginally with grazing crops (Figure 6). Ewe wool cut increased on average 5g clean fleece weight (CFW)/hd. At a price of $13.21/kg clean for 19μm wool that is an average increase of $0.07/ewe.
There was a greater increase in cut from first cross lambs where they grazed stubble and the maternal ewes had been grazing crop at lambing. On average, first cross lamb wool cut increased by 26g CFW/hd. At a price of $11.04/kg for 23μm wool that is an average increase of $0.29/lamb.
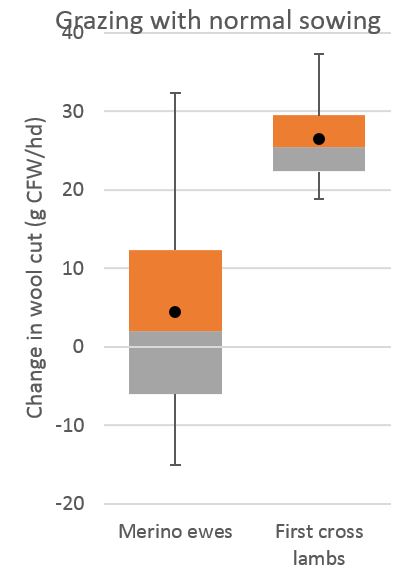
Figure 6. Change in wool cut from merino ewes and first cross lambs with grazing crops.
Supplementary feed
Supplementary feed reductions with grazing crops was a key saving that increased the livestock GM. The change was more substantial in the supplementary feeding of the prime lamb mob than the first cross mob (Figure 7). This was because the self-replacing part of the first cross enterprise did not graze crops and thus did not have any substantial change in feeding.
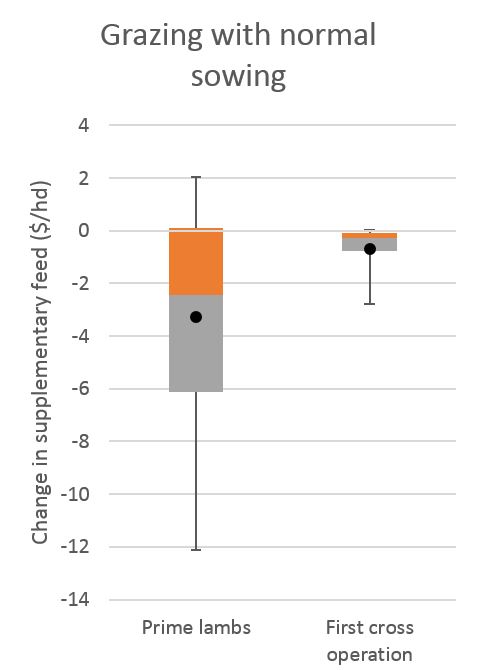
Figure 7. Change in supplementary feeding costs for the whole flock divided by the number of ewes.
The prime lamb operation saved on average 36.9t feed (barley) which equated to $7,700 across the mob on average. The first cross mobs saved on average 6.7t of feed, or $1,400.
Occasionally feeding out increased with grazing crops, seen in the upper whisker in Figure 7 reaching $2.10/hd. This was mainly driven by increased feeding out to finish lambs in a late autumn break because there were more lambs born during this period when crops were not grazed.
Changing farm practice
Two additional scenarios were examined (earlier sowing and earlier sowing with increasing stocking rate to maintain the same stocking rate by utilising the extra feed). At Inverleigh, the area and grazing period was only substantial enough for the Merino x Suffolk part of the first replacing flock to increase stock number by about 2%. The key findings were:
- Net farm profit increased by 7.7% to an average of $31,600 when early sowing occurred and higher stock number were implemented (range -$5,000 to +$70,500). There was a greater net farm profit increase in the poor years than the good years: the top 25% of years increased 6.3% with grazing crops, while the bottom 25% of years increased 8.6%.
- Sowing earlier also meant crops could be grazed in June rather than July, allowing more recovery time before flowering which reduced the impact on crop yields. Crops were now grazed 61% of the time for the prime lamb operation and 52% of the time for the first cross enterprise.
- Livestock gross margins increased 99.3% of the time. On average the GM increased by $21/ha. The biggest driver on the gross margin increase was a substantial reduction in supplementary feeding (Figure 8). Lambing percentage, wool cut and sale weight all increased but only marginally.
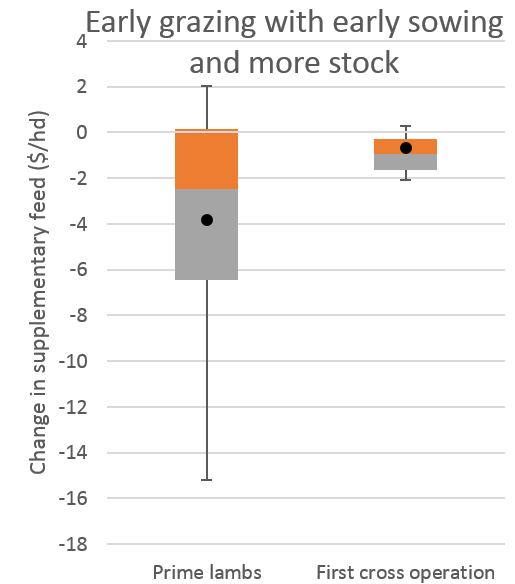
Figure 8. Change in supplementary feeding for the whole mob divided by the number of ewes in the mob where early sown crops were grazed with more stock.
The prime lamb operation saved on average 43.0t feed (barley) which equated to about $9,000 across the mob. The first cross mobs saved on average 5.3t of feed, or $1,100.
The main conclusions from the change in sowing time and stocking rate were:
- Sowing crops earlier saw significant increases in grain yields (even when shifting to feed varieties from milling) that diluted the impact of grazing yield penalties.
- More condition at lambing led to more live lambs.
- Shifting flocks to twin bearers was less risky than increasing flock size to capitalise on extra feed in season. Increasing flock size to capitalise extra feed came with the down-side risk of having to increase supplementary feeding to maintain animals in a bad year.
- Where possible the model was altered to maximise outputs and capitalise on opportunities, but a real system would be more responsive to seasons and prices (e.g. holding on to stock or selling early depending on feed availability).
Differences in grazing crops across agro-ecological zones
The enterprise mix, rainfall and livestock classes were key drivers in how influential grazing winter crops made to the businesses’ bottom line. Examination of all eight farms revealed the following:
- Farms with minimal crop area (e.g. Inverleigh and Penshurst) were restricted to short periods of grazing crops with select animal classes. This limited the potential for increases in farm profit from grazing crops. As a rule of thumb, if crop made up >60% of the farmed area, grazing crops had the potential to substantially change farm profits.
- Low rainfall areas typically had lower net farm profits, so the gains made through reducing supplementary feeding, increasing yield from sowing earlier and selling more animals slightly heavier saw significant proportional increases in farm profits (e.g. Minnipa compared to Penshurst).
- High value animals that made additional gains by grazing crops helped overcome the cost to crop yields of grazing crops e.g. grazing crop with twin bearing ewes rather than single and twin bearers saw greater returns.
References
Creelman, Z., Falkiner, S. & Nicholson, C. (2015). Investigating farmer practices and concerns around grazing crops in south-eastern Australia, GRDC. Available from Grain and Graze3 website
Creelman Z, (2017). Economic analysis of grazing winter crops – executive summary. Available from Grain and Graze3 website
Dove H, Kirkeguaard J (2014). Using dual-purpose crops in sheep-grazing systems – a review. J Sci Food Agric 2014; 94: 1276–1283.
Hunt J, Rheinheimer B, Swan T, Goward L, Wheeler R, Ware A, Davis L, Nairn J, Pearce A, Ludwig I, Noack S, Hooper P, Faulkner M, Braun J, Flohr L (2016), Early sowing in South Australia results from 2015 and a summary of two years of trials, GRDC Update Papers.
Kirkeguaard J (2013). Optimising the integration of dual-purpose crops in the high-rainfall zone. Report to the GRDC Available from Grain and Graze3 website
Nicholson C, Frischke A, Barrett–Lennard P (2016) Grazing cropped land - A summary of the latest information on grazing winter crops from the Grain & Graze Program: GRDC Canberra
Contact details
Cam Nicholson
nicon@pipeline.com.au
GRDC Project Code: SFS00028,
Was this page helpful?
YOUR FEEDBACK