Farming systems: GM and $ return/mm water for farming systems in CQ
Author: Darren Aisthorpe (DAF QLD) | Date: 04 Dec 2018
Take home message
- Legume rotations don’t equate to free N or any other nutrient
- Most profitable crop sequence has been chickpea/cereal rotation, but at what cost?
- Manure application provide unexpected boosts and is turning up some unexpected benefits.
Background
The project developed six locally relevant farming systems in 2015. These were consistent with those being studied by the Northern Farming Systems Initiative core site near Pampas in Southern Queensland. A range of agronomic practices (i.e. row spacing, plant population), crop types and rotations, crop frequency, planting time/windows, tillage practices, fertiliser rates and planting moisture triggers were adopted and strategically used to develop the following six farming system treatments:
1. Baseline - A conservative zero tillage system that is commonly used. It has approximately 1 crop/year, with fertiliser applied to match 50th percentile yield expectation for the Plant Available Water (PAW) at planting. Crops include: wheat, chickpea and sorghum
2. Higher crop intensity - This system is focused on increasing the cropping intensity to 1.5 crops/year to see whether a higher cropping intensity is more profitable in the long-term. Is a higher risk strategy that plants into lower plant available water, more sustainable from both from an agronomic and economic point of view? Crops include wheat, chickpea, sorghum, mungbean and forage crops/legumes
3. Higher legume - The frequency of pulses is increased in this system (i.e. 1 pulse every 2 years) to assess the impact of more legumes on profitability, soil fertility, disease and weeds. Crops include wheat, chickpea (but not chickpea on chickpea), sorghum, mungbean and new legume crops
4. Higher nutrient supply - This system applies fertilisers to supply adequate nutrition to support 90% of the potential yield based on soil moisture (PAW) at planting. What is the economic implication of increased nitrogen and phosphorus rates that target higher yields and protein level in an environment of variable climate? The crops and other practices are the same as the Baseline system
5. Higher soil fertility - This system is a repeat of the ‘Higher nutrient supply’ system, but with the addition of 20 t/ha of manure in the first year and 40 t/ha in 2016. The system is designed to see if higher initial soil fertility can be maintained with greater nutrient inputs (targeting 90% of yield potential based on PAW). The crops and other practices are the same as the Baseline system
6. Integrated weed management - This minimum tillage system is focused on 1 crop/year but employs a wide range of practices to reduce the reliance on traditional knockdown herbicides in CQ farming systems. Practices include tillage with full disturbance planting; contact and residual herbicides; and other cultural practices such as high plant population, narrow rows, crop choice and use of emerging technologies. Crops include wheat, chickpea, sorghum and mungbean.
Table 1. Crop rotations at the Emerald site 2015 - 2018
| Winter 2015 | Summer 2015/16 | Winter 2016 | Summer 2016/17 | Winter 2017 | Summer 2018 | |
|---|---|---|---|---|---|---|
| 1. Baseline | Wheat EGA Gregory | Chickpea Kyabra | Wheat Sunguard | Sorghum MR-Buster | ||
| 2. High Crop Intensity | Wheat EGA Gregory | Mungbean Jade | Wheat Condo | Wheat Sunguard | Sorghum MR-Buster | |
| 3. High Legume | Chickpea Kyabra | Wheat Condo | Chickpea Seamer | Sorghum MR-Buster | ||
| 4. High Nutrient | Wheat EGA Gregory | Chickpea Kyabra | Wheat Sunguard | Sorghum MR-Buster | ||
| 5. High Soil Fertility | Wheat EGA Gregory | Chickpea Kyabra | Wheat Sunguard | Sorghum MR-Buster | ||
| 6. Integrated Weed Management | Wheat EGA Gregory | Chickpea Kyabra | Wheat Sunguard | Sorghum MR-Buster |
What was done
While there are six clear treatments being managed at the Emerald farming systems site, due to similar planting protocols and sowing trigger points, as can be seen in Table 1, effectively we have had only three different crop rotations over the past four years. The first, and most predominant to date has been the “Baseline” rotation. Four treatments; Baseline, High Nutrient, High Fertility and Integrated Weed Management (IWM) have all followed this rotation to date, however differences in nutrition applied, manure application, row spacing and populations have meant that they are all differentiated from each other. Figure 1 shows what crops have been grown and rainfall received (both in crop and fallow) during the trials progression.
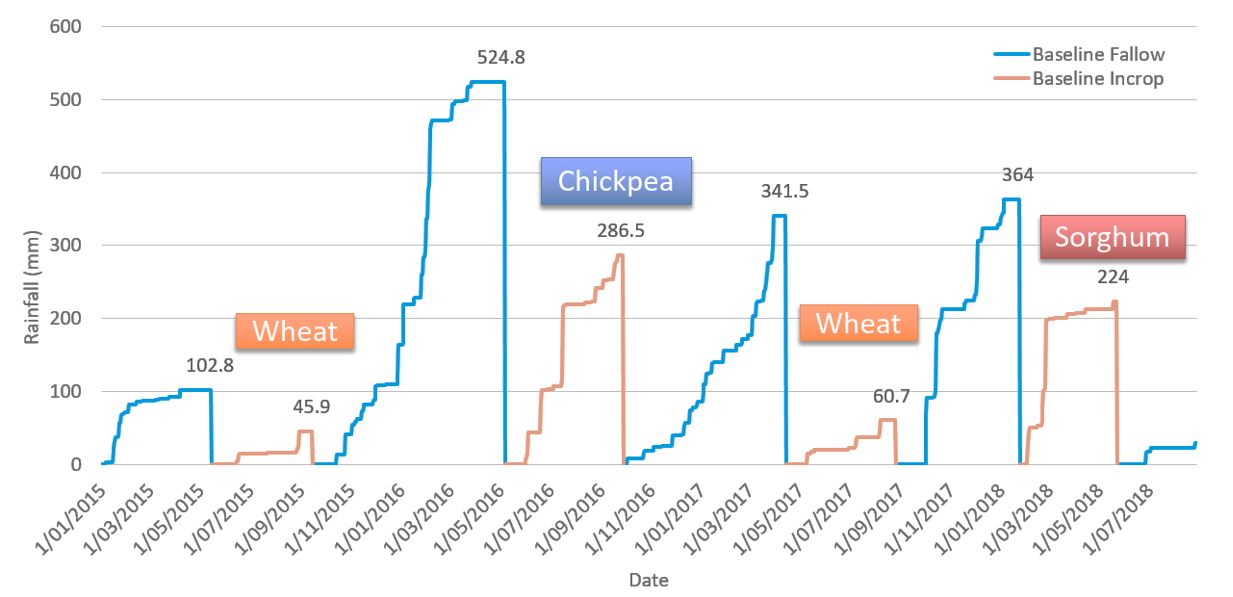
All four treatments target one crop per year. Fortunately, despite some limited rainfall periods over the past four years, we have been able to achieve this. When you view this graph, what becomes apparent, excepting 2016, is just how little in crop rain was received during winter crop cycles. These crops were almost completely reliant on sub soil moisture to achieve yield, which is the reality of farming conditions in CQ.
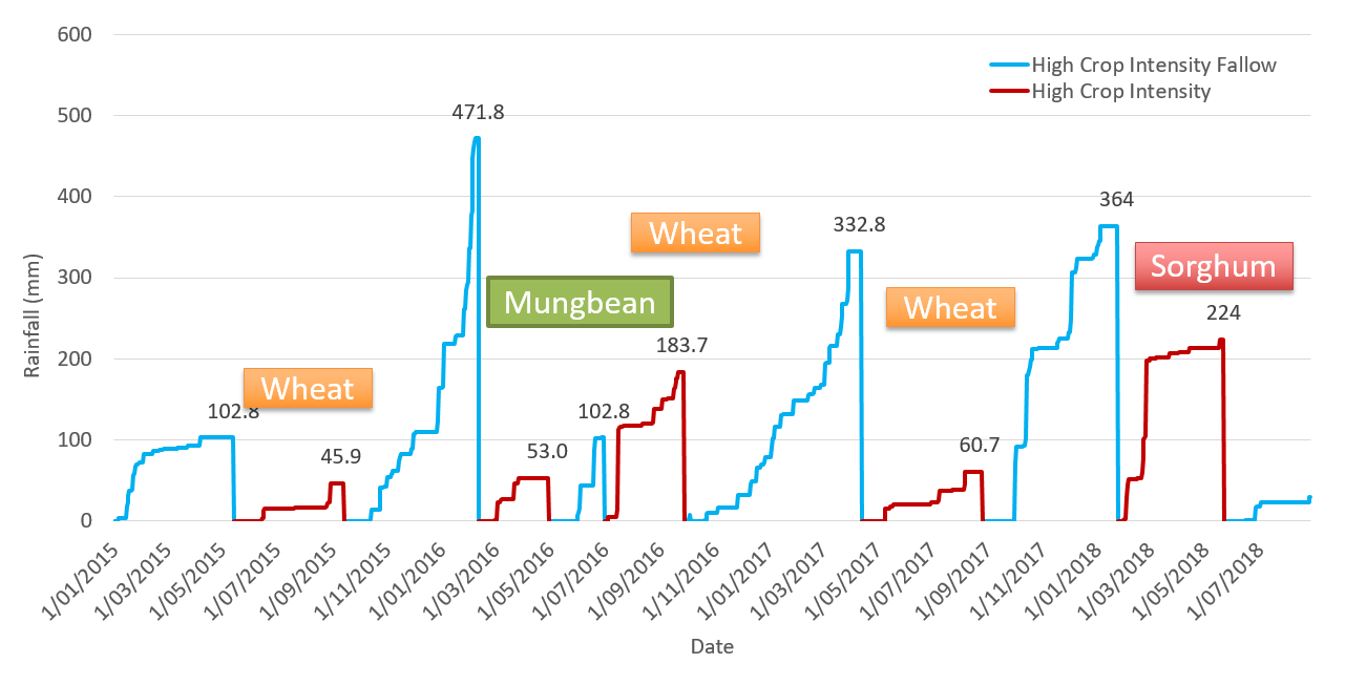
Figure 2. Cropping cycle and accumulated rainfall during both fallow and in crop cycles for the “High Crop Intensity” rotation. Data labels indicate total accumulated rainfall for any given fallow or cropping phase.
Despite the name, the high crop intensity treatment (Figure 2) has only managed to grow one extra crop above to the other treatments in the trial. This was a mungbean crop planted in late February of 2016 on the back of excellent moisture and good planting conditions. However, the tap really turned off during the growing period and temperatures spiked resulting in an average yield of about 1 t/ha, well below expectations given the water available. Fortunately, the crop used little of the soil water profile and with top up rain in late May and early June, the plots were planted to wheat. No other double cropping opportunity has presented during the defined planting window and triggers since.
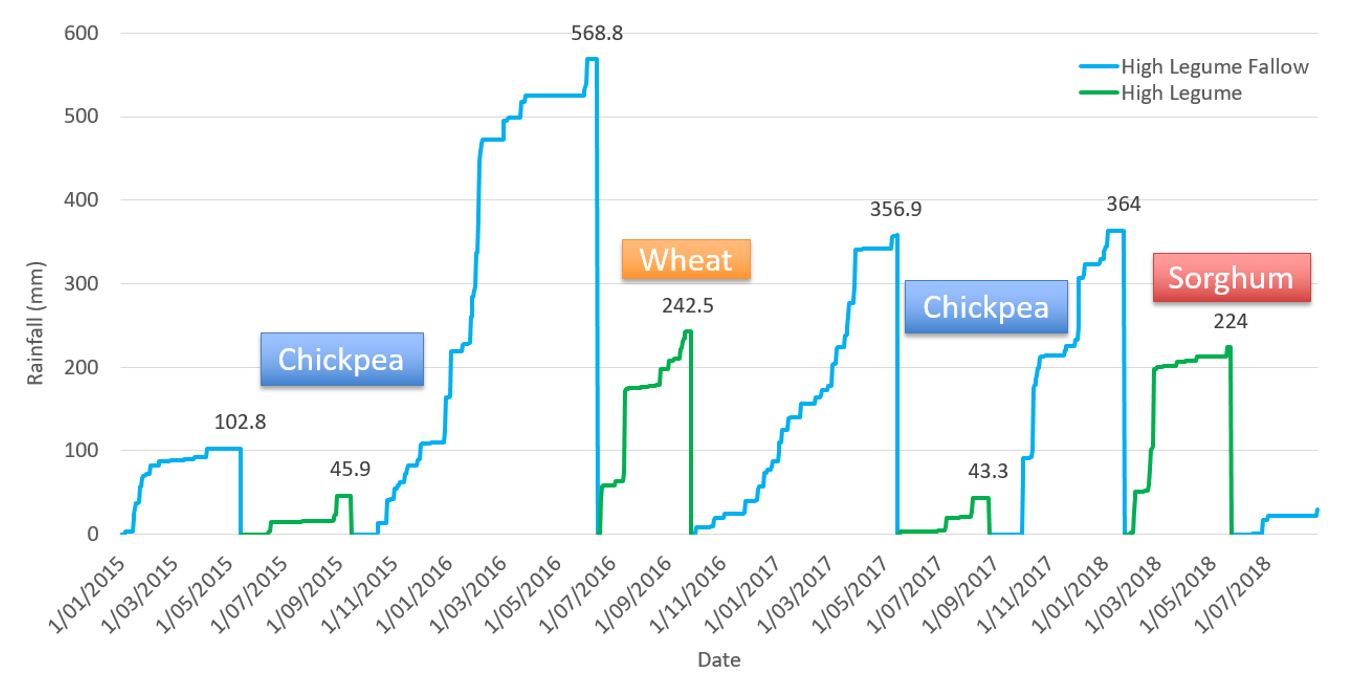
Figure 3. Cropping cycle and accumulated rainfall during both fallow and in crop cycles for the “High Legume” rotation. Data labels indicate total accumulated rainfall for any given fallow or cropping phase.
The “High Legume” rotation is the third rotation which has taken place on site. Again, only targeting one crop per year, but this time with an aim of planting one legume crop in two. It should be noted that the fallow rainfall accumulation over summer of 15/16 and summer 16/17 was higher than the “Baseline” rotation. This was because in winter 2016 the chickpea in Baseline was deep planted before the season “broke” in early June. Then in winter 2017, we planted the wheat as early as we could in April to use available water before it got too deep, but held off sowing chickpeas until late May, as we knew we could chase soil water with chickpea if required.
Results
The treatment differences have been assessed on a range of indices, and typically on a cumulative basis, rather than simply a crop by crop basis. After 4 years of data collection, despite treatments having a superficially similar sequence, the true differences are starting to become apparent.
The interesting responses are in the “High Fertility” and “IWM” treatments. Both possibly the most “radical” treatments of the six. One has had approximately 60 t/ha of feedlot manure applied, and the other, while designed to focus in on weed management, has actually been a very interesting comparison of row spacing and population effect on a farming system.
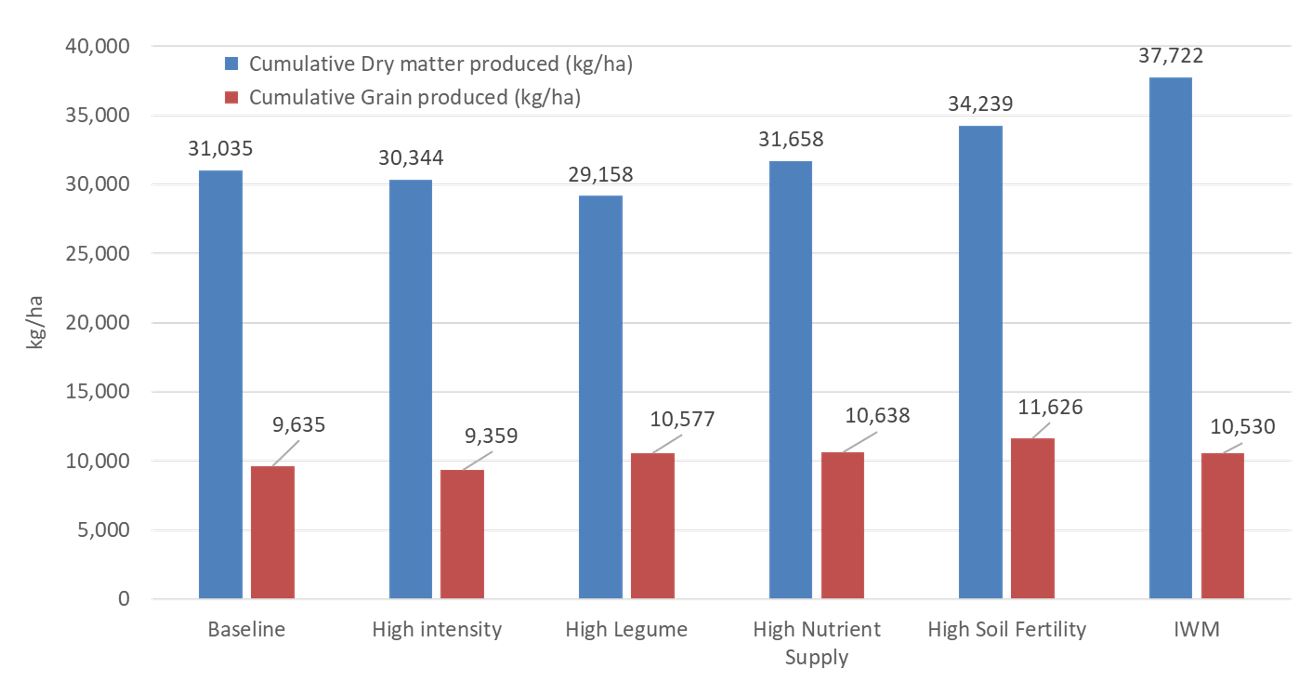
Figure 4. Total dry matter and grain yield accumulation over the duration of the trial to date
(to Nov 2018) across the six treatments.
Biomass/grain accumulation
Accumulated biomass and grain yields are continuing to diverge as the trial progresses. Note that while the IWM treatment has (understandably) produced the most dry matter of all the treatments, and had produced a yield outcome that is higher than Baseline and High Intensity and comparable to the High Legume and High Nutrient Supply treatments, but lower than the High Soil Fertility treatment.
System Water Use Efficiency (kg/mm)
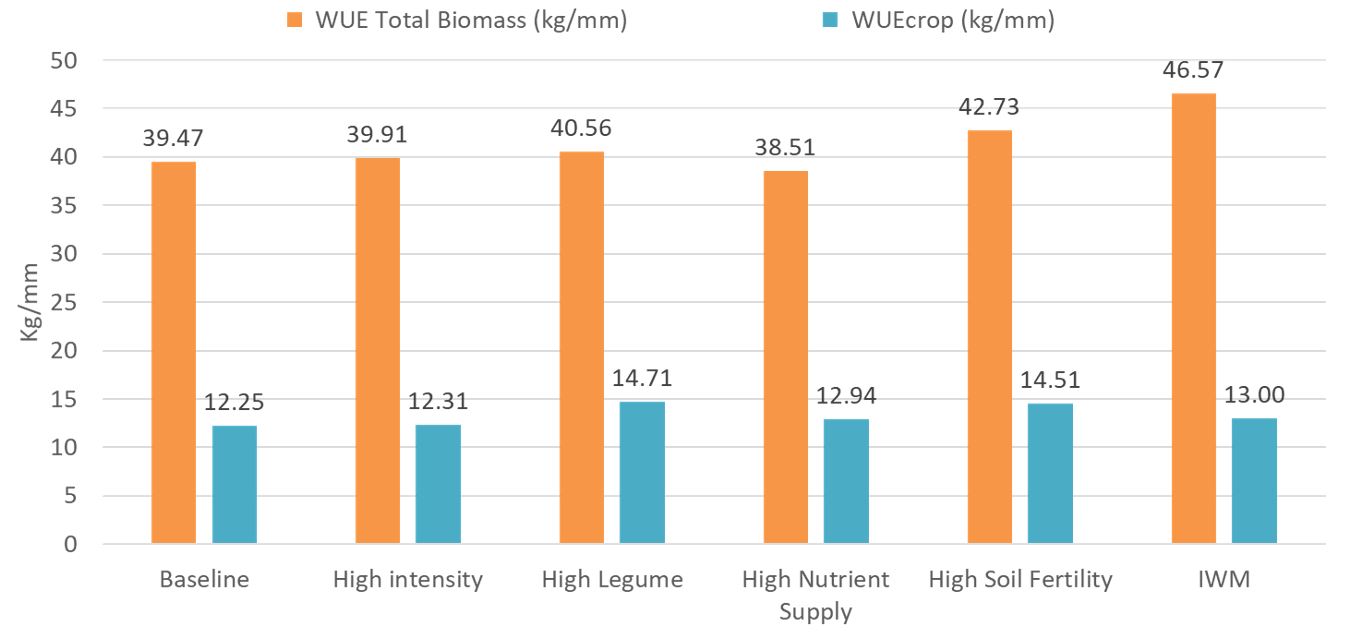
The Water Use Efficiency (WUE) is a fundamental assessment for any farming system. The goal of any farming operation is to convert water to saleable biomass/grain as efficiently as possible. Figure 5 shows the kg return per mm received for both total dry matter produced, and grain produced over the four years of the trial to date. The calculation used to achieve the kg/mm numbers below are simply total biomass (or grain produced) per ha divided by the difference in starting water (2015) and harvest waters in 2018 + total rainfall over that period of time.
Figure 5. Trial duration Water Use Efficiency (WUE) in kg/mm of dry matter production and grain production for the six treatments
From the outset, it appears that the legume rotation has been the most efficient of the treatments for grain produced per mm received. The IWM and High Soil Fertility treatments were the most efficient treatments in converting rainfall to dry matter. High Soil Fertility was almost able to match High Legume for grain produced per mm. Interestingly, despite IWM being more efficient at converting water to biomass, the High Nutrient Supply treatments was close to matching the IWM treatment with respect to grain production.
System WUE ($/mm)
The next logical step, is to calculate what financial return, treatments generate per mm of rain received. The calculation is (grain yields x price) divided by ((difference in starting and finishing waters) + rainfall received during the trial duration). For the gross margin calculation, production costs are subtracted from the grain yields x price calculation.
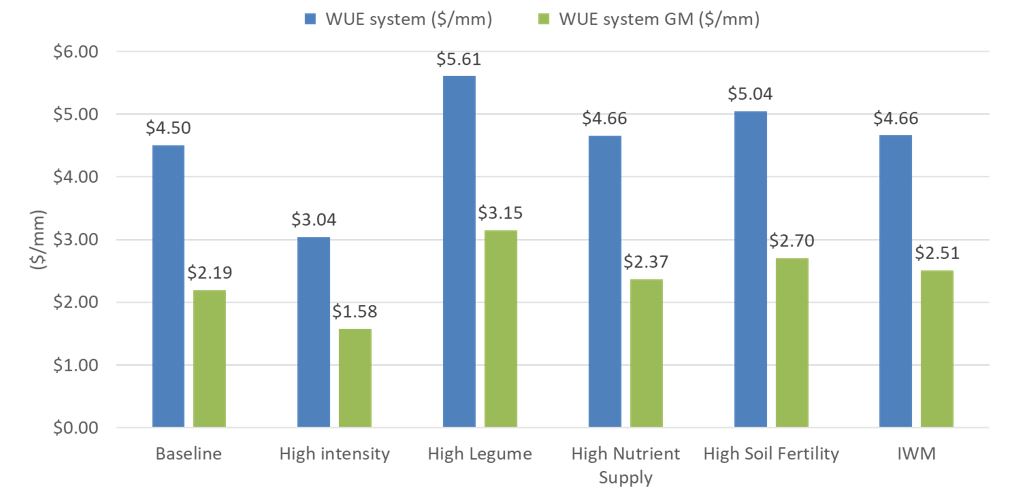
The High Legume treatment to date has clearly come out in front of all other treatments by a reasonable margin. The double bonus of higher price and similar yields to traditional cereal crops has helped the rotations come out on top to date. Conversely, the High Intensity treatment has fallen well behind even the baseline treatment, despite growing an extra crop.
Nutrition
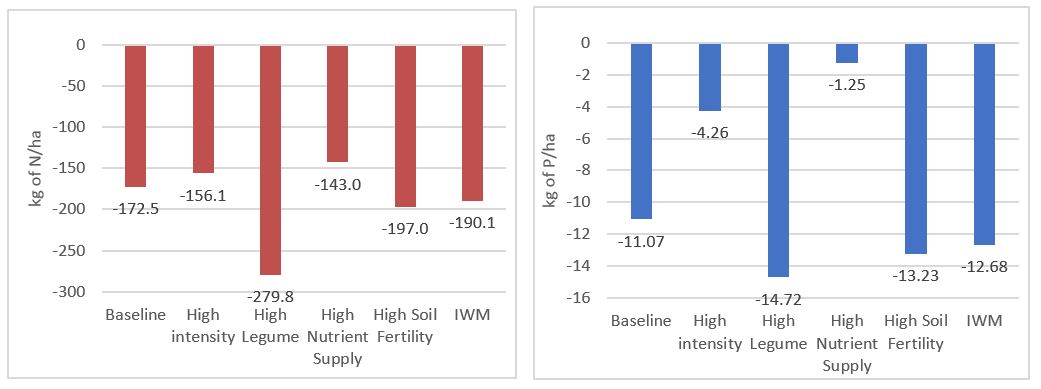
Throughout the life of the trial, use of key nutrients are monitored. The two graphs below in Figure 7 illustrate how the current balance sits based on N and P applied (calculated before planting, based on PAW and the yield target for the treatment (50th percentile or 90th percentile) depending on the treatment). The key standout from these two snapshots is firstly, how heavily we are mining our nutrient resources, even in the high nutrient and fertility treatments, the second is the effect on available N the legume treatments are having on our N balance.
When N removal by grain alone is considered. The trial average across all treatments currently, for every 1 tonne of chickpea harvested, we are also carting away 33 kg of N. So in a typical crop of chickpea (2.2 tonne/ha) you are carting away 72 kg of N per ha. N fixation from nodulation can range between, 20 – 50 kg/N depending on crop size/biomass, so therefore you are running at a net loss, if no additional N is being applied in the system.
However it is still very important to remember that chickpea and legumes generally do provide many other rotational benefits to a farming system. The question is around the long term N balance in the soil. When we compare starting N with finishing N four years later, we are currently sitting at a deficit of about 40 kg of N per ha in the High Legume treatment, with only the IWM treatment sitting lower with a deficit of 52 kg/ha.
Conclusion
The trial in CQ has highlighted some important elements of grain production in this region and provides some interesting insights into the importance of every mm of rainfall conserved and how much that extra mm is worth to the bottom line of a grain production business. As the graphs in Figure 7 highlight, even with what some may consider a high fertiliser application program, with a legume rotation included, we are still taking more from our soils than we are putting back.
The high legume rotation challenges many peoples’ perception of the benefits from a heavy chickpea or mungbean based rotation. It certainly has had the best return per ha both in terms of water use efficacy for grain produced but also bottom-line returns. However, given the significant draw down on N and P, you have to question if the true cost of the rotation have been factored in for long term sustainability.
The high fertility treatment is certainly one to watch, as we have seen some quite remarkable crop to crop responses, particularly around grain quality and establishment, which was not discussed in this paper. It is important to note the nutritional benefit of the manure has not been accounted for as yet within the N and P balance figures, however it is safe to assume that some benefit was to be expected after 60 t/ha was applied. Lab analysis indicate an approximate 53 kg/ha of N and staggering 608 kg/ha of P may have been applied, so with comprehensive soil analysis due again late this year, it will be interesting to see how much of that shows up and where in the profile.
Acknowledgements
The research undertaken as part of this project is made possible by the significant contributions of growers through both trial cooperation and the support of the GRDC, the author would like to thank them for their continued support.
Contact details
Darren Aisthorpe
Department of Agriculture and Fisheries QLD
99 Hospital Rd
Emerald QLD 4720
Ph: 07 4991 0808
Email: darren.aisthorpe@daf.qld.gov.au
Varieties displaying this symbol beside them are protected under the Plant Breeders Rights Act 1994.
GRDC code: DAQ00192 Farming Systems Initiative
GRDC Project Code: DAQ1406-003RTX,
Was this page helpful?
YOUR FEEDBACK

