Hot vs cold: balancing risks associated with abiotic stresses in wheat
Author: Felicity Harris, Rick Graham, David Burch, Greg Brooke, Peter Matthews and Hongtao Xing (NSW DPI) | Date: 26 Feb 2019
Take home messages
- The optimal flowering period (OFP) to maximise grain yield potential and minimise effects of abiotic stresses varies across environments of the northern grains region (NGR)
- Grain yield is optimised by different genotype and sowing date combinations across environments
- Grain yield is primarily determined by grain number, even under terminal drought conditions, indicating late reproductive phases are most susceptible to abiotic stresses
Background
In wheat, flowering time is a critical determinant of grain yield potential. Across environments of the northern grains region (NGR), the optimal flowering period (OFP) is defined by decreasing risk of frost and increasing risk of moisture and heat stress (Flohr et al. 2017). The cost associated with lost yield potential from heat and frost stress has been estimated to be $600 million and $100 million per year respectively in south-eastern Australia (GRDC, 2016). In the NGR, a range of commercial cultivars that vary in phenology from slow developing winter types to fast developing spring types are available to sow from April–early June, to ensure that flowering occurs at an optimal time in spring.
In this paper, we present the OFP across six locations in the NGR (Figure 1) and discuss the phenology and yield responses for a core set of wheat genotypes in varied yield environments in 2018.
How does the optimal flowering period vary across the NGR?
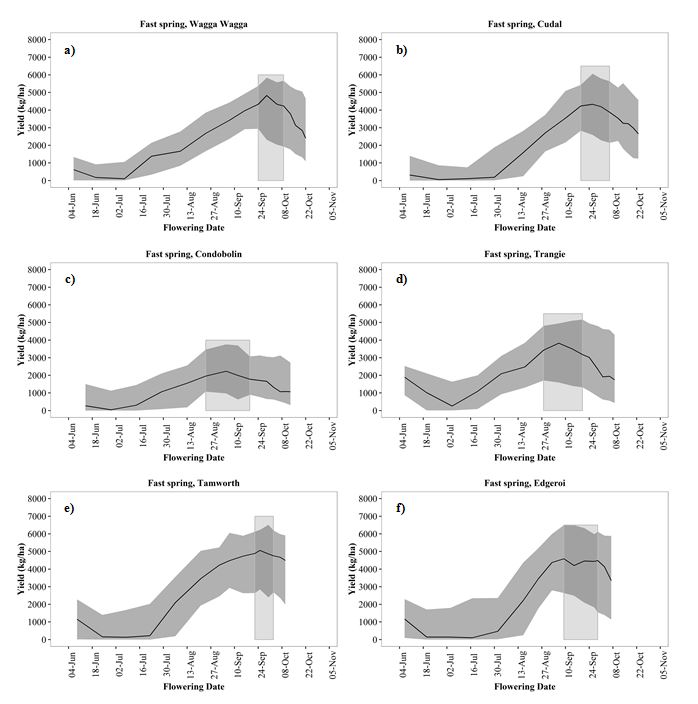
The OFP was defined from simulated wheat yield and flowering dates using the APSIM cropping systems model, based on historical climatic records (1961–2018) according to the parameters outlined by Flohr et al. (2017) for a fast spring genotype. The OFP varied significantly in timing and duration, as well as for different yield levels across environments (Figure 1). As flowering time is a function of the interaction between genotype, management and environment, the genotype x sowing time combinations capable of achieving OFP and maximum grain yield also varied across environments of the NGR (Figure 2).
Figure 1. The optimal flowering period (OFP) for a fast spring cultivar of wheat determined by APSIM simulation using methods of Flohr et al. (2017) for a) Wagga Wagga, b) Cudal, c) Condobolin, d) Trangie, e) Tamworth and f) Trangie. Black lines represent frost and heat limited yield (kg/ha), with standard deviation in grey. Shaded columns are the estimated OFP defined as ≥ 95% of the maximum mean yield.
2018 results – Wagga Wagga, Condobolin and Tamworth, NSW
Field experiments were conducted at Wagga Wagga, Condobolin and Tamworth in 2018 to determine optimal combinations of genotype x sowing date to maximise wheat grain yield. A range of genotypes with varied development (through different responses to vernalisation and photoperiod) were sown across sowing dates from early April to late May. All sites required supplementary irrigation to ensure timely establishment due to lack of reliable autumn rainfall. The Condobolin site received 30 mm prior to all sowing dates and a final irrigation of 20 mm in early September. At the Wagga Wagga site, all sowing treatments were established with 15 mm via drippers at sowing (except 3 May which was established with 6.9 mm rain 4 May), and the site was rainfed thereafter. At the Tamworth site, all sowing treatments were established with 16 mm via drippers, and a further 24 mm was applied to the site mid-July. In 2018, grain yield and phenology responses were significantly influenced by below average rainfall in combination with frost and heat stress events at all sites (Table 1).
Table 1. Growing season rainfall (GSR) from April to October (long term average (LTA) in parentheses), number of frost and heat events for Wagga Wagga, Condobolin and Tamworth sites in 2018.
Site | GSR (mm)^ | Frost events | Heat events | Comments |
|---|---|---|---|---|
Wagga Wagga | 135 (355) | 36 | 16 | 11 days <-2°C, including -4.9°C (28 Aug), -6.3°C (29 Aug), -5.4°C (30 Aug) and -3.9°C (17 Sep) |
Condobolin | 91 (246) | 30 | 15 | 11 days <-2°C. 4 consecutive days >35°C (30 Oct–2 Nov) |
Tamworth | 165 (318) | 38 | 29 | 10 days <-2°C, including -2.8°C (13 Aug) and -3.0°C (21 Aug) |
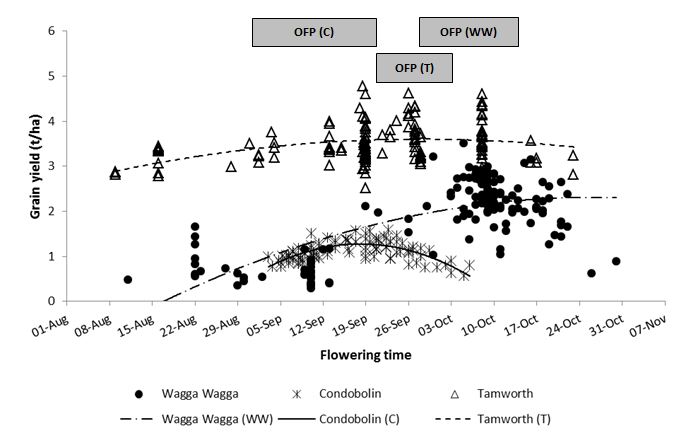
Generally, flowering date is a strong predictor of yield, with genotype and sowing date combinations that flower in late-August to mid-September at Condobolin, late September to mid-October in Wagga Wagga and late-September to early-October at Tamworth capable of achieving the highest yields, which aligns with APSIM simulations in Figure 1. In 2018, there was significant variation in grain yields for genotype x sowing date combinations which flowered within the optimal period at all sites (Figure 2).
At the Wagga Wagga site, optimal flowering time and highest grain yields were achieved by both winter type DS Bennett sown early–late April and the best performing spring types sown early-May (e.g. Beckom sown 3 May). Severe yield penalties occurred when fast developing spring wheats were sown prior to May and exposed to severe frost conditions; and when slow winter genotypes, characterised as having a strong vernalisation and photoperiod response, flowered too late and grain filling occurred under terminal drought conditions (Figure 2). At the Condobolin site, stable grain yields were achieved across sowing dates from slower spring genotypes (e.g. Cutlass and EGA Gregory), or fast winter type Longsword, as they were exposed to fewer frost events during reproductive development and were better able to utilise late October rainfall. Whilst slow-mid winter type DS Bennett flowered too late for the earlier OFP of Condobolin. In contrast, despite the lack of rainfall early in the growing season at Tamworth, highest yields were achieved by winter and slow spring types sown April–early May which were able to utilise August–October rainfall (Figure 2).
Figure 2. The relationship between flowering date and grain yield of genotypes with varied phenology patterns sown early April–late May at Wagga Wagga (WW), Condobolin (C) and Tamworth (T) in 2018. Shaded bars (e.g. OFP (C) for Condobolin) indicate APSIM simulated Optimal Flowering Period (OFP) for the three sites.
Timing of stress and yield development
The timing and duration of specific development phases are directly related to the formation of the key grain yield components - grain number (per unit of area) and individual grain weight. During the vegetative phase, leaves and tillers are formed prior to the transition into the reproductive phase, which coincides with the start of spikelet development. Spikelet primordia continue to be initiated until early stem elongation. From here until flowering, rapid growth (accumulation of biomass), spike growth and differentiation occur, thus maximum grain number is determined during this time. This phase is known to be the critical period for yield determination, and as such, grain yield is very sensitive to stress, and any limitation to the crop at this time results in reduction in grain number (Fischer, 1985). After flowering, and during the grain-filling phase, the embryo develops, producing viable seed for the subsequent generation, this phase coincides with the establishment of grain weight.
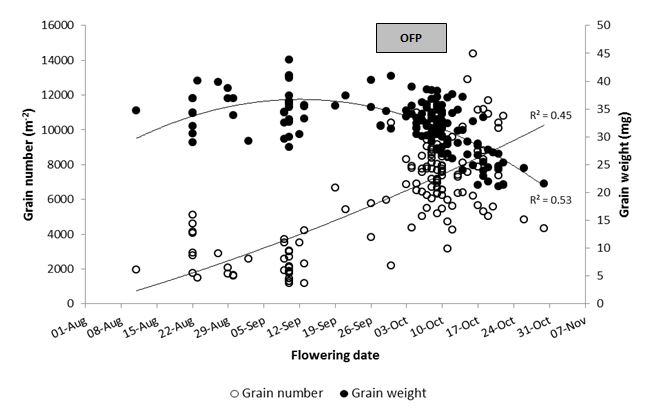
The extent to which timing of stress events influences yield formation is highlighted in Figure 3, which illustrates the relationship between flowering time with grain number and grain weight at the Wagga Wagga site in 2018. Treatments which flowered earlier than the OFP, and were exposed to frost events, had reduced grain number, whilst treatments which flowered later than the OFP, and were exposed to heat and moisture stress during grain filling, had lower grain weights.
Figure 3. Relationship between flowering date with grain number and grain weight for genotypes with varied phenology patterns sown early April-late May at Wagga Wagga in 2018. Shaded bar indicates APSIM simulated Optimal Flowering Period (OFP) for Wagga Wagga site.
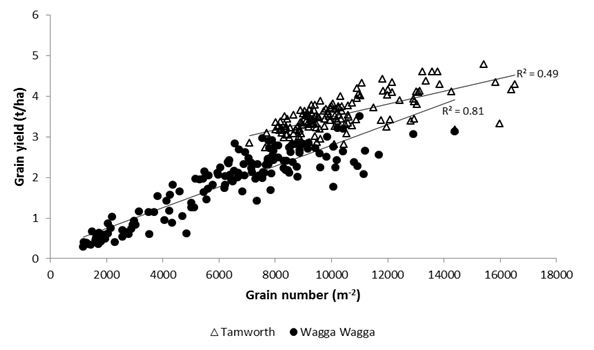
Despite the critical importance of the timing of stress events with corresponding yield components, grain yield has been more closely associated with grain number than grain weight in cereals, and this relationship has been maintained in environments characteristic of terminal drought or in low yielding seasons such as 2018 (Figure 4).
Figure 4. Relationship between grain yield and grain number for genotypes with varied phenology patterns sown early April-late May at Wagga Wagga and Tamworth in 2018.
Summary
We determined that the OFP, and the genotype x sowing date combinations which achieved the OFP and maximum yield varied between the locations. Variation across the sites was largely attributed to seasonal water supply and demand, and temperature extremes. The relationship between grain yield with grain number and grain weight indicated that yield losses are directly associated with timing of stress. However, even under the severe drought conditions in 2018, grain yield was primarily associated with grain number, reaffirming that the critical period for yield determination in wheat is from early stem elongation until flowering.
Acknowledgements
Sincere thank you for the technical assistance of Hugh Kanaley, Cameron Copeland, Dean Maccallum and Hayden Petty at the Wagga Wagga site; Nick Moody, Leisl O’Halloran, Karen Brangwin and Daryl Reardon at the Condobolin site; and Stephen Morphett, Michael Dal Santo Jim Perfrement, Jan Hosking and Bruce Haig at the Tamworth site.
We also acknowledge the support of NSW DPI and their cooperation at the Wagga Wagga Agricultural Institute, Condobolin Agricultural Research and Advisory Station and Tamworth Agricultural Institute.
This research was a co-investment by GRDC and NSW DPI under the Grains Agronomy and Pathology Partnership (GAPP) project.
References
Barr, R (2016) Diversity the key to balancing frost heat risks. https://grdc.com.au/news-and-media/news-and-media-releases/south/2016/01/diversity-the-key-to-balancing-frost-heat-risks
Fischer RA (1985) Number of kernels in wheat crops and the influence of solar radiation and temperature. Journal of Agricultural Science 105, 447-461
Flohr BM, Hunt JR, Kirkegaard JA and Evans JR (2017) Water and temperature stress define the optimal flowering period for wheat in south-eastern Australia. Field Crops Research 209, 108-119
Contact details
Felicity Harris
NSW Department of Primary Industries, Wagga Wagga
Mb: 0458 243 350
Email: felicity.harris@dpi.nsw.gov.au
Twitter: @FelicityHarris6 and @NSWDPI_Agronomy
Rick Graham
NSW Department of Primary Industries, Tamworth
Mb: 0428 264 971
Email: rick.graham@dpi.nsw.gov.au
Twitter: @RickGraham15 and @NSWDPI_Agronomy
Varieties displaying this symbol beside them are protected under the Plant Breeders Rights Act 1994.
GRDC code: DAN00213
GRDC Project Code: DAN00213,
Was this page helpful?
YOUR FEEDBACK


