Insects – tools for forecasting risks to enable proactive management
Author: James Maino, Garry McDonald and Paul Umina (cesar Pty Ltd; The University of Melbourne) | Date: 26 Feb 2019
Take home messages
- Forecasting tools for crop pests and beneficials increase confidence in when intervention is or is not needed.
- Risk factors associated with the continued spread of redlegged earth mite (RLEM) resistance (besides high pesticide usage) include high winter rainfall, low summer rainfall, low temperature variability (e.g. coastal) and a longer growing season. Growers and advisers can access a resistance testing service at no charge.
- Other grains pests predicted to be at high risk of resistance evolution include oat aphid, Lucerne flea, cabbage aphid and cowpea aphid. Special attention should be paid to these pests in the field, and in particular, their response to chemical applications.
- Preliminary data collection and forecasting of Russian wheat aphid (RWA) damage potential highlight the importance of minimising early season colonisation events, while later stage colonisation is associated with lower risk of yield loss. Forecasting will be crucial for estimating impacts under novel conditions.
- Increased certainty about pest risks (and mitigating factors e.g. beneficial insect presence) can be achieved through better forecasting and monitoring methods and will be vital in transitioning to more proactive, sustainable and cost-effective pest management.
Background
Better pest management decisions are limited by the industry’s ability to monitor and forecast pest risk. However, pest forecasting tools are increasingly available to help growers plan their pest monitoring and management programs. For example, growers often use the simple Etiella day-degree model to help predict the timing of possible emergence of adult Etiella moths near lentils, and time their management accordingly. This ultimately increases the longevity of control options and creates enduring farm profitability.
Pest control practices can often be quite ‘reactive’ because adverse outcomes, such as resistance, are difficult to predict. Forecasting tools, through their improved ability to predict risks, will increase certainty about pest outcomes and help to prioritise monitoring, which together lead to more proactive management. This ultimately results in more effective and sustainable pest management strategies.
While there has been strong progress in recent years, many forecasting tools are still in development. This paper provides an overview of some recently completed, ongoing and future research on forecasting tools. Practical management advice is provided wherever possible, but another aim is to increase awareness of the opportunities for improving pest management in this rapidly developing field.
Completed research
Predicting resistance distributions: Where is resistance in redlegged earth mites most likely to appear?
While resistance in RLEM (Halotydeus destructor) has been detected in Western Australia (WA) as far back as 2006 (Umina 2007), resistance has only recently emerged in eastern Australia (Maino et al. 2018a). The recent appearance of resistance in RLEM in near-coastal regions in South Australia (SA) was predicted in 2016 using a model that identified the biological and cultural processes driving resistance evolution in WA and from this, inferred areas of high risk in other parts of Australia (Maino et al. 2018b). Risk factors included particular climatic conditions, in addition to more widely acknowledged risk associated with high pesticide usage. This was presented at the Australian Annual Resistance Meeting (2016) as a map of resistance risks in Australia (Figure 1) when resistance had not yet been detected in eastern Australia. This forecasting tool has helped to identify regions or properties where there is a higher risk of resistance evolution, and based on this, focused resistance surveillance activities on these areas. Genetic studies have since revealed the range of resistance is expanding through both the spread of existing resistant populations, as well as independent evolution of new resistant populations, highlighting the importance of farm biosecurity and minimising selection pressure by reducing insecticide usage.
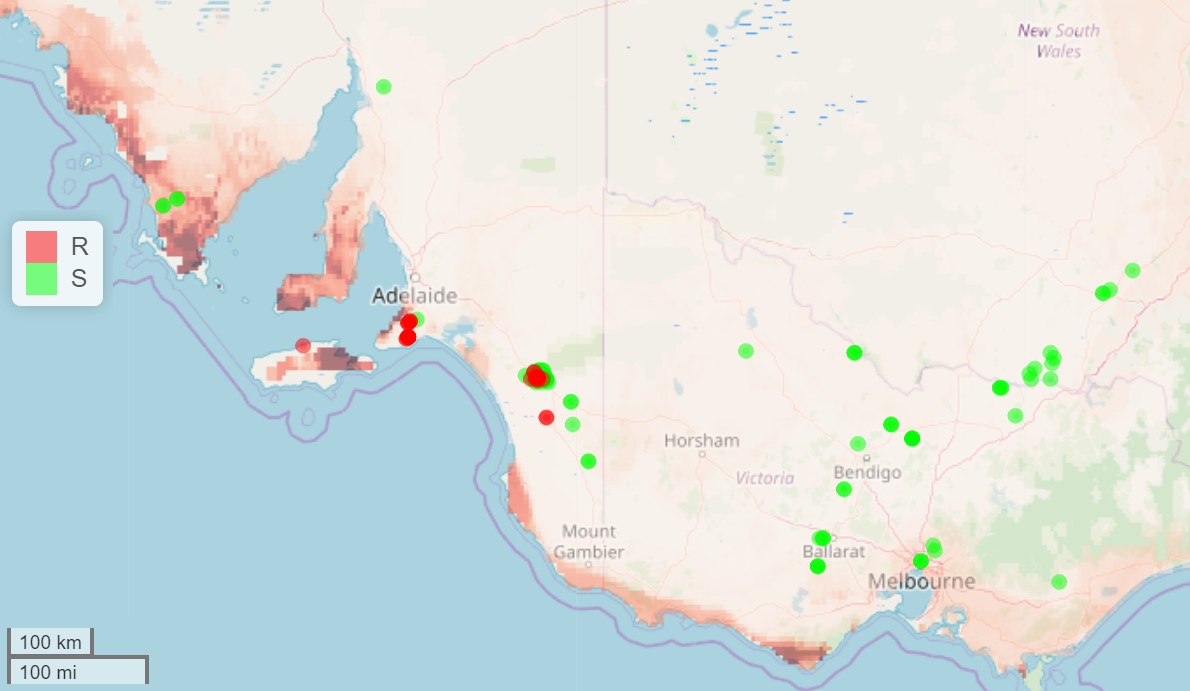
Figure 1. Predicted pyrethroid resistance risk in RLEM (higher risk indicated by darker shading) with observed resistance (dark circles) and susceptible sites (light circles) overlaid. The prediction was generated in 2016 based on patterns of resistance observed in WA (Maino et al. 2018b). Since then, resistance has emerged in eastern Australia near locations predicted to be high risk. Spread occurs through dispersal of existing resistant populations, as well as independent evolution of new resistant populations.
Recommended action includes additional attention when monitoring responses of RLEM populations to pesticides in regions with high winter rainfall, low summer rainfall and longer growing season, and where there has been historically high pesticide usage (Maino et al. 2018b). In such areas, the use of pesticides when RLEM populations are present should be carefully considered, and if applied, the efficacy should be routinely monitored. Populations that are suspected to be resistant should be reported to cesar who can provide resistance testing at no cost to growers through GRDC support. The earlier resistance is detected, the more options there are for management.
Predicting resistance in pests: Which grains pests are at risk of evolving resistance in the future?
There is a need to be more proactive about which pests may acquire a novel resistance. In a recent project, the resistance risk of 90 commonly encountered grains pests was assessed so the industry could prioritise monitoring and management.
A model was built that combined international data on the evolutionary resistance potential of each pest and the local selection pressure (insecticide use intensity) to which the pest is typically exposed (targeted and off-target pesticide applications). From this, a weighted score was assigned to each pest. Pests were then ranked from highest to lowest by their capacity to develop resistance in an Australian grains system. The analysis made some necessary simplifying assumptions. For example, selection pressure outside of grains was unable to be considered (such as chemical usage in horticulture), pesticide exposure was assumed to correlate with proxies such as the relative incidence of PestFacts reports for each pest, and native pests that have broad native host ranges were assumed most unlikely to have the same intensity of pesticide exposure as cosmopolitan pests with restricted agronomic host ranges. Despite these assumptions, the tool successfully ranked highly all the pests with known resistance (Table 1), even though information on actual resistance was not used to assign risk scores. These pests include green peach aphid (GPA), RLEM, cotton bollworm and diamondback moth. This validates the approach taken while also highlighting the future risk of further resistance evolution (e.g. to new chemical groups) in these notorious pests. The predictions, and the basic model tenets underpinning them, also serve as an important reminder that resistance is an incredibly dynamic evolutionary process in invertebrates.
From within the top nine ranked pests (Table 1), those not known to be resistant that are at greatest risk of acquiring resistance are oat aphid, Lucerne flea, cabbage aphid, cowpea aphid and the European earwig. Oat aphid ranks highly because of the large areas of wheat (and other crops) that can receive broad-spectrum insecticide applications. Cowpea aphid (pulses) and cabbage aphid (canola) are also strong resistance candidates because they can be unintentionally sprayed when crops are sprayed for other pests such as native budworm, Etiella and diamondback moth. Lucerne flea and earwigs, which are relatively poor dispersers, are invariably present in or under most crops, sometimes in low numbers, but would regularly be exposed to insecticides when a crop is sprayed for other pests.
Chemical controls of these pests should be carefully considered, and if applied, special attention should be paid to their responses to pesticides.
Table 1. The top nine grains pests selected for their evolutionary potential to acquire resistance from 90 grains pests considered. These pests are assessed against four criteria.
Common name | Scientific name | Dominant crop stage | Evolutionary potential rank§ | Targeted pesticide | Target and off-target pesticide | Mean rank |
|---|---|---|---|---|---|---|
Green peach aphid* | Myzus persicae | Establishment | 1 | 5 | 3 | 3.0 |
Oat aphid | Rhopalosiphum padi | Vegetative | 7 | 7 | 1 | 5.0 |
Redlegged earth mite* | Halotydeus destructor | Establishment | 17 | 1 | 2 | 6.7 |
Diamondback moth* | Plutella xylostella | Flower/seed | 4 | 4 | 13 | 7.0 |
Lucerne flea | Sminthurus viridis | Establishment | 14 | 2 | 7 | 7.7 |
Cabbage aphid | Brevicoryne brassicae | Vegetative | 8 | 9 | 8 | 8.3 |
Cowpea aphid | Aphis craccivora | Vegetative | 2 | 8 | 16 | 8.7 |
Cotton bollworm* | Helicoverpa armigera | Repro | 3 | 18 | 9 | 10.0 |
European earwig | Forficulina auricularia | Establishment | 19 | 12 | 4 | 11.7 |
§ Numbers provide the pest ranking for each of the three criteria.
*These pests have already acquired resistance to some modes of action (MoAs).
Predicting the need for and timing of monitoring and spray interventions
Understanding pest lifecycles is often a crucial component of management. For example, if native budworm moths are detected, how long would it take for eggs to hatch into larvae and be detected in sweep nets before economic damage commences? Pest development depends strongly on temperature in very predictable ways. If the location and insect stage are known, the developmental trajectory of the pest can be forecast with high precision, which reduces uncertainty in management decisions. We have developed the DARABUG2 program, as an integrated and interactive platform for different pest phenology models, to provide a convenient means of predicting development times for a range of different insect pests. It illustrates how complex biological knowledge on species development can be presented in a simple and dynamic way that is context specific. While still only available as a research and extension tool for grains entomologists in the National Pest Information Service, similar tools could readily be made available to other practitioners given demand. Currently, this tool can be accessed via proxy through contacting your local state agriculture department or cesar.
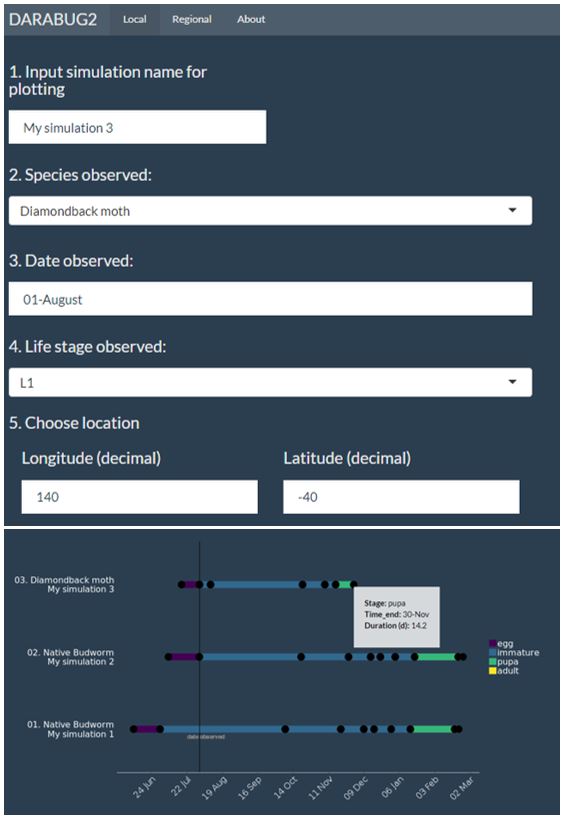
Figure 2. A screenshot of DARABUG2 – an interactive pest development forecasting tool used by entomologists in the National Pest information Service that illustrates how complex biological knowledge on species development can be presented in a simple and dynamic way that is context specific.
Ongoing research
Predicting Russian wheat aphid impact in Australian grains - yield loss and management response
First detected in Australia in 2016, RWA (Diuraphis noxia) is a new pest for grain growers and so there is a need to understand expected yield impacts and best management practices in an Australian context. Part of an ongoing GRDC research investment addresses these gaps through national field trials, surveillance, and forecasting approaches for colonisation risk and subsequent yield impact potential. Forecasting tools are being used to draw together and synthesise data collected over 2018 and 2019, in different locations and infestation scenarios. This tool will allow an estimation of colonisation risk and impacts across other cropping systems not studied, such as different years, crop varieties, regions and infestation scenarios. This work is ongoing, but the below example aims to illustrate the use of predictive modelling to extend data collected from field trials into novel conditions not studied in field trials.
As RWA is a cosmopolitan pest, existing international research on RWA is leveraged wherever possible to extend the reach of the model. For example, a study conducted by Ma and Bechinski (2009) on RWA feeding on barley revealed that population growth and thus damage potential of RWA is strongly dependent on both environmental temperature and on crop growth stage. Earlier crop growth stages almost always favoured higher RWA population growth potential, while higher temperatures up to an optimum also favoured higher growth rates (Figure 3).
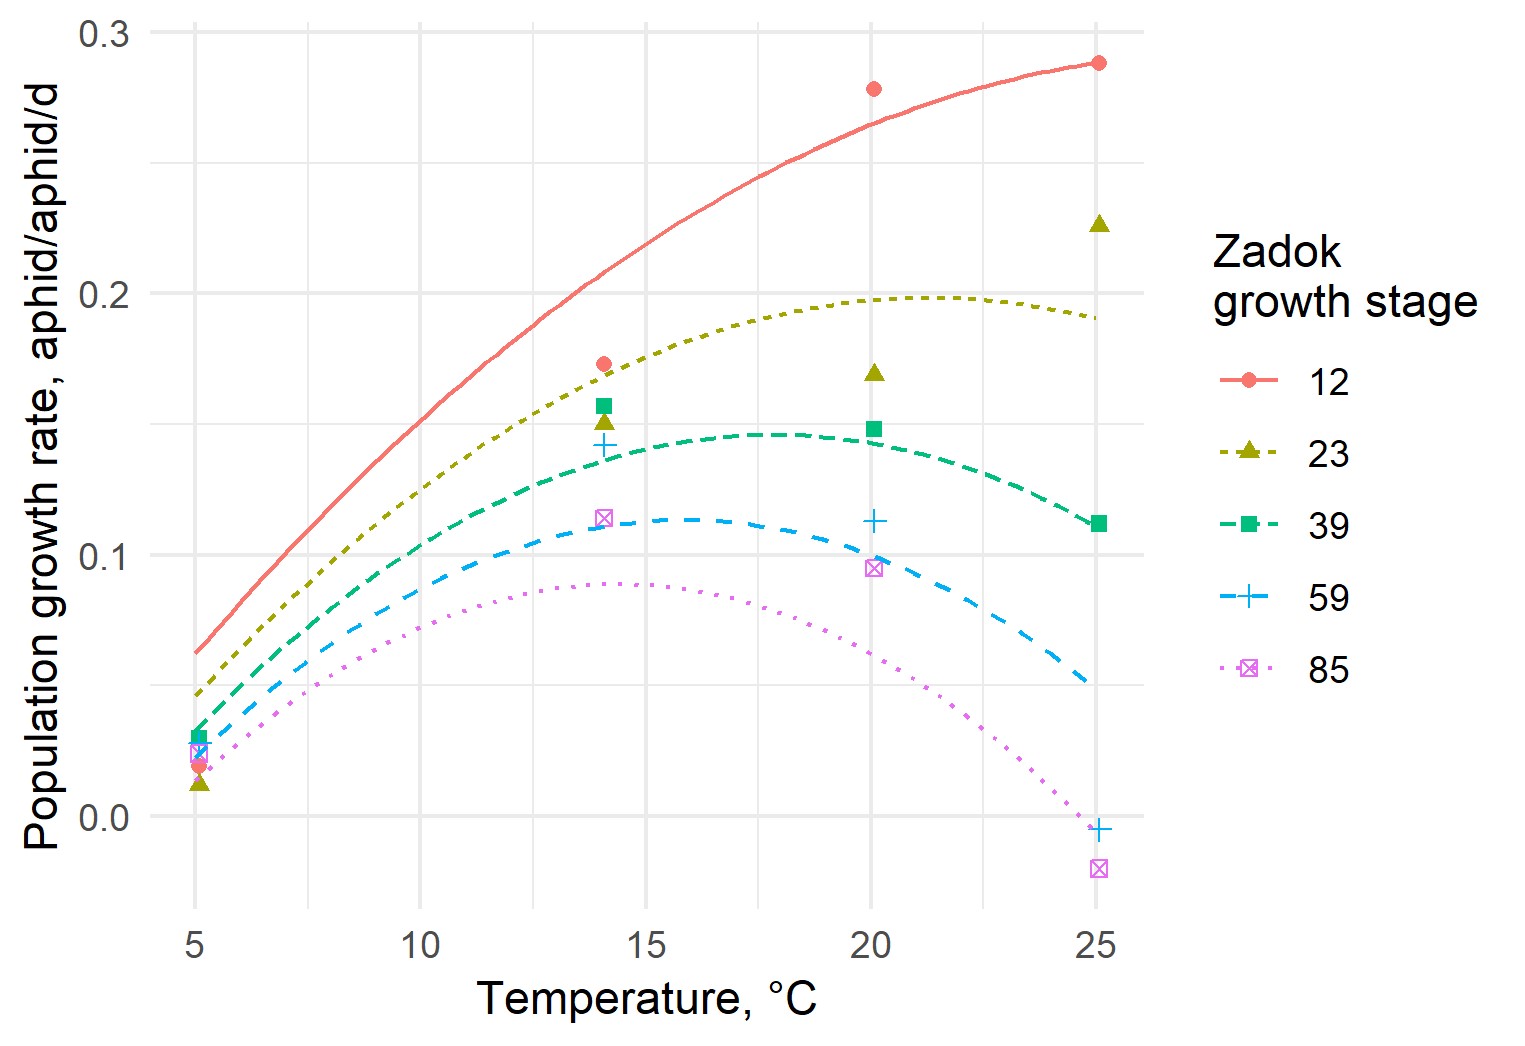
Figure 3. Earlier crop growth stages favour higher RWA growth potential. A model was developed to explain yield loss observed in current field trials using experimental data collected by Ma et al. (2009) on RWA population growth rate and its relationship with plant growth stage at establishment and rearing temperature.
This knowledge was incorporated into a model of RWA growth. To forecast crop growth, the existing Australian Agricultural Production Systems sIMulator (APSIM) model on cereal growth (Keating et al. 2003) was used by linking it to the RWA population growth model through the assumption that feeding damage was related to the number of RWA on the plant with RWA population growth as shown in Figure 3.
At the time of writing, field trials and green bridge surveillance activities for the first year are still underway and will not be reported. Instead, conditions from one field site (Birchip), for one wheat variety (Scepter) for which data has already been collected will be considered. It is important to not over generalise these findings. Only five treatment scenarios were considered for model validation, but the numbers of scenarios can be vastly expanded using a simulation approach. In the forecasting exercise here, 378 treatment scenarios are considered to better quantify the yield impact of RWA colonisation time (when they arrive on the crop) and management time (how long after RWA establishment management occurs). The model assumes that RWA populations do not cause damage after the time of first control (e.g. through follow up management). The yield impacts estimated across these scenarios are summarised in Figure 4.
Results highlight the importance of minimising the risk of early colonisation of RWA at early growth stages to avoid large yield losses. However, even with early colonisation, losses could be avoided through prompt control, with the requirement for prompt control diminishing throughout the season until control eventually offers minimum yield benefits. Thus, monitoring should be more frequent during crop establishment. RWA populations colonising the crop at later growth stages are unlikely to economically impact yield.
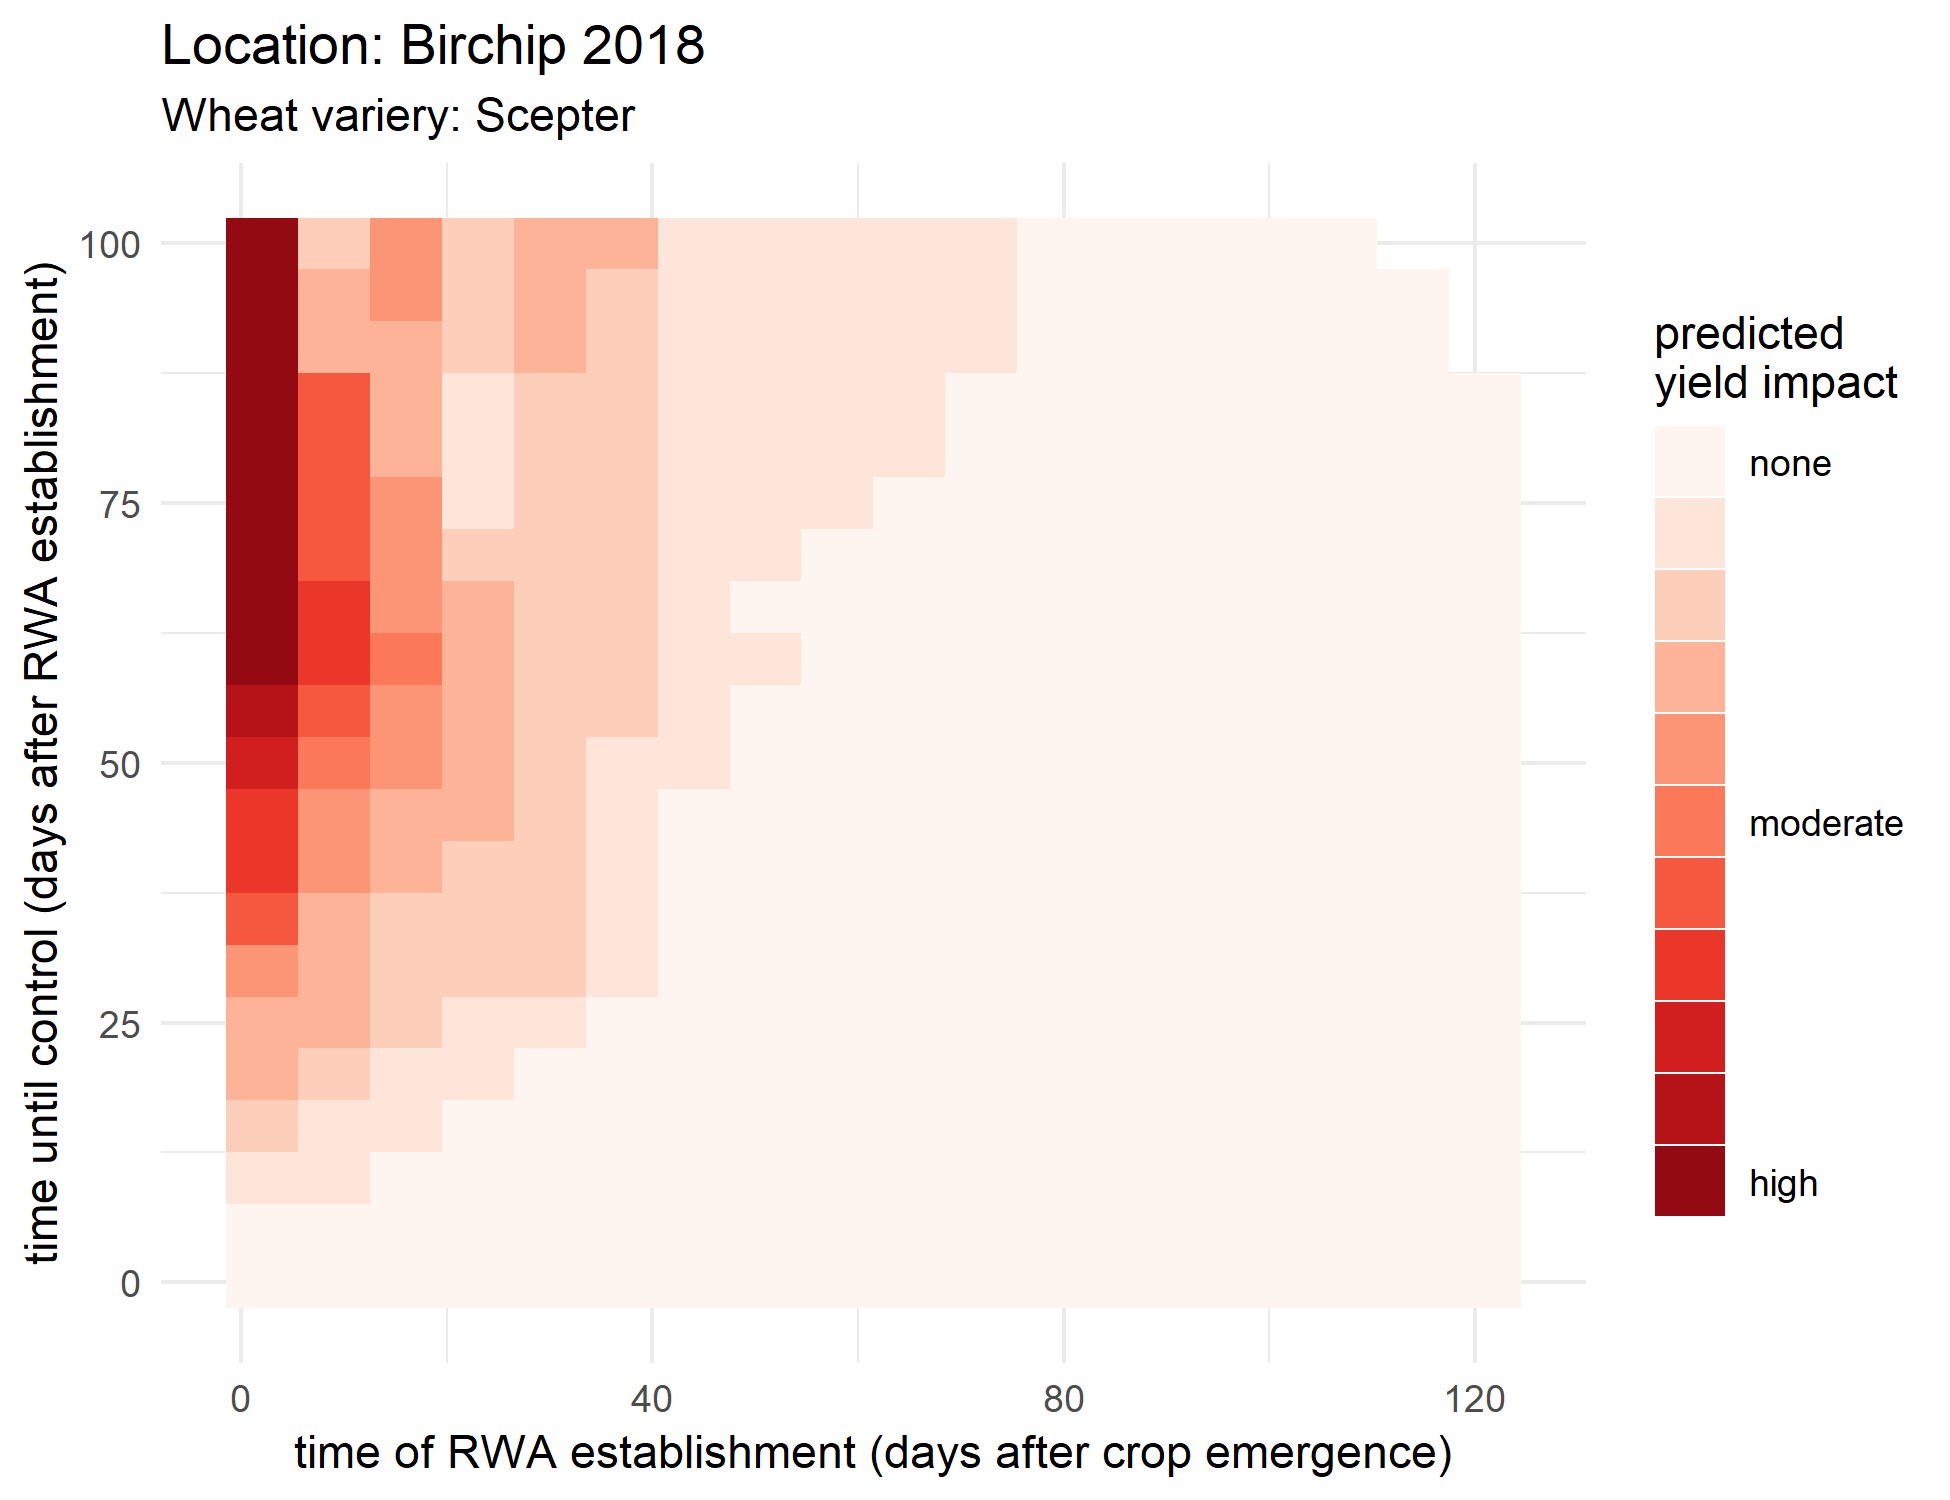
Figure 4. The estimated relationship between yield impact and colonisation time of RWA feeding on wheat (Scepter) and intervention time for 2018 Birchip field trial conditions based on a preliminary model for forecasting RWA damage potential under different climates, management, crop and pest conditions.
Future research
The completed and ongoing research presented highlights how pest forecasting is currently helping to reduce uncertainty about pest risks to prioritise monitoring and management. These examples have also highlighted that management recommendations will need to vary depending on the specific growing context (e.g. climatic conditions, region, stage of crop, stage of pest).
While ‘rules of thumb’ management principles are frequently useful, they are typically fixed across varied contexts or seasons (such as static economic thresholds). Management advice needs to remain simple and comprehensible, but dynamic so that it can respond to different situations (e.g. dynamic economic thresholds that depend on crop stage). Utilising the increasing functionality, affordability and availability of digital systems will also help.
Future opportunity - incorporating beneficial insects into economic thresholds
More sustainable pest management practices require reduced reliance on chemical control and greater utilisation of biological control. However, a large knowledge gap impeding this transition is the uncertainty surrounding required levels of beneficial predators or parasites to mitigate pest damage. One solution to this problem is to link known population growth dynamics of beneficial insects with pest population dynamics (just as pest dynamics were linked to crop dynamics in the RWA example provided above). From here, an estimate of pest population growth potential could be made that considers the impact of beneficial populations. In an interface similar to DARABUG2, local conditions such as climate region, crop stage, beneficial abundance and pest abundance could be used to drive the model. This would generate an estimate of pest population growth and expected yield loss which would be used to assess the cost-effectiveness of control. Currently available economic thresholds for grains crops do not consider the presence of beneficial insects as mitigating factors. Though often not practical, frequent monitoring can overcome these issues through repeated manual assessments of pest and beneficial populations through time to estimate rates of pest increase.
Useful resources
Etiella degree day model:
Redlegged earth mite resistance management strategies:
https://grdc.com.au/FS-RLEM-Resistance-strategy-West
https://grdc.com.au/FS-RLEM-Resistance-strategy-South
Russian wheat aphid tips and tactics
References
Cheng X, Hoffmann AA, Maino JL, Umina PA (2018). A cryptic diapause strategy in Halotydeus destructor (Tucker) (Trombidiformes: Penthaleidae) induced by multiple cues. Pest Manag Sci 74:2618–2625. doi: 10.1002/ps.5053.
Keating BA, Carberry PS, Hammer GL, et al (2003). An overview of APSIM, a model designed for farming systems simulation. Eur J Agron 18:267–288.
Ma Z, Bechinski EJ (2009). Life tables and demographic statistics of Russian wheat aphid (Hemiptera: Aphididae) reared at different temperatures and on different host plant growth stages. Eur J Entomol 106:205–210. doi: 10.14411/eje.2009.026.
Maino JL, Binns M, Umina P (2018a). No longer a west-side story - Pesticide resistance discovered in the eastern range of a major Australian crop pest, Halotydeus destructor (Acari: Penthaleidae). Crop Pasture Sci 69:216–221. doi: 10.1071/CP17327.
Maino JL, Umina PA, Hoffmann AA (2018b). Climate contributes to the evolution of pesticide resistance. Glob Ecol Biogeogr 27:223–232. doi: 10.1111/geb.12692.
Umina PA (2007). Pyrethroid resistance discovered in a major agricultural pest in southern Australia: the redlegged earth mite Halotydeus destructor (Acari: Penthaleidae). Pest Manag Sci 63:1185–1190. doi: 10.1002/ps.
Acknowledgements
The research presented here is made possible by the significant contributions of growers through both trial cooperation and the support of the Grains Research and Development Corporation. The authors would like to thank them for their continued support. We would also like to acknowledge other collaborators including Julia Severi (cesar), Elia Pirtle (cesar), Jessica Lye (cesar), Ary Hoffmann (University of Melbourne), Owain Edwards (CSIRO), Jenny Reidy-Crofts (CSIRO), Matthew Binns (CSIRO), Greg Baker (PIRSA), Maarten van Helden (PIRSA), Tom Heddle (PIRSA), Kym Perry (PIRSA), Svetlana Micic (DPIRD), and Alan Lord (DPIRD). The authors also acknowledge the assistance of Ken McKee and David Landmeter (Syngenta Australia), Shane Trainer (Bayer Crop Science) and Colin Edmondson (Advanta Seeds).
Contact details
James Maino
cesar Pty Ltd
293 Royal Parade, Parkville VIC
03 9349 4723
jmaino@cesaraustralia.com
@cesaraustralia
Paul Umina
cesar Pty Ltd
293 Royal Parade, Parkville VIC
03 9349 4723
pumina@cesaraustralia.com
@cesaraustralia
Was this page helpful?
YOUR FEEDBACK