National Paddock Survey – closing the yield gap and informing decisions
Take home messages
(from work undertaken on 16 paddocks in north west (NW) Victoria, 2015 to 2018)
- Intensive monitoring of soils and crops over a rotation sequence has identified why crops do not achieve their potential yield.
- Reviewing paddock performance at the end of the season and using paddock records are essential for sustained improvement in agronomic performance. The average yield gap of wheat and barley over four years of monitoring in the southern Mallee and Wimmera was 22%.
- Over the four-year rotation, 32 paddock zones were intensively monitored (128 paddock zone records). Out of these, 56 paddock zones were planted to wheat and barley, and 14 to canola. 2016 and 2017 were generally wet years with above average crop yields. 2015 and 2018 were dry with low yields. Insufficient nitrogen (N) was the main cause for the yield gap in 15 paddock zones, with the majority occurring in 2016. No N deficiencies were recorded in 2018. Diseases, weeds and insects also contributed, but were less severe in impact. Frost and heat shock were also significant causes of the yield gap, particularly in 2017 and 2018.
Background
Yield gap is the term applied to the difference between achieved and potential yield, where potential yield is estimated from simulation models. On average, Australia’s wheat growers are currently estimated to be achieving about half their water-limited potential yield (Hochman et al. 2016, Hochman and Horan, 2018). Previous research with individual growers in the Wimmera/Mallee in Victoria determined that the long-term yield gap for those growers was approx. 20% (van Rees et al. 2012). For a national overview of the estimated yield gaps, see www.yieldgapaustralia.com.au
The National Paddock Survey (NPS) is a four-year (2015 to 2018) GRDC supported project designed to quantify the yield gap on 250 paddocks nationally and to determine the underlying causes. Further, its aim is to establish whether management practices can be developed to reduce the yield gap to benefit farm profitability. The project aims to provide growers and their advisers with information and the tools required to close the yield gap.
Method
Nationally, 250 paddocks, 80 in each of Western Australia (WA) and northern New South Wales (NSW)/Queensland, and 90 in southern NSW, Victoria and South Australia (SA), were monitored intensively over a four-year rotation (2015 to 2018). Consultants and Farming Systems groups undertook the monitoring. Two zones in each paddock were monitored at five geo-referenced monitoring points along a permanent 200m to 250m transect. Each monitoring point was visited four times per season (pre-season and post-season soil sampling and in-crop at the equivalent crop growth stages of GS30 and GS65). Yield map data was obtained for each paddock which enabled the yield of each zone to be determined accurately. Table 1 lists the annual monitoring undertaken in each zone.
All paddocks were simulated with the Agricultural Production Systems sIMulator (APSIM) (Holzworth et al. 2014) and, during the season, Yield Prophet® was available to all consultants and growers.
The whole data set (four years x 500 paddock zones) is being analysed by Roger Lawes, CSIRO, for factors primarily responsible for the yield gap in each of the three GRDC regions (Lawes et al. 2018).
This paper outlines the results of sixteen paddocks monitored by two consultants, Kelly Angel from the Birchip Cropping Group (BCG) and Craig Muir from AGRIvision working in the southern Mallee and Wimmera, Victoria. The results are discussed as a paddock specific yield gap analysis over four seasons focused on outcomes for the grower and the consultant.
Results are presented as the modelled APSIM simulations in which:
- Ya = Actual yield (as determined for each zone from yield map data).
- Ysim = Simulated yield (for the same conditions as those in which the crop was grown).
- Yw= Simulated water limited, N unlimited yield (for the same conditions as those in which the crop was grown, but with N supply unlimited). Yw is considered the potential yield for the crop.
Note: APSIM currently accurately simulates wheat, barley and canola. We have not attempted to simulate the other crop types grown (lupins, lentils, faba beans, chickpeas, vetch, field peas).
The yield gap is calculated as the % difference between Yw and Ya using the equation ((Yw-Ya)/Yw).
Table 1. Overview of monitoring and data collected per zone for each NPS paddock.
Monitoring | Timing | Monitoring | Timing |
|---|---|---|---|
Deep soil test 4 depths (0-100cm) | Pre-sow | Paddock yield and yield map data | Post-harv |
PREDICTA® B (0-10cm) | Pre-sow | Crop density, weeds, foliar diseases, insects (/m2) | GS30 |
Deep soil test 4 depths (0-100cm) | Post-harv | Cereal root sample to CSIRO | GS30 |
Crop and variety | Weeds, foliar diseases, insects/m2) | GS65 | |
Sowing date and rate | Cereal stubble/crown for Fusarium | Post harv | |
Fertiliser, herbicide type, rate, date | General observations | ||
Temp buttons (1 per paddock) | GS60-79 |
Data was entered via the NPS website and stored in a purpose-built SQL Server database.
Results and discussion
Annual individual paddock results
Data from four paddocks in the Victorian southern Mallee and Wimmera are presented as examples of outputs as informed by the paddock monitoring.
Example 1. Rotation southern Mallee: Vetch (2014), followed by wheat, barley, lentils, wheat.
Paddock southern Mallee. NPS 3324 Zone A: sandy clay loam Ya=Actual yield; Ysim=Simulated yield; Yw=Water limited N unlimited yield (potential yield). | |
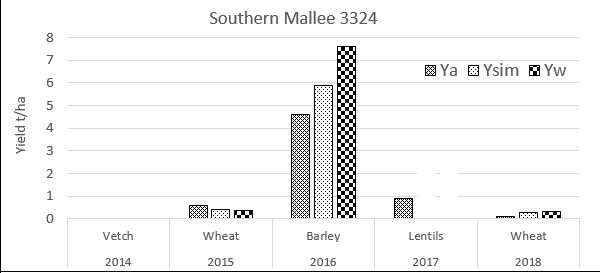 | |
Paddock and crop information over the rotation. (Note - nd is ‘not detected’) N available* 2015 (following vetch): 68kg/ha N available 2016 (following wheat): 124kg/ha N available 2017 (following barley): 60kg/ha N available 2018 (following lentils): 56kg/ha Water available# 2015: 16mm Water available 2016: 143mm Water available 2017: 102mm Water available 2018: 16mm Note: * N available = pre-sowing # Water available = water pre-sowing | |
Disease PREDICTA® B: 2015 Fusarium & YLS Mod Root health GS30: 2016 Mod disease level 2016 v low In-crop GS65: not detected Weeds In-crop GS65: not detected Insects: not detected | Days of heat and frost during GS60-79 Heat > 34oC Frost 0 to -2 -2 to -4 oC 2015 2 0 0 2016 0 1 0 2017 0 1 0 2018 1 0 0 (note: temperature records from nearest BoM) |
Interpretation
Crop 2014: Vetch
Wheat 2015: Very low yield, in-crop rain 148mm (Decile 1 season).
Barley 2016: Ya<Ysim<Yw. N unlimited yield (Yw) was 1.5t/ha higher than the simulated yield (Ysim), indicating the crop was N deficient. Ya<Ysim indicates that factors other than N had an impact on the crop, possibly moderate levels of disease, and one frost event during flowering/grain filling.
Wheat 2018: Very low yield, in-crop rainfall 131mm (Decile 1 season).
Example 2. Rotation southern Mallee: Vetch (2014), followed by wheat, barley, vetch, canola.
Paddock southern Mallee. NPS 3240 Zone A: sandy clay loam Ya=Actual yield; Ysim=Simulated yield; Yw=Water limited N unlimited yield (potential yield). | |
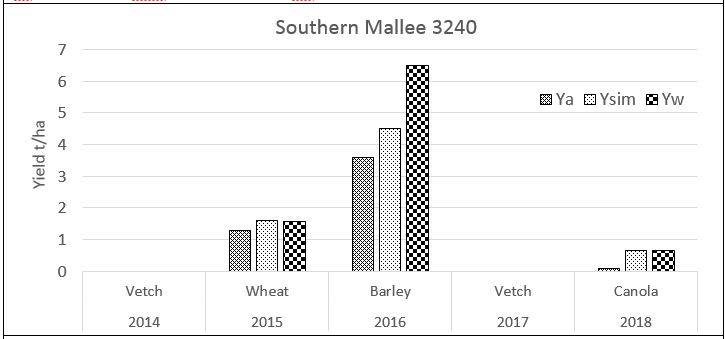 | |
Paddock and crop information over the rotation. (Note - nd is ‘not detected’) N available* 2015 (following vetch): 103kg/ha. N available 2016 (following wheat): 61kg/ha N available 2018 (following vetch) : 115kg/ha Water available# 2015: 32mm Water available 2016: 53mm Water available 2018: 11mm Note: * N available = soil N pre-sowing # Water available = soil water pre-sowing | |
Disease PREDICTA® B: 2015 Rhizo, Bipolaris, YLS Mod 2016 Rhizo, Bipolaris High Bipolaris, Prats Mod Root health GS30: 2015 Mod; Rhizo Low, Prats Mod 2015 low to mod 2016 mod (Fusarium 40% stems) Disease in-crop GS65: 2016 Fusarium low Weeds in-crop GS65: 2015 Rye 2, Brome 32/m2 2016 Rye 9, Wheat 22, Brome 21/m2 2018 nd Insects: nd | Days of heat and frost during GS60-79 Heat > 34oC Frost 0 to -2 oC -2 to -4oC 2015 0 0 0 2016 1 2 0 2018 0 0 0 (note: temperature records in paddock) Consultant observations: 2015: brome grass throughout 2016: head loss 380kg/ha 2017: heavy grazing 2018: stand thin and drought stressed |
Interpretation
Crop 2014: vetch
Wheat 2015: Ya=Ysim=Yw. Crop not limited by biotic stress. Dry season: 135mm in-crop rainfall (Decile 1).
Barley 2016: Ya<Ysim<Yw. N was limiting (Ysim<Yw). Fusarium was at moderate levels (stubble assessment), some weed pressure and frost were recorded during flowering. Head loss was noted by the consultant.
Canola in 2018: Ya<Ysim=Yw very poor crop in drought year (108mm in-crop rainfall, Decile 1).
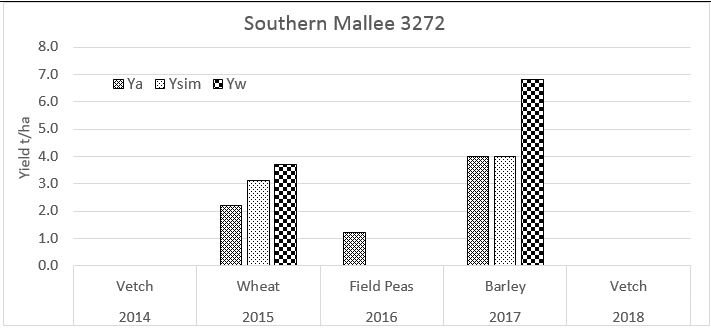
Example 3. Rotation vetch brown manure (2014), followed by wheat, field peas, barley, vetch.
Paddock Southern Mallee, Victoria. NPS 3272 Zone A: sandy loam Ya=Actual yield; Ysim=Simulated yield; Yw=Water limited N unlimited yield (potential yield). | |
| |
Paddock and crop information over the rotation. (Note - nd is ‘not detected’) N available* 2015 (following vetch): 152kg/ha. N available 2016 (following wheat): 112kg/ha N available 2017 (following field peas): 126kg/ha Water available# 2015: 59mm Water available 2016: 1mm Water available 2017: 116mm Note: * N available = soil N pre-sowing # Water available = water pre-sowing | |
Disease PREDICTA® B: 2015 Rhizoc, YLS, Pyth. mod 2016 Rhizoc, YLS high, Pyth mod 2017 Rhizoc, YLS, Pyth mod Root health GS30: 2015, 2017 Low to Mod Disease in-crop GS65: 2015 YLS low 2016 Ascoch. mod; 2017 SFNB low Weeds in-crop GS65: 2015 Brome 5/m2 2016 Brome 2, Must. 2/m2 2017 nd Insects GS65: 2015 oat aphid 80 2016 oat aphid 38 | Days of heat and frost during GS60-79 Heat > 34oC Frost 0 to -2 oC -2 to -4 oC 2015 3 2 0 2016 0 4 0 2017 0 4 0 (note: temperature records in the paddock and BoM) * Pythium root rot: all crops/pastures. Canola/pulses susceptible. Cereals less so. |
Interpretation
Crop 2014: vetch
Wheat 2015: Ya<Ysim<Yw crop was N limited (indicated by Ysim<Yw). Ya<Ysim may have resulted from the presence of moderate soil disease levels and some brome grass, two frost events occurred during flowering and grain filling.
Barley 2017: Ya<Ysim=Yw crop is N limited. Other factors did not contribute to a yield penalty (even though frost occurred during flowering in 2017).
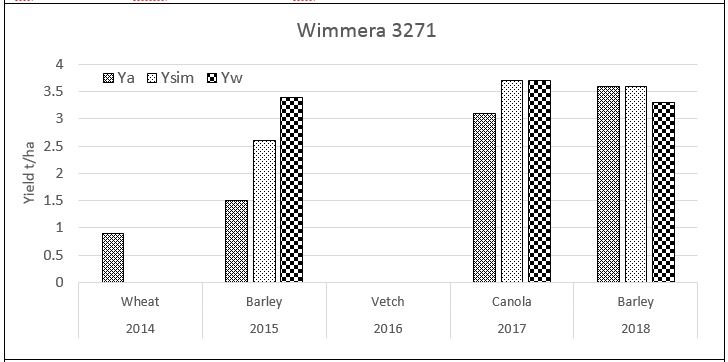
Example 4. Rotation wheat (2014), followed by barley, vetch hay, canola, barley.
Paddock Wimmera, Victoria. NPS 3271 Zone B: self-mulching black clay Ya=Actual yield; Ysim=Simulated yield; Yw=Water limited N unlimited yield (potential yield). | |
| |
Paddock and crop information over the rotation. (Note - nd is ‘not detected’) N available* 2015 (following wheat): 73kg/ha. N available 2017 (following vetch): 177kg/ha N available 2018 (following canola) : 95kg/ha Water available# 2015: 38mm Water available 2017: 146mm Water available 2018: 17mm Note: * N available = soil N pre-sowing # Water available = water pre-sowing | |
Disease PREDICTA® B: 2015,16,17 Fusarium High, Take-all Mod, Pythium Mod Root health GS30: 2016, 2017 Low to Mod Disease in-crop GS65: nd Weeds in-crop GS65: 2015 Ryegr. 3/m2, 2016 Sow thistle 6/m2 Insects GS65: nd | Days of heat and frost during GS60-79 Heat > 34oC Frost 0 to -2 oC -2 to -4oC 2015 0 3 0 2017 0 3 0 2018 0 2 0 (note: temperature records in the paddock and BoM) * Pythium root rot: all crops/pastures. Canola/pulses susceptible. Cereals less so. |
Interpretation
Crop 2014: wheat
Barley 2015: Ya<Ysim<Yw crop was N limited (indicated by Ysim<Yw). Ya<Ysim may have resulted from the presence of Fusarium (detected on the stubble) and three frost events during flowering and grain filling.
Canola 2017: Ya<Ysim=Yw crop is not N limited. The root disease Pythium was at moderate levels in the soil and three frost events occurred during flowering and grain filling.
Barley 2018: Ya=Ysim=Yw indicating the crop grew to potential.
Assessing crop performance: Water use efficiency versus modelling
The first paper on water use efficiency (WUE) was published by French and Schultz in 1984. It was a breakthrough at the time, enabling growers and agronomists to benchmark crop performance against a target and compare performance against other wheat crops. The French and Schultz WUE equation has since been updated by Sadras and Angus, 2006, and Hunt and Kirkegaard, 2012.
Hunt and Kirkegaard, 2012, calculate crop water use as: Soil water pre-sowing – soil water post- harvest + rainfall during the same period. WUE is then calculated as yield (kg/ha) / (crop water use - 60). Potential yield is calculated as 22 x (crop water use – 60).
The 2015 to 2017 Southern Mallee and Wimmera NPS cereal yields are plotted against crop water use in Figure 1. The graph reveals a general tendency for Ya to increase with crop water use with an upper boundary of yield. The upper boundary is reasonably interpreted as Yw for well-managed crops as crop water use increases. The two lines included on the diagram are the Yw lines proposed by French and Schultz, 1984, and Sadras and Angus, 2006, to describe the most efficient use of water. This establishes a common maximum WUE of 22kg/mm/ha.
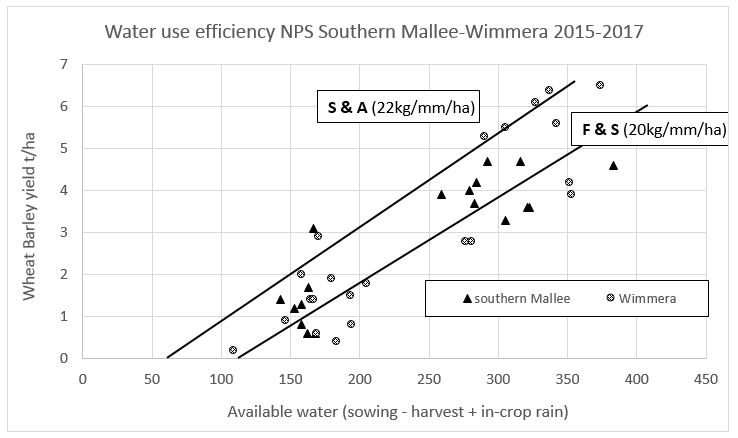
Figure 1. NPS – Southern Mallee - Wimmera cereal yields (Ya) plotted against water use (2015 to 2017).
How useful is WUE compared with computer modelled assessments of potential yield, and what will the future hold?
Figure 1 and other data analysed by French and Schultz (1984) and Sadras and Angus (2016) demonstrate a considerable variation in Ya relative to Yw, i.e. a considerable yield gap in many crops. Key questions for growers and agronomists are what is the cause of the yield gap in each individual case and how can it be alleviated?
There are many possible causes that cannot be identified without careful paddock monitoring of abiotic and biotic factors, as attempted in the present project.
We must remember that using WUE to assess yield potential is a bucket approach to a complex problem in a system with many interactions. WUE will not explain the causes of a yield gap, nor can it inform on reasons for favourable outcomes. It may identify the presence of a yield gap, but not the underlying cause(s).
Causes of yield gaps
Abiotic factors
Variability is a feature of farming in Australia and there are several reasons why crop roots cannot access soil water and nutrition such as soil type (texture) and physical and chemical limitations. Chemical and physical constraints to root development can have a large impact on potential yield such as high soil chloride levels in the southern Mallee. Frost and heat shock are two other abiotic factors which can have a large impact on crop yield.
Interactions between soil type, available soil water and the amount of water extracted by the growing crop are influenced by crop growth and the distribution and amount of rainfall. If these factors are ignored, there is limited predictive capability of yield.
Crop nutrition appropriate to achieving potential yield (Yw) is relatively well understood and in the case of N, with many examples of successful tactical responses to fertilisation. But this is not matched for other nutrients such as phosphorus (P) and potassium (K), and micronutrients such as zinc (Zn).
Biotic factors
Major infestations of weeds, pests and diseases can cause yield loss and less serious infestations may cause greater losses than is commonly appreciated and remain unknown without careful paddock monitoring.
The nature of these biotic causes of yield loss varies greatly from site to site, paddock to paddock and also within paddock.
Going forward with crop simulation models
Crop models, such as APSIM used in this study, are focused on abiotic factors, but include biotic factors such as N nutrition. Their objective is to simulate yield (Ysim) in the absence of biotic factors such as weeds, diseases and pests and to estimate Yw by removing the effect of N shortage. For this, APSIM grows the crop on a daily time step and takes into account daily solar radiation, rainfall and availability of N. It uses soil-specific information for crop lower limit (CLL) (wilting point) of the soil, defined as the soil water content below which water is not accessible to the crop. CLL is influenced by soil texture (sand, silt, clay content) and subsoil limitations (such as high chloride levels). APSIM also explains the importance of rainfall distribution in terms of growth reductions due to transient water stress. Extreme events of temperature (hot and cold), which may be important at less-than daily time scales, need to be further addressed.
Over the past decade, the industry has made huge advances in engineering, with precision agriculture enabling mapping of soil types across paddocks, understanding what affects the ability of crops to extract water and most importantly empowering growers to adopt precision seeding and to apply nutrients as required.
To fully utilise the power of crop models, on-the-go modelled outputs need to be incorporated into field operations such as seeding and nutrient applications. This could well be the next frontier in crop management. Biotic stresses such as weeds, diseases and pests can be included if the appropriate in-field observations are made.
The NPS project has demonstrated that, as crop management becomes more sophisticated, it is essential to understand the reasons why crops fail to perform at their potential. When we understand the reasons why crops do not reach their potential yield, we can better advise the growers we are working with.
References
French, R.J. & Schultz, J.E. 1984. Water use efficiency of wheat in a Mediterranean-type environment: 1. The relationship between yield, water use and climate. Australian Journal of Agricultural Research 35, 743-764.
Hochman, Z., Gobbett, D., Horan, H., Navarro Garcia, J., 2016. Data rich yield gap analysis of wheat in Australia. Field Crops Res. 197, 97-106.
Hochman, Z. & Horan, H. (2018). Causes of wheat yield gaps and opportunities to advance the water-limited yield frontier in Australia. Field Crops Research 228, 20-30.
Holzworth, D.P., Huth, N.I., et al. 2014. APSIM – evolution towards a new generation of agricultural systems simulation. Environ. Model. Software. 62, 327–350.
Hunt, J. & Kirkegaard, J. 2012. A guide to consistent and meaningful benchmarking of yield and reporting of water-use efficiency. CSIRO publication (GRDC National Water-Use Efficiency Initiative).
Lawes. R., Chen. & van Rees. 2018. The National Paddock Survey – What causes the yield gap across Australian paddocks? GRDC Updates Wagga February 2018.
Sadras, V. & Angus, J. 2006. Benchmarking water-use efficiency of rainfed wheat in dry environments. Australian Journal of Agricultural Research 57, 847-856.
van Rees, H., McClelland, T., Hochman, Z., Carberry, P., Hunt, J., Huth, N. & Holzworth D. (2014). Leading farmers in South East Australia have closed the exploitable wheat yield gap: Prospects for further improvement. Field Crops Research 164, 1-11.
Acknowledgements
The research undertaken as part of this project is made possible by the significant contributions of growers through both trial cooperation and the support of the GRDC — the author would like to thank them for their continued support. The support of GRDC staff in the regional offices is also much appreciated.
Contact details
Harm van Rees
RSD Mandurang South Victoria 3551
0419 325252
Harm@cropfacts.com.au
GRDC Project Code: BWD00025,
Was this page helpful?
YOUR FEEDBACK