Nutrition decisions following a dry season
Author: Graeme Sandral (NSW DPI), Ehsan Tavakkoli (NSW DPI and Graham Centre for Agricultural Innovation) Rohan Brill, Felicity Harris, Russell Pumpa, Maryam Barati and Eric Koetz (NSW DPI) and John Angus (CSIRO) | Date: 19 Feb 2019
Take home messages
- Fertiliser savings after drought or failed crop are possible with phosphorus (P) where there has been an extensive P fertiliser history and Colwell P values are at or above crop critical requirements. As a guide, one third of average crop P replacement can be applied down to a base level of 3-4kg P/ha.
- Savings in nitrogen (N) are likely to be less substantial than savings in P. Nitrogen savings are likely a result of higher spared N (mineral N carryover from last season), lower immobilisation due to lower crop residues and higher mineralisation rates assuming adequate late summer and early autumn rains.
- To better assess spared and mineralised N, deep soil cores should be taken to 60cm and split at 30cm to determine the amount and timing of mineral N availability.
Background
Fertiliser costs represent 20-25% of variable costs for growing grain crops. This proportion is likely to increase with the continued decline of soil organic matter and corresponding reduction in annual soil mineralisation of N (e.g. Angus and Grace 2017). In approximate terms, the N mineralisation potential in cropping soils is declining by 50% every 25 to 30 years (Helyar et al. 1997, Heenan et al. 2004). Soil mineralisation of N is not enough to meet crop demand, consequently N fertiliser is typically applied pre and/or post sowing. The in-crop efficiencies of fertiliser N retrieval in the year of application vary greatly, with approximately 44% in above-ground plant parts, 34% in soil and 22% not recovered, which is presumably lost (Angus and Grace 2017).
Soil mineral N at the start of the growing season still has a large impact on fertiliser N budgeting. Soil mineral N is a function of a number of variables including: [(spared N) + (total N mineralised)] – [(N immobilised) + (weed N uptake) + (N lost)]. On the plus side of the equation; spared N is the carryover of mineral N from the previous year and total N mineralised is N from mineralised plant residues and mineralisation of the soil organic N pool by microbes. On the negative side of the equation; N immobilisation is the N used by microbes to break down crop residues, weed N uptake represents another means of N tie up, and N lost considers leaching, denitrification (nitric and nitrous oxide and nitrogen gas), erosion and other gaseous losses (ammonia). After drought it is possible that spared N is higher due to lower exports of N in grain. Other considerations after drought include lower immobilisation rates due to lower quantities of crop residues and higher rates of mineralisation after the drought breaks.
Phosphorus is the other substantial annual fertiliser input for crop production in southern NSW. The extensive history of P application and mostly adequate to high soil Colwell P values in this region allow many growers some flexibility in managing P inputs, particularly where cash flow maybe limited following a dry season. The flexibility in P management is also made possible as crop uptake of P is primarily from the soil reserve with a smaller but important component coming from starter P applied at sowing.
In this paper we discuss both P and N considerations after drought. In the N section we consider an experiment examining the recovery of spared N in a 2018 canola crop where the N was applied to a wheat crop in 2017.
Nitrogen with an emphasis on spared nitrogen
Methods
2017 nitrogen experiment
This experiment was sown at Wagga Wagga Agricultural Institute, NSW on 14 May and included one wheat variety (cv. Beckom), nine N rates and four N application methods with N applied as mono-ammonium phosphate (MAP) and/or urea (Table 1) in a fully randomised complete block design with four replicates.
Table 1. Variety, N rates and N application methods.
Variety | x | N rate (kg/ha) | x | Application method |
|---|---|---|---|---|
Beckom | 0 | Mid-row banding at sowing (May 14) [MRB] | ||
| 10 | Spread and incorporated by sowing (May 14) [IBS] | |||
| 35 | Deep placement under each row at sowing [DP] | |||
| 60 | Broadcast at DC30 (July 28) [BSE] | |||
| 85 | ||||
| 110 | ||||
| 135 | ||||
| 160 | ||||
| 185 |
The soil at the experimental site was a Red Kandosol with a starting mineral N content of 42kg/ha to a depth of 1.5m (May 4). The previous crop was barley which was burnt late prior to sowing. Soil pH (CaCl2) was 5.8 (0–10cm), 4.7 (10-20cm) and 5.5 (20-30cm) and Colwell P was 57mg P/kg soil (0-10cm). The experiment was direct sown using Ausplow DBS tynes spaced at 250mm. At sowing, 100kg MAP (22kg P/ha and 10kg N/ha) was added to all treatments except the nil N treatment which received triple superphosphate at 22kg P/ha to balance all treatments for P. In plots receiving MAP, various amounts of urea were added to provide the N rates 35kg N/ha through to 185kg N/ha. Mean plant density at DC14 was 127 plants/m2 and was not significantly different between treatments. In crop weed control was undertaken by applying the pre-emergents Sakura® (pyroxasulfone 850g/L) at 118g/ha and Logran® (triasulfuron 750g/L) at 35 g/ha on 14 May and was incorporated at sowing. Precautionary disease control was implemented, seed was treated with Hombre ® Ultra [Imidacloprid (360g/L) and Tebuconazole (12.5g/L)] at 200mLs/100kg and Prosaro® (Prothioconazole 210g/L and Tebuconazole 210g/L) was applied at 300mL/ha at DC 31.
The experiment was harvested on 30 November. Grain protein and seed quality were estimated using near infrared (NIR) (Foss Infratec 1241 Grain Analyzer) and Seed Imaging (SeedCount SC5000R), respectively. Nitrogen offtake was estimated by protein (%)/5.7 (conversion constant) x grain yield (t/ha). The proportion of apparent fertiliser N recovery in grain was calculated by (GrainN+N – GrainN-N)/N rate where GrainN+N is the grain yield with fertiliser N, GrainN-N is grain yield with no fertiliser N and N rate is the amount of fertiliser N applied. Economic returns after N costs were determined on 2017 prices (e.g. Junee 11th Dec) were calculated by multiplying grain yield (t/ha) by $210 for AUH2, AUH2, AGP1, $250 for AWP1, $265 for H2 and $280 for H1. Pre- and post-rain grain price was only influenced by test weight, protein and falling numbers. Grain discolouration was not significant enough to impact on price.
2018 nitrogen experiment
This experiment was sown into last year’s wheat stubble on 5 May over the exact location of the 2017 wheat by N and N application method experiment described above using canola variety 43Y92 sown at 4.5kg/ha. The aim of the experiment was to determine grain yield and N recovery (recovery of spared N) in 2018 from N applications made in 2017. The experiment received 20mm of irrigation immediately after sowing (5 May) and had 32mm of stored soil water as well as growing season rainfall (May to October) of 154mm providing a total of 196mm.
At sowing 100kg MAP (22kg P/ha and 10kg N/ha) was added to all treatments except the nil N treatment which received triple superphosphate at 22kg P/ha to balance all treatments for P. In-crop weed control was undertaken by applying the pre-emergent herbicide Treflan at 2.0L/ha prior to sowing. Precautionary disease control was implemented with Prosaro® (375mls/ha) at 20% flowering.
The experiment was harvested on 15 November (hand harvest by cutting 2/m2) to determine 2018 seed yield, protein and oil response to 2017 N rates and application methods. Seed protein and oil content were estimated using NIR (Foss Infratec 1241 Grain Analyzer). Nitrogen offtake was estimated by protein (%)/6.25 (conversion constant) x seed yield (t/ha). The proportion of apparent fertiliser N recovery (spared N) in seed was calculated by (SeedN+N – SeedN-N)/N rate where SeedN+N is the seed yield with fertiliser N, SeedN-N is seed yield with no fertiliser N and N rate is the amount of fertiliser N applied. Economic returns after N costs were determined on 2018 canola prices (e.g. $600/t) and adjusted for oil premiums using a 1.5% increase or decrease in price for every 1% increase or decrease in oil content above or below 42%.
Results
Seed yield and protein measured in 2018 from 2017 N application
Seed yield and protein of canola harvested in 2018 increased with increasing rates of N applied in 2017 (Figure 1). All rates of N application increased seed yield although yield increases were more responsive above 85kg N/ha. The highest 2018 seed yield was achieved by the highest 2017 N rate using the MRB application method. No yield plateau occurred in any treatment, except for 2017 in the BSE treatment for the 160 and 185kg N/ha rates (Figure 1A). As with seed yield response, seed protein increased with increasing N rate however the protein levels were lower for the IBS method of application at the three highest 2017 N rates (Figure 1B).
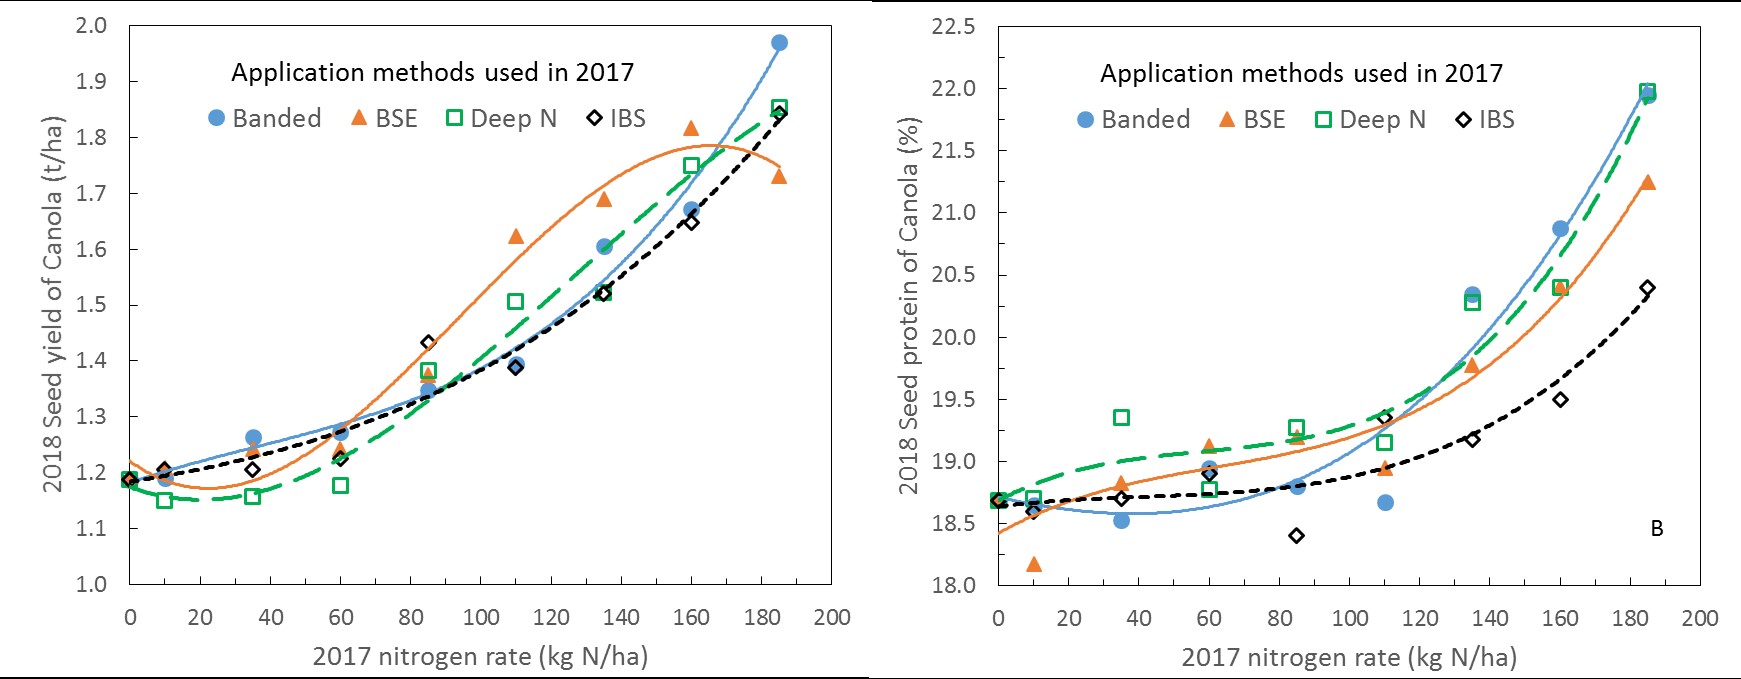
Figure 1. Responses of seed yield (t/ha) (1A) and seed protein (%) (1B) in 2018 to N applied in 2017 using four different methods of N application. Methods of application included (i) surface broadcast and incorporated by sowing (IBS), (ii) mid-row banding (MRB) at sowing (8cm deep) between every second row, (iii) deep placement (DP) at sowing under each wheat row (16cm), and (iv) broadcasting at stem elongation (BSE).
Recovery of spared N and oil content measured in 2018 from 2017 N application
Recovery of spared N in 2018 increased with increasing rates of N applied in 2017, particularly at rates above 85kg N. The recovery of spared N was higher in MRB and DP compared with IBS for the highest three rates. Mid-row banding returned the highest recovery rate of spared N at the highest N rate (Figure 2A). Oil content of seed measured in 2018 declined with increasing 2017 N rate and MRB, DP and DC30 methods of application declined further than the IBS method (Figure 2B).
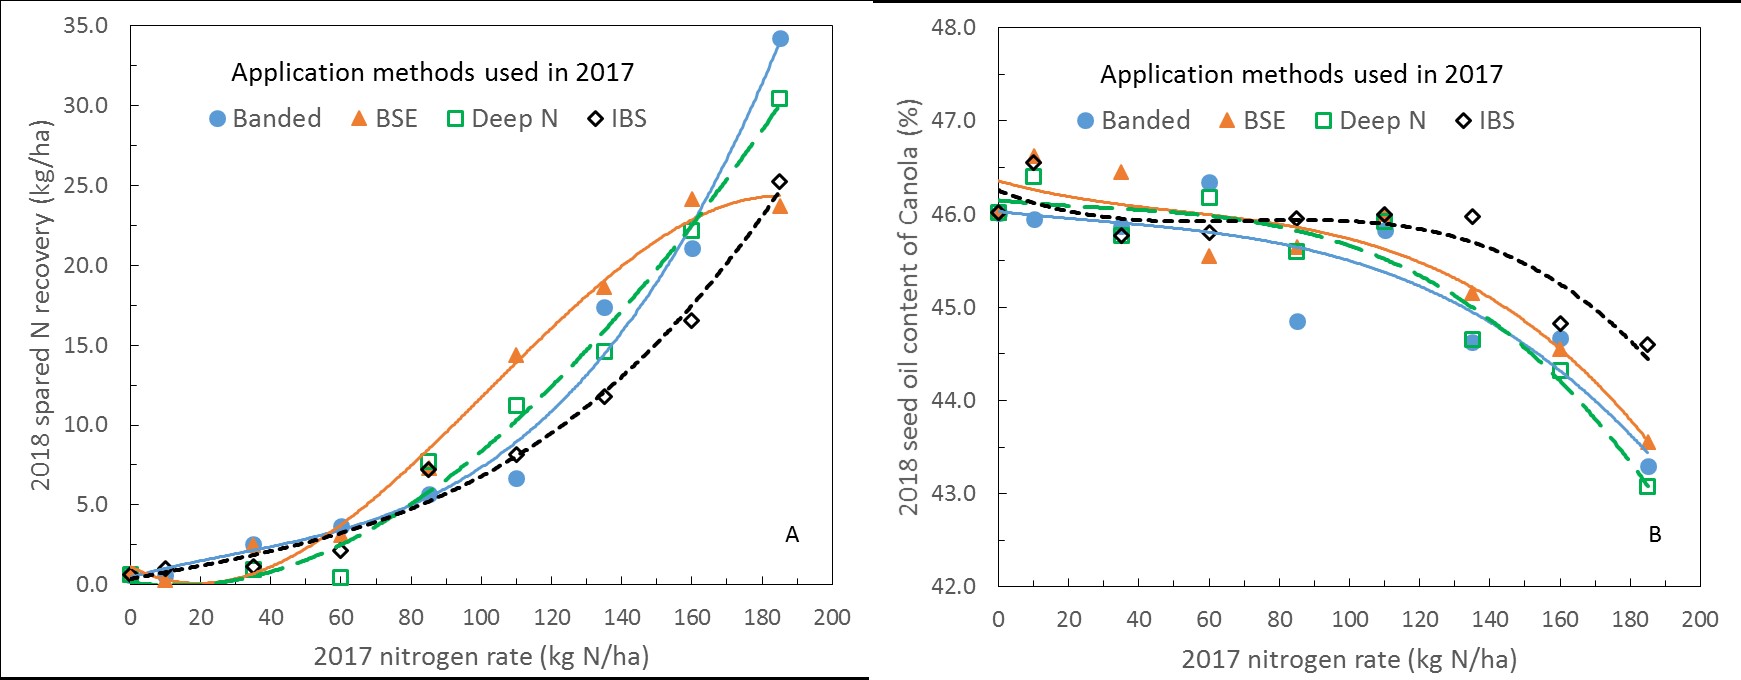
Figure 2. The recovery of spared N (kg/ha) (2A) and oil content (%) (2B) in 2018 from the N applied in 2017 using four different methods of N application.
The percentage of spared N recovery in 2018 from 2017 N application ranges from 1% to 18% and increased with increasing N rate (Figure 3A). When the percentage of apparent fertiliser recovery and spared N recovery was summed over 2017 and 2018, there was a common rate of recovery of between 55% and 60% recovery across all methods of application when applied at 110kg N/ha (Figure 3B). At rates lower than 110kg N/ha, N recovery rates varied between methods of application although MRB tended to show higher and more stable results. Recovery rates above 110kg N/ha showed a consistent decline, although MRB had higher recovery rates than IBS while the other methods (BP and DC30) were intermediate (Figure 3B).
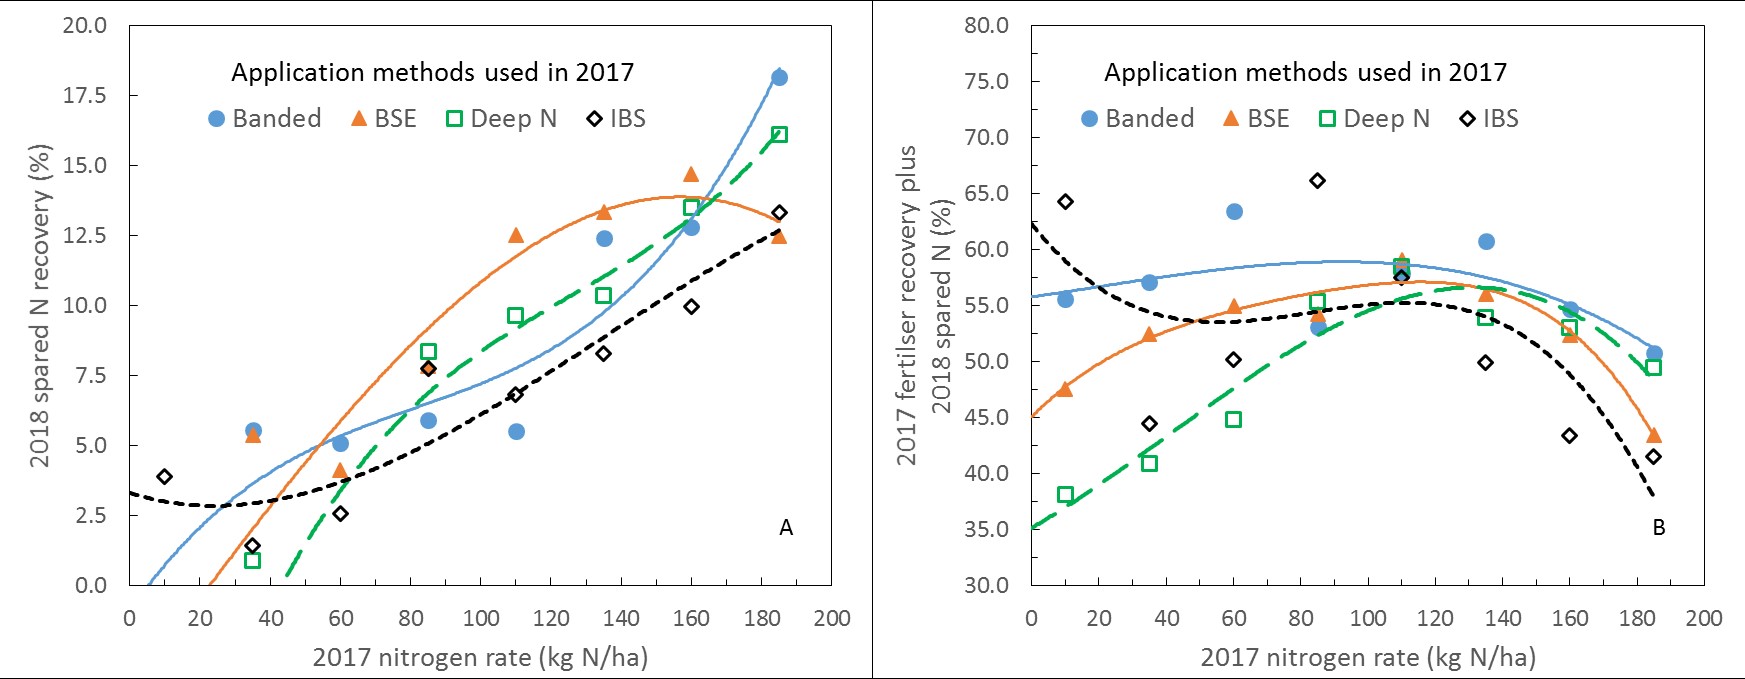
Figure 3A. The percentage of spared N recovery in 2017, and Figure 3B total recovery of fertiliser N and spared N over the years 2017 and 2018.
Net returns after fertiliser costs
Figure 4A indicates that 110kg N/ha produced 95% of maximum return on fertiliser N investment when considered on a single year response using Beckom wheat (2017). However, Figure 4B indicates that when considering returns over two years, the optimal N rate increases to 135kg N/ha.
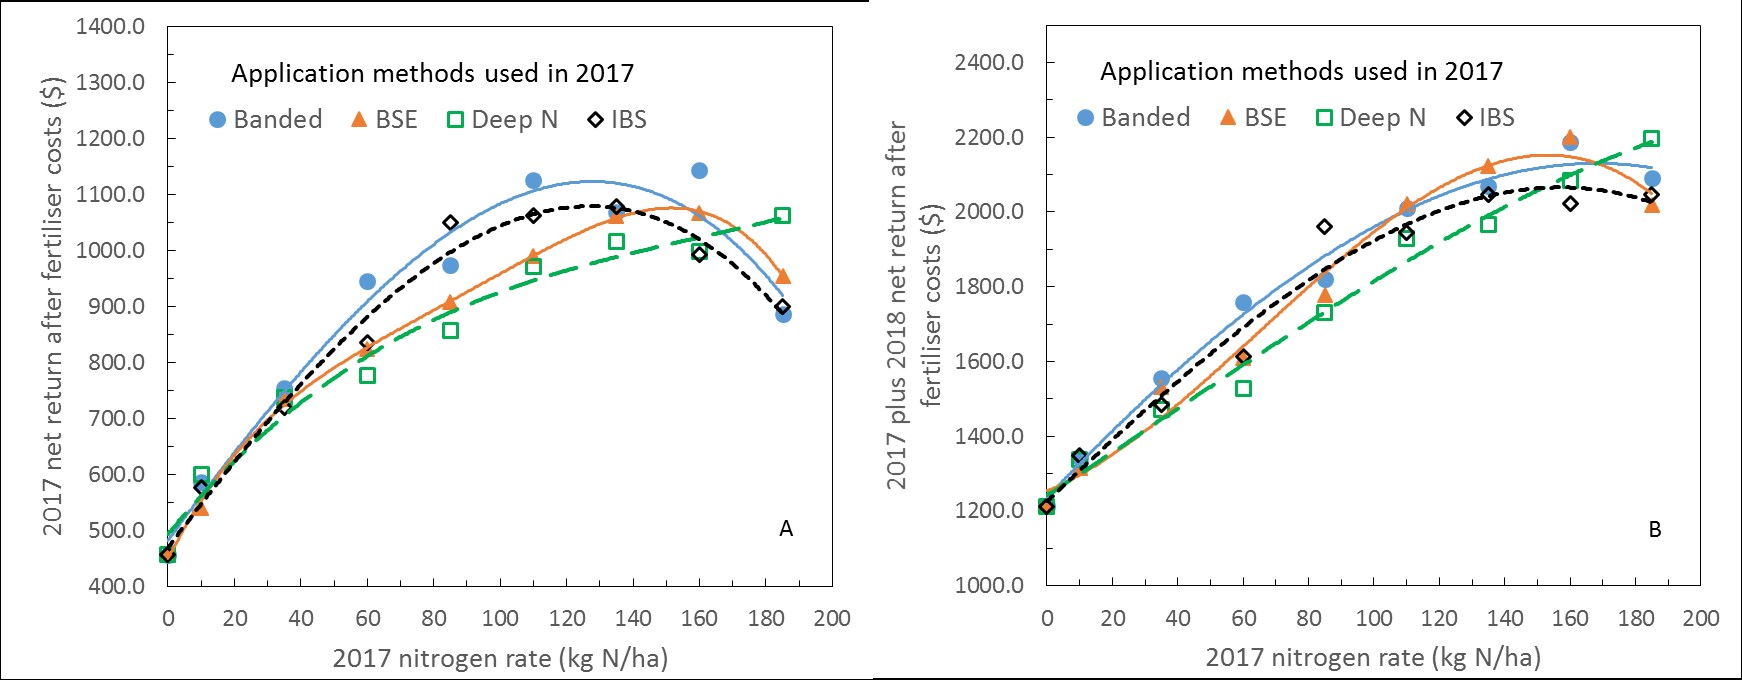
Figure 4 Net return after fertiliser costs for 2017 (Figure 4A) and combined values for 2017 and 2018 (Figure 4B).
Discussion
Spared N
In this experiment, spared N recovery in grain the year after N application was found to be low (1-18%) and for commercially used rates of N it is estimated at 6% (±5%) of the previous year’s application rate (Figure 3A). This approach used the difference method to estimate spared N captured in grain and agrees with 15N studies that show spared N in the following crop from N fertiliser is 5.4% (±4.5%) (Smith and Chalk 2018). Spared N measured in soil the year after fertiliser N application is estimated at 24% (±15%) (Smith and Chalk 2018) suggesting a soil recovery for spared N of 25%. These results suggest N savings for 2019 sowings from spared N may be limited.
N immobilisation
Other considerations apart from spared N will be more important when N budgeting for example N immobilisation in stubble residues from the previous season. Microbes break the stubble down and to grow, these microbes use about 12 units of carbon (C) to 1 unit of N while wheat straw contains about 80 to 120 units of C for every unit of N. Consequently, the bacteria utilise soil N to break down the stubble residue. As an estimate, 1000 kg/ha of wheat grain produces about 1660 kg/ha of stubble. This stubble is made up of approximately 40 to 45% C (747kg/ha assuming 45% carbon) and has approximately 6.2kg N/ha, assuming a 120:1, C:N ratio in wheat stubble. As an estimate, 30% of the stubble is used by microbes for growth while approximately 70% is respired as carbon dioxide. Therefore, the microbes would consume 224kg C/ha (i.e. 30% of 747kg/ha) for growth and at a C:N ratio of 12:1 that would mean they require 18.6kg N/ha of which 6.2kg N/ha is already contained in the stubble. This suggests that for every tonne of last year’s grain yield, 12.4kg N/ha (18.6kg N/ha – 6.2kg N/ha) is required to break down last year’s stubble residue. Where this N is not supplied, the grain yield loss from immobilisation in wheat would be 250kg/ha/t of last year’s wheat yield or 250kg/ha/1.66 t of residual stubble. With high stubble loads and low C:N ratios, N immobilisation can be substantial. For example, a 4t/ha wheat crop that was broken down (approximately 50% only) over the following year would immobilise an estimated 25kg N/ha or approximately55kg/ha of urea (note wheat stubble usually takes more than one year to break down in southern NSW). In a drought year assuming the stubble residue is halved so will be the immobilisation of N providing a calculated potential saving in this example of 12.5kg N/ha.
Pre-sowing mineralisation
Mineral N prior to sowing is best estimated by deep cores to 60cm. These can be split into 30cm sections to identify if the mineral N will be available early in the season or later in the growing season. In droughts mineralisation is slow due to low soil moisture and rapidly increases after the drought breaks. It’s possible increased mineral N will be evident after the 2018 drought and this will be more likely expressed in paddocks with an extensive and recent pasture history.
Phosphorus budgeting after drought
P budgeting and take-off in grain
Starter P, often applied as MAP, is very important for; (i) early root development which assists the plant in exploring the greater soil P reserve and (ii) early head development when potential grain number is set (e.g. at or just prior to DC30).
Many phosphorus experiments have shown responses to starter P however, P savings can be made after drought especially where (a) December P export in grain is lower than P inputs at sowing and (b) soil Colwell P values are equal to or greater than soil critical values for the target species. In these circumstances one third of historical average annual P inputs can be applied down to a base level of 3-4kg P/ha. As an example, if our wheat target yield for 2019 is estimated at 3t/ha and the P budget is estimated to be 3.6-5.5kg P/t of grain production then we have a P budget of 10.8-16.5kg P/ha or 49-75kg/ha MAP. If a medium value of 62kg /ha MAP (13.5kg P/ha) was assumed as our standard P budget, we would reduce this by two thirds down to 18.6kg /ha of MAP or 4.1kg P/ha. At this rate the MAP granules are placed in-row at approximately 3.5-4.5cm spacings when using 25cm tyne spacing. Wheat sowing rates (50-65kg/ha) are likely to place seed at every 2-2.5cm in-row while the full MAP rate of 62kg/ha provides an in-row granule spacing of approximately 1.0-1.2cm.
The more detailed approximations used for P budgeting in wheat include grain P export (2.7-3.6kg P/t) plus stubble P not accessible to the following crop (0.4-0.8kg P/t) plus soil losses (0.3-0.7kg P/t grain production) which provides an estimated 3.6-5.5kg P required/t of grain production. Similarly, for canola seed P export (4.0-6.5kg P/t) plus stubble P not accessible (0.6-1.0kg P/t) plus soil losses (0.3-0.7kg P/t grain production) provides an estimated 6.1-10.2kg P required per tonne of seed production. On a per hectare basis the export of P for wheat and canola is approximately the same assuming canola has half the water use efficiency for grain production as wheat.
In the longer-term, P inputs should be adjusted by tracking soil P values to determine if soil test values are increasing (over estimate of P budget), decreasing (under estimate of P budgeting) or remaining within the critical 90 and 95% range (P budget balance). After several year of soil testing and adjusting P inputs it is possible to ensure relatively stable soil P test values for optimising economic returns.
Figure 5 shows the average Colwell P decline between P applied and measured in 2017 and measured again in 2018 when no P was applied in 2018. The Colwell P decline is estimated by regression analysis that included soil samples taken from plots growing four different crop species (wheat, lupin, field pea and lentil). Crop species were sown in a P deficient soil that was fertilised prior to being sown in 2017 with 11 P rates. The decline shown here, is an average over the different crop species and highlights that Colwell P decline is larger in higher P soils. This represents a greater reduction in soil P which is likely due to stronger bonding of P in the soil reserve and higher P removal in grain and stubble. The take home message from this is to ensure Colwell P values are within the 90 to 95% of maximum grain yield but not above these values as the high P levels will not increase grain yield and will decrease P use efficiency. For another supporting perspective on this point see Simpson et al (2014).
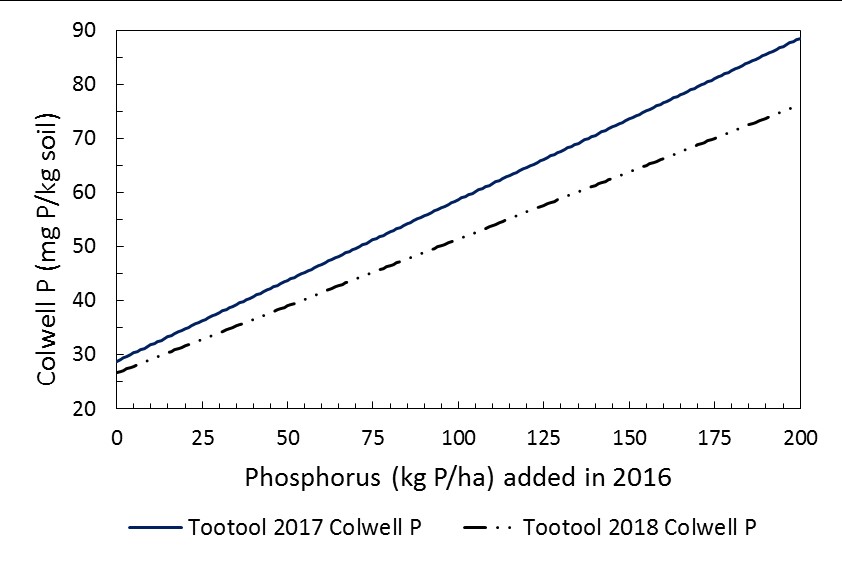
Figure 5. Average Colwell P decline between P applied in 2017 (solid line) and 2018 (dashed and dotted line) where no P was added in 2018.
The exception to the above reduction in P budgets after drought applies to calcareous soils with high pH. Phosphorus savings in this example are not possible as the excess lime (calcium or magnesium carbonate) will not readily dissolve at high pH and it serves as a P sink for surface adsorbed calcium phosphate precipitation. In addition, the lime in calcareous soil reacts with P in soil solution to form calcium phosphate at the surface of the lime. The first process of P bonding occurs in dry conditions and consequently P availability is low even in circumstance where P take-off has also been low. In these soils, advantages in P supply are achieved with application via highly concentrated P bands with minimal soil mixing.
P budgeting and take-off in hay
Phosphorus off-take in hay per ha is higher than for grain production. Previously it was estimated that a 1t/ha wheat crop would remove 2.7-3.6kg P/ha while a hay crop is estimated to remove 1.0-2.0kg P/ha/t. The same comparison for canola indicates a 1t/ha grain crop exports 4.0-6.5kg P/ha in seed while the hay exports an estimated 3.0-4.0kg P/ha/t. In some circumstance where substantial hay yields are achieved large amounts of P are removed. Large variations in P off-take in hay are also likely due to hay quality as well as the proportion of unbaled straw and leaf remaining in the paddock. Note the unbaled leaf component for canola can be large and rain on cut hay can leach plant available P into the soil.
Hence, P savings in 2019 after hay cut in 2018 needs to be considered in a more conservative light. With higher P off-take, Colwell P values will decline more substantially and consequently slightly different P saving rules apply. These include (a) soil Colwell P values greater than 95% of critical for the target species and (b) half of historical average P inputs can be used down to a base level of 5 kg P/ha.
Cash flow approach to P budgeting
One-off P savings after drought or failed crop production are made possible because most P for crop production is drawn from the soil reserve. Because of this P budgeting can be somewhat retrospective. As an example this ‘somewhat retrospective’ approach firstly estimates the P budget based on long term rainfall and water use efficiency to produce likely average grain yield for wheat and the subsequent P budget (e.g. stored soil water = 30mm, in season rainfall = 230mm, plant available soil water = 260mm, soil evaporation = 110mm, water use efficiency of grain production = 20kg grain production per mm of crop transpired water, grain yield therefore = 3 t/ha, P budget = approximately 16.5kg P/ha is the long term average). The second component of the budgeting exercise requires the same approach as described but applied to the season just passed. In this case let’s assume last year’s grain yield was 1.5t/ha and a retrospective P budget of 8.25kg P/ha is estimated (e.g. half the long-term average). The final step is to average the two estimates for the unsown crop and in this example that is estimated at approximately 12.4kg P/ha. The advantage of this approach is it considers both long term P budgeting to maintain soil P reserves and last year’s retrospective P budget which is most likely to reflect cash flow. This simple model adds more P after higher yielding years and less P after low yielding years. The underlying assumption is that the soil Colwell P starting point is between 90 and 95% of crop critical P. Phosphorus inputs should always be assessed against soil test values to ensure input assumptions are maintaining Colwell P values in the critical range.
Conclusions
Fertiliser savings after drought are possible with P and less likely with N. This is because the extensive history of P application in southern cropping systems of NSW combined with low soil phosphorus buffering indexes ensures that P can be supplied to crops from the greater soil reserve. In addition, the soil reserve supplies most of the P requirements of crops while fertiliser P only directly supplies a much smaller proportion (<30%).
Drought is likely to cause slightly higher rates of mineralisation and lower rates of immobilisation compared to an average season. Spared N from the following crop is likely to be higher however, its recovery in the following crop is low. The combination of higher spared N and higher potential rates of mineralisation (assumes average or above average March and April rain) may result in lower 2019 N budgets, although this is best measured with deep soil cores.
References
Simpson RJ, Richardson AE, Nichols SN, Crush JR (2014) Pasture plants and soil fertility management to improve the efficiency of phosphorus fertiliser use in temperate grassland systems. Crop and Pasture Science 65: 556-575.
Smith CJ, Chalk PM (2018). The residual value of fertiliser N in crop sequences: An appraisal of 60 years of research using 15N tacer. Field Crops Research 217 (2018) 66–74.
Heenan DP, Chan KY and Knight PG (2004) Long-term impact of rotation, tillage and stubble management on the loss of soil organic carbon and nitrogen from a Chromic Luvisol. Soil & Tillage Research 76, 59–68.
Helyar KR, Cullis BR, Furniss K, Kohn GD and Taylor AC (1997) Changes in the acidity and fertility of a red earth soil under wheat-annual pasture rotations Australian Journal of Agricultural Research 48, 561-586.
Angus, J. (2016) Budgeting crop nitrogen supply better estimation better decisions. https://grdc.com.au/resources-and-publications/grdc-update-papers/tab-content/grdc-update-papers/2016/02/budgeting-crop-nitrogen-n-supply-better-estimation-better-decisions
Useful resources
Acknowledgments
The research undertaken as part of this project is made possible by the significant contributions of growers through both trial cooperation and the support of the GRDC, the author would like to thank them for their continued support. This research was undertaken as part of project UQ82.
Contact details
Graeme Sandral
NSW DPI, Wagga Wagga Agricultural Institute
0409 226 235
graeme.sandral@dpi.nsw.gov.au
@gsandral
GRDC Project Code: UQ82,
Was this page helpful?
YOUR FEEDBACK