The role of elemental sulfur in improving chemical and physical characteristics of a sodic soil
Author: Dana Mulvany, David Hall, Ed Barrett-Lennard, DPIRD | Date: 25 Feb 2019
Key Messages
- Sodic soil in low-rainfall areas of WA are constrained by soil alkalinity and sodicity, which both increase soil dispersion.
- In a pot experiment, application of elemental sulfur decreased the chemical constraints in a sodic soil by lowering soil pH from 8.5 to 6.9, and by producing gypsum, both of which helped to restore soil structure and reduce soil dispersion.
- Application of elemental sulfur may be effective in providing a long-term solution to alleviating constraints associated with sodic soil.
Aims
The aim of this research was to examine the role of elemental sulfur (ES) with and without additional organic matter in lowering the pH and improving the chemical and physical properties of sodic soil.
Background
Sodic soil, otherwise known as heavy red soil, often produce above average crop yield where growing season rainfall is at least 200 mm, but produce poor yield in drier areas or years (E Barrett-Lennard 2019, pers. comm.) Major constraints of sodic soil include alkalinity, soil dispersion, poor water infiltration, reduced leaching and the accumulation of salts in the root zone of cereal crops (Rengasamy, 2010; Barrett-Lennard et al, 2016).
It is well established that if soil pH is lowered to a level where calcium carbonate (CaCO3) becomes soluble (pH of 8.4) both chemical and physical constraints associated with alkaline soil can be alleviated (Chorom and Rengasamy 1997; Hussain et al 2001; Chorom et al 1994). The application of ES has been shown to be effective in lowering soil pH and exchangeable sodium percentage (ESP), thereby improving soil physical and chemical characteristics (Hussein, 2008; Stamford et al 2002). Little has been done investigating the role of ES for ameliorating sodic soil in the low rainfall zone (<200 mm growing season rainfall) of Western Australia (Barrett-Lennard et al, 2016).
We expected that if ES was working as hypothesized, then soil pH would decrease, soil electrical conductivity (EC) would increase due to gypsum production, and the soil structure would be restored as dispersion was eliminated. We also expected that organic matter would act as an energy source for microbes, leading to a greater improvement in soil properties.
Methods
This work involved a soil incubation pot experiment. There were five rates of ES, two rates of organic matter (OM), and two rates of water with 4 replicates (Table 1).
Sodic soil was collected from Salmon Gum soil (Table 2) at Nangeenan at a depth of 10-30 cm, dried at 105°C, ground to pass through a 2 mm sieve and thoroughly mixed in a concrete mixer prior to addition of soil amendments. The soil amendments, ES and OM (pea straw), were also ground and passed through a 2 mm sieve.
Soil was analysed for CaCO3 percentage and OM concentration. The concentration of CaCO3 was used to calculate (via stoichiometry) the quantity of ES required for each ES application rate (see equations 1 and 2). The amount of ES added per kilogram of soil ranged from 0.29 g for the lowest ES rate to 1.73 g for the highest rate. The ES product used was of 99% pure sulfur. The baseline organic matter rate did not have any additional organic matter added to the soil. Existing soil organic matter was used to ascertain how much additional organic matter (pea straw) was needed for the soil to contain a total of 2% OM. Two water rates were used, field capacity at 24% moisture (the maximum amount of water that the soil can hold after drainage) and refill point at 18% moisture (the point where readily available water has been exhausted).
2S + 3O2 + 2H2O → 2H2SO4 (eq.1)
H2SO4 + CaCO3 → CaSO4 + H2O + CO2 (eq.2)
Table 1: Details of each rate for the ES, OM and water treatments.
ES rates | OM rates | Water rates |
|---|---|---|
0: No S | Baseline OM | Soil moisture at field capacity |
10: Enough ES to dissolve 10% of the CaCO3 in the soil | 2% OM (existing soil OM plus added OM) | Soil moisture at refill point |
20: Enough ES to dissolve 20% of the CaCO3 in the soil | ||
40: Enough ES to dissolve 40% of the CaCO3 in the soil | ||
60: Enough ES to dissolve 60% of the CaCO3 in the soil |
Table 2: Soil analysis from the start of the experiment.
Total organic carbon (%) | Conductivity (dS/m) | pHH2O | CaCO3 (%) | Exchangeable sodium percentage (ESP) |
|---|---|---|---|---|
0.79 | 0.766 | 8.6 | 2.0 | 11.9 |
Soil was added to pots without drainage holes, so that leaching was prevented. Treatments with ES and/or OM were thoroughly mixed with the soil. De-ionised water was added up to the desired moisture level and cling wrap was held in place with a rubberband to prevent evaporation. The pots were kept in a temperature-controlled cabinet at 25°C and the specific moisture rate was maintained for the duration of the experiment. The soil was mixed regularly to ensure that soil moisture was even throughout and soil conditions were homogenous. Samples from each pot were taken at days 0, 1, 2, 4, 7, 11, 17, 24, 32, and 43 and dried at 30°C for at least 48 hours. Once dry, the soil was ground, passed through a 2 mm sieve and tested for pH and electrical conductivity (EC) using 1:5 water extracts.
Additional chemical and physical tests were conducted at the end of the experiment. Composite samples from the four replicates for each treatment were analysed for exchangeable cations and the ESP was calculated. The Emerson Test (EAT P9 B2) for dispersion was also done on these soil samples with the level of dispersion after 20 hours in water reported.
Results
Results presented show the percentage change in pH and EC from day 0 to 43. This is to remove the assumption that all of the soil samples started off having the same pH and EC at day 0.
Hydrogen ion and pH
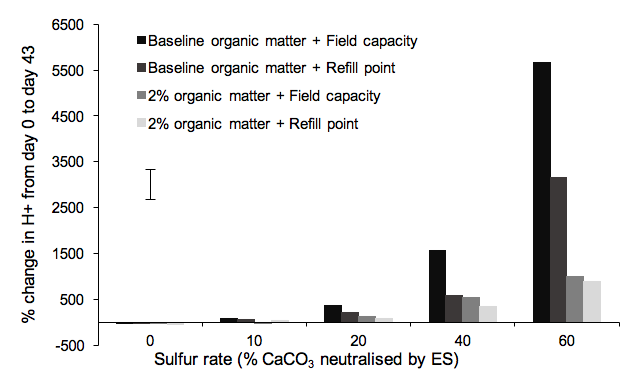
Water content, organic matter and ES, and the interactions between these factors all had a significant effect on hydrogen ion concentration (H+) (Table 2). There was a strong relationship between change in H+ and ES rate (R2 = 0.98) with an increase in the percentage change in H+ as ES rate increased. There was no difference in the percentage change in H+ for the lowest three ES rates, whereas the highest two ES rates had a significant change in H+ from day 0 to day 43 (Fig. 1). The greatest change occurred at the highest ES rate in combination with the highest water rate and the lowest (baseline) OM rate. The pH in this treatment decreased from 8.45 on day 0 to 6.86 on day 43, corresponding to a 5.7-fold increase in H+.
By day 32 the OM rates diverged for ES rate 40, and by day 43 for ES rate 60.
Table 3: Significance (*** (p<0.001),** (p<0.01), * (p<0.05), n.s (not significant)) for the percentage change in H+ and EC from day 0 to day 43, and dispersion index on day 43 of each factor and their interactions.
| % change in H+ from day 0 to day 43 | % change in EC from day 0 to day 43 | Dispersion index (Emerson Test) |
|---|---|---|---|
OM | *** | *** | n.s |
ES | *** | *** | *** |
Water | *** | *** | * |
OM* ES | *** | *** | n.s |
OM*water | ** | *** | n.s |
ES*water | *** | ** | *** |
OM* ES *water | ** | ** | n.s |
 Figure 1: Percentage change in H+ from day 0 to day 43 in response to sulfur rate for each combination of organic matter and water rate treatments. The bar represents the LSD at the 5% probability level.
Electrical conductivity
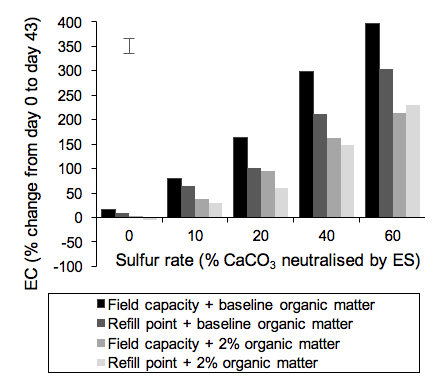
Like hydrogen ion concentration, EC was also significantly affected by all three factors as well as the interactions between them (Table 2). Overall the greatest change in EC also occurred at the highest ES rate in combination with the highest water rate and the lowest OM rate (Fig. 2). EC in this treatment increased from 0.26 dS/m on day 0 to 1.06 dS/m on day 43, corresponding to an increase of almost 400%. There was a strong relationship between EC and ES rate with the greatest increases in EC occurring at the highest ES rate (R2>0.98).
 Figure 2: Percentage change in EC from day 0 to day 43 at different combinations of ES, water and OM rates. The bar is the LSD at the 5% probability level.
Dispersion
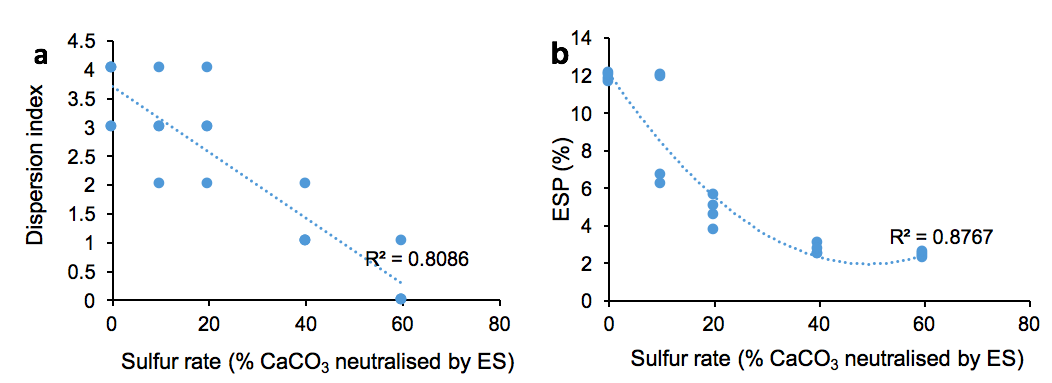
There was a significant difference in dispersion at the end of the experiment. Dispersion index and ESP decreased as the ES rate increased (R2 = 0.81 and R2 = 0.88 respectively) (Fig. 3). Dispersion for the highest two ES rates was significantly less than the lower ES rates and was either slight or none.

Figure 3: Relationship between dispersion index and ES rate (a) and between ESP and ES rate (b).
Conclusion
Elemental sulfur had a dramatic effect on both the chemical and physical properties of this sodic soil. The highest rates of ES (without the addition of organic matter) were the most effective at lowering soil pH. A decrease to a pH more suitable for cereal growth occurred where the rate was sufficient to neutralise at least 40% of the CaCO3 present in the soil. Lowering of soil pH by ES was less effective where there was organic matter added. It is not yet clear what the mechanism is driving this and future work is needed to give a clear understanding of the influence of organic matter when ameliorating these soils with ES.
The highest ES rates (without the inclusion of additional organic matter) also saw a rise in EC (data not presented); this was likely due to the formation of gypsum, a by-product from the microbial oxidation of ES. Gypsum would have a beneficial follow-on effect on the physical properties of the soil by restoring soil structure (Rengasamy 2010). Exchangeable Sodium Percentage and dispersion index values reflect this as each indicator was dramatically reduced at the highest ES rates. Organic matter had no effect on dispersion.
This work identifies the potential for the use of ES as an effective ameliorant for improving the chemical and physical properties of sodic soils in Western Australia, making these soils, especially in drier areas of the wheatbelt, more viable for cropping in a drying climate. While the application of gypsum may address the physical constraint of dispersion and aid in improving soil structure in the short term, ES has the potential to address both chemical and physical constraints in the long term. Chemical reactions involving ES reduce the amount of CaCO3 in the soil, thereby reducing pH and indirectly addressing dispersion. The combined effects of this is also a reduction in transient salinity as salts can then more readily move down the soil profile and away from the root zone of cereal crops.
The cost of ES used in this work was very expensive. To remediate soil containing 2% CaCO3 to 0.2 m depth via broadcast spreading the cost of product alone ranged from approximately $1,500 per hectare for ES rate 10 to $9,000 per hectare for ES rate 60. However it is highly likely that the rates used would be too high if applied to a paddock, especially for sodic soils that have a lower content of naturally occurring carbonates. A considerable degree of caution must be used when using ES to alter soil pH to prevent soils from exceeding their buffering capacity and turning acidic. Work so far has only involved soil in the laboratory and field trials are needed for appropriate rates to be developed. It is recommended that if applying ES with the intent of lowering soil pH, a conservative approach must be taken. Application should be in small amounts per year, with soil pH being closely monitored over time and before additional applications.
The pH response of any sodic soil to the application of ES will depend on many factors including: initial content of naturally occurring carbonates in the soil, organic matter, soil moisture, buffering capacity of the soil, soil pH, clay content, particle size of ES, incorporation method (broadcast spreading vs furrow banding), the degree of mixing of the ES with the soil, and rainfall environment. Naturally occurring carbonates in these soils are usually present as small rocks or nodules rather than as a fine material. Because of the spatial and vertical variation in soil properties, the effect of ES on soil pH will be highly variable. The amount of ES in the application, the size of the ES particles, and how it is incorporated and mixed will also influence the effect of ES on soil pH.
While this work demonstrates that ES is an effective ameliorant for lowering pH and dispersion of a sodic soil, many questions remain about whether this work could lead to a viable amelioration method for farming our sodic soils. Such questions include determining rates of application to accurately bring soil pH to the point where dispersion ceases and not beyond for further acidification, and whether these changes in the soil chemical and physical properties will have a positive effect on yield.
References
Barrett-Lennard, E., Anderson, G.C., Holmes, K.W., Sinnott, A. (2016). High soil sodicity and alkalinity cause transient salinity in south-western Australia. Soil Research, 54, 407-417.
Chorom, M. Rengasamy, P. Murray, R.S. (1994) Clay dispersion as influenced by pH and net particle charge of sodic soils. Australian Journal of Soil Research, 32, 1243-1252.
Chorom, M. Rengasamy, P. (1997) Carbonate chemistry, pH, and physical properties of an alkaline sodic soil as affected by various amendments. Australian Journal of Soil Research, 35, 149-161.
Hussain, N. Hassan, G. Arshadullah, M. Mujeeb, F. (2001) Evaluation of amendments for the improvement of physical properties of sodic soil. International Journal of Agriculture and Biology, 3(3), 319-322.
Hussein, A.H.A (2008) Combined effects of farmyard manure (FYM) and elemental sulphur (S) on soil chemical properties, growth, yield, leaf water and nutrient contents of corn plant grown on sandy clay loam soil. Alexandria Science Exchange Journal, 29 (3), 175-185.
Rengasamy, P. (2010). Soil processes affecting crop production in salt-affected soils. Functional Plant Biology, 37, 613-620.
Stamford, N.P, Freitas, A.D.S, Ferraz, D.S, Santos, C.E.R.S (2002) Effect of sulphur inoculated with Thiobacillus on saline soils amendment and growth of cowpea and yam bean legumes. Journal of Agricultural Science, 139, 275-281.
Acknowledgments
The research undertaken as part of this project is made possible by the significant contributions of growers through both trial cooperation and GRDC investment and the Department of Primary Industries and Regional Development. The author would like to thank them for their continued support.
GRDC Project Number: DAW00242.
Paper reviewed by Dr James Fisher, Désirée Futures
GRDC Project Code: DAW00242,
Was this page helpful?
YOUR FEEDBACK
