Using EM38 at the crop lower limit to identify subsoil constraints for site-specific management
Author: Yash Dang and Ram Dalal, School of Agriculture and Food Sciences, The University of Queensland | Date: 26 Feb 2019
Take home messages
- Salinity, sodicity, acidity and phytotoxic concentrations of chloride in soil are major constraints to crop production costing 2 billion per annum in lost production to Australian grains growers
- Large scale spatial and temporal variability in soil constraints: Identification is the first step
- EM38 is an important tool for mapping soil variability, however, ground-truthing is necessary
- Site-specific soil and nutrient management are cost-effective, economical and environmentally positive
Introduction
Water supply is undisputedly the major factor that determines crop growth in the northern grains region (NGR). Moreover, characteristic soil attributes of the region such as high salinity, sodicity, acidity, and phytotoxic concentrations of chloride, constrain the ability of plant roots to extract water as well as nutrients (Dang et al. 2006). These soil constraints vary both laterally across the landscape and vertically within the soil profile. By identifying the spatial variability of soil constraints, we can help grain growers to develop appropriate site-specific agronomic management strategies.
Soil sampling to identify the distribution of soil constraints is time-consuming and expensive. Robertson et al. (2007) suggested that soil mapping using proximal and remote sensing is likely to be more cost-effective than interpretation of conventional soil maps. Sensing technologies allow the user to locate and monitor areas of potential soil constraints, providing both practical and economic advantages (O’Leary et al. 2003). We can infer the spatial pattern of soil constraints through the spatial pattern of crop yield. Where crops fail over multiple years to pass a certain yield threshold, then we might reasonably suspect the presence of some temporally stable limiting factor, such as a soil constraint.
This study was aimed to investigate the use of proximal sensing (Geonics EM38) and remote sensing to identify potential management classes and to develop a framework to estimate economic and environmental benefits of site-specific management options.
Materials and methods
The study used seven arable fields across Queensland and northern New South Wales (Figure 1). The land managers of each site harvested their crops with machinery fitted with yield monitoring equipment, linked to a differentially corrected global positioning system (dGPS). Each set of yield monitor data was cleaned to remove spurious observations associated with harvester dynamics, speed changes, cutting overlaps and turns (Blackmore and Moore 1999; Taylor et al. 2007). The VESPER software (Whelan et al. 2001) was then used to krige, on 20-m blocks, the cleaned yield data for each crop, using a local exponential variogram. The interpolation locations were taken as the nodes of a 5-m grid overlaid to each field.
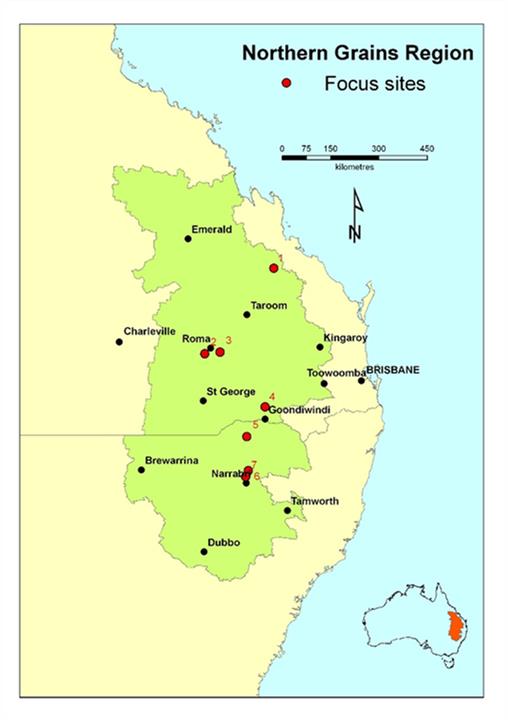
Figure 1. Location of the study sites
Electromagnetic induction surveys
The electromagnetic induction technique measures electrical conductivity (ECa) by inducing a small current within the soil (McNeill 1992). In this study we recorded ECa using a Geonics EM38, linked to a data-logger and a dGPS. The dGPS was mounted on a vehicle, with the sensor towed behind on a conveyor-belt mat (Dang et al. 2011).
Soil sampling and analysis
A minimum of two locations were randomly selected within each stratum for soil sampling. Two soil samples were taken per location, using a 50-mm diameter tube and a hydraulic sampling rig. Soil samples were extruded onto a plastic liner and then sub-sampled into a surface interval (0.0–0.1 m), then successive 0.2-m intervals to 1.5 m and analysed for soil physical and chemical properties.
On-farm experimentation
To determine if management by the potential classes was justifiable over conventional uniform field management, field-scale replicated trials were applied at three sites. At the site in Biloela, three treatments applied to the strips were 0, 23, and 46 kg N/ha at sowing. Each strip received a uniform application of 10 kg P/ha through zincated monoammonium phosphate at sowing. The nitrogen requirement at 50% nitrogen efficiency for each class was calculated using realistic yield potential (RYP) in the presence of soil constraints (Dang et al. 2010), the protein goal (13.0%) and NO3-N concentration in soil to 0.9 m soil depth. At the site in Goondiwindi, two experiments were conducted. At sowing, strips of 0, 40, and 80 kg MAP/ha, each replicated three times, were applied across the field, aligned in the direction of management operations. The second trial was conducted to evaluate wheat yield response to gypsum in the lowest-yielding management class. Gypsum was spread at 2.5 t/ha on the soil surface and incorporated to a depth of 0–0.05 m. Cumulative gross margins were obtained for a one-off application of gypsum (Dang et al. 2011). At the site in Garah, strips of 20, 50 and 100 kg N/ha, gypsum at 2.5 t/ha and compost at 5 t/ha were applied across the field, aligned in the direction of management operations. Each strip was replicated twice. Barley grain yield was measured with a yield monitor at the end of the season.
Results
Relationships of soil ECa with measured soil properties
The variation of ECa to Crop Lower Limit (CLL), averaged over the profile (0–1.5 m), was explained principally by ECse, followed by soil moisture at CLL. The former explained the largest proportion of the variation of ECa-CLL for the surface soil (0–0.1 m), shallow subsoil (0.1–0.5 m) and deep subsoil (0.5–0.9 m). In the very deep subsoil (0.9–1.5 m), the variation of ECa was explained primarily by soil chloride. In subsoils, the ability to correlate EC (as measured by the EM38) with CLL was stronger than for surface soil. A similar pattern of relationships was seen at the drained upper limit (DUL), but the ability to correlate EC (as measured by the EM38) with DUL was not as strong and there was more variance than when using EC to reflect CLL. As EC increased, yield decreased, with this relationship being stronger at CLL than at DUL. Therefore, we consider only ECa measurements at CLL for identifying potential management classes (data not shown).
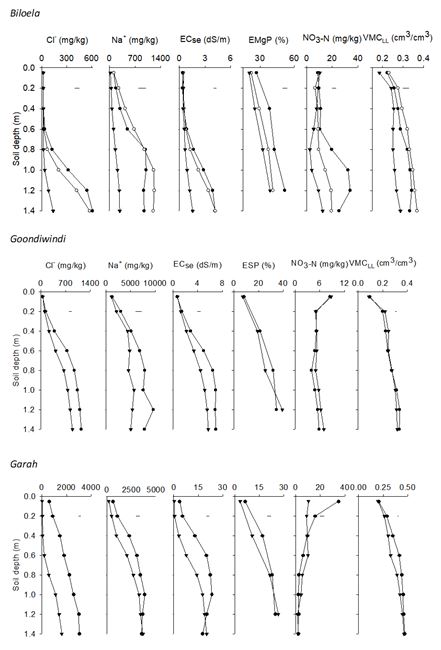
Figure 2. Soil constraints at Sites in northern region
Relationships of soil ECa with measured grain yield
Figure 3 shows the relationships of EM38 readings for ECa, stratified into five quantiles (i.e. top 20% --- lowest 20%), with the mean grain yield associated with each quantile. As ECa increased, there was a strong decline in grain yield, with the level of decline stronger at CLL than at DUL. Therefore, we consider only ECa measurements at CLL for identifying potential management classes.
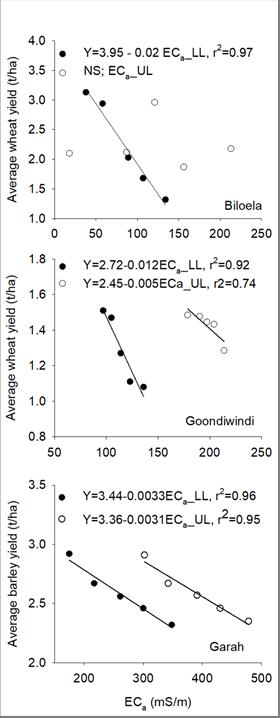
Figure 3. Relationships between average grain yield and average ECa measurements,
stratified into five quantile intervals at drained upper limit (DUL) and crop lower limit (CLL).
Potential management classes
At the Biloela site, from a 64-ha field in crop production since 1960, three potential management classes were justified (Figure 4 (top)): (i) a low-yielding class (mean yield = 1.27 t/ha) that has relatively high in ECa-CLL (mean = 122 mS/m) and relatively low clay content (range of 38–44%), whose pre-clearing native vegetation was scattered brigalow (Acacia harpophylla); (ii) a medium-yielding class (mean yield = 2.22 t/ha) with intermediate in ECa-CLL (mean = 89 mS/m) and relatively high clay content (range of 53–59%), whose pre-clearing native vegetation was also brigalow; and, (iii) a high-yielding class (mean = 3.36 t/ha), with relatively low in ECa-CLL (mean = 56 mS/m), clay contents in the range 47–55%, and pre-clearing vegetation of softwood scrub. Soil chloride concentrations and ECse were significantly higher below 0.7 m depth in the low- and medium-yielding classes when compared with the high-yielding class. Both soil chloride and ECse followed a similar pattern throughout the soil profile. Water-soluble sodium concentrations were significantly lower in the high-yielding class when compared with the low- and medium-yielding classes; however, differences between low and medium-yielding classes were not significant throughout the soil profile. Exchangeable magnesium percent (EMgP) was greater in the low-yielding class when compared with the medium and high-yielding classes at all soil depths, however, differences between the medium and high-yielding classes were significant only at 0.4 and 0.8 m soil depth.
The soil of the Goondiwindi site (257 ha) is a grey Vertosol (Figure 4 (middle)). The western side of the field, which shows substantial surface slaking after cultivation, yields poorly in most years (mean wheat yield = 1.06 t/ha for the yield maps available), while the eastern side of the field has a relatively higher yield (mean = 1.44 t/ha). Mean ECa-CLL for the western side was 121 mS/m, compared with 104 mS/m for the eastern side. The most notable soil differences in the potential management classes were significantly higher chloride and sodium concentrations and ECse in soil below 0.5 m, for the low-yielding class. Surface-soil ESP was significantly higher for the low-yielding class, above the threshold of ESP >6, than in the high-yielding class to 0.5 m soil depth. Differences in soil NO3-N were not significant between classes. Soil moisture at CLL was significantly different between the low-yielding class and the high-yielding class only between 0.3–0.7 m soil depth.
The Garah site (189 ha) has relatively little lateral variability in clay content and is classified as a grey Vertosol (Figure 4 (bottom)). The central and southern parts of the field have poor water infiltration and are low yielding (mean barley yield = 2.42 t/ha) compared with the rest of the field (mean barley yield = 2.75 t/ha). Additionally, the middle part of the field has relatively high in ECa-CLL (mean = 281 mS/m) compared with the remaining field (mean = 235 mS/m). In general, the whole field had relatively high chloride concentrations, but concentrations were significantly lower in the high-yielding class at all soil depths. There was also a significant difference in water-soluble sodium concentrations and ECse between the classes between 0.3 and 1.1 m in the profile. In general, both soil sodium and ECse followed a similar pattern throughout the soil profile. ESP values to 0.5 m depth were significantly higher for the low-yielding class when compared with high-yielding class. NO3-N concentrations were significantly higher in low-yielding class compared with the high-yielding class up to 0.4 m soil depth. In general, soil profile moisture contents at CLL were slightly higher for the low-yielding class than the high-yielding class at depths between 0.5 and 0.9 m.
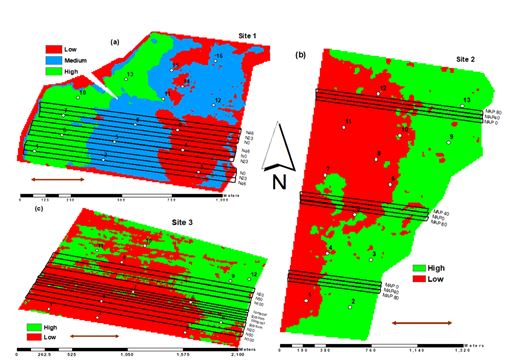
Figure 4. Potential management classes based on grain yield and ECa-LL for: (a) Site 1, Biloela, (b) Site 2, Goondiwindi and (c) Site 3, Garah. The brown arrow in each is the direction of field operations. White dots and numbers denote the locations of the soil samples taken in each field.
Managing spatial variability
Figure 5 shows the yield response to applied nitrogen for the three potential management classes at the Biloela site. No significant response to applied N was obtained in the low-yielding (constrained) class; however, significant linear increases were obtained for wheat grain yield for both the medium- and high-yielding (unconstrained) classes. The nitrogen requirement for each management class (Table 1), calculated using realistic yield potential, soil nitrogen to 0–0.9 m, and a protein goal, showed that the low-yielding class (20 ha) had substantial un-utilised NO3-N in the soil profile. Application of 46 kg N/ha to this class—the farmer’s conventional practice—results in net wastage of 2.0 t of urea.
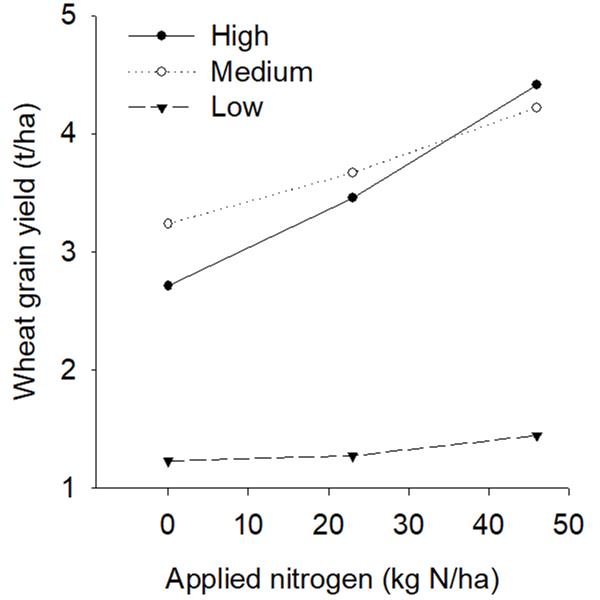
Figure 5. Wheat yield response to applied nitrogen in the low-, medium-, and high-yielding management classes at Biloela
At a standard price of nitrogen, this is worth $46/ha/annum and is coupled to potential environmental pollution due to nitrate-N leaching into ground water. The conventional application for the medium-yielding class appears to be well-prescribed, with negligible wastage evident. The high-yielding class (16 ha), on the other hand, is under-fertilised by the conventional application rate, with an additional 3.9 t urea required.
At the Goondiwindi site, wheat yield showed a characteristic non-linear response to the different rates of MAP application for the high-yielding (unconstrained) class (Figure 6a), with yield maximised at the conventional application rate of 40 kg MAP/ha/year. In contrast, the low-yielding (constrained) class showed negligible response to MAP. The gross margins at 40 kg MAP/ha were estimated to be $12.0/ha/annum for the unconstrained class and $21.0/ha/annum for the constrained class. The gross margins at 80 kg MAP/ha were negative for both classes. These results suggest a sensible variable-rate management strategy for MAP applications on the field: retain the conventional MAP application rate for the unconstrained class but stop application of MAP to the constrained class. Under this rationale, assuming that the responses in Figure 6a apply equally to the constrained area of the whole paddock, the financial benefit of variable-rate management would represent a saving of $32/ha/annum.
Table 1. Nitrogen need analysis for comparisons between field-uniform application of nitrogen (46 kg N/ha) and for optimised variable rate for the Biloela site
Low-yielding class (20 ha) | Medium-yielding class (28 ha) | High-yielding class (16 ha) | Field average | |
|---|---|---|---|---|
Average wheat yield (t/ha) | 1.27 | 2.22 | 3.36 | 2.21 |
Nitrogen requirement (kg/ha) | 59 | 100 | 150 | 101 |
Available NO3-N in 0–0.90 m soil (kg/ha) | 119 | 55 | 36 | 70 |
Actual N required (kg/ha) | 0 | 45 | 114 | 31 |
Consequence of uniform N application | 2.0 t urea wasted | 0.06 t urea required | 3.9 t urea required | 2.0 t urea Required |
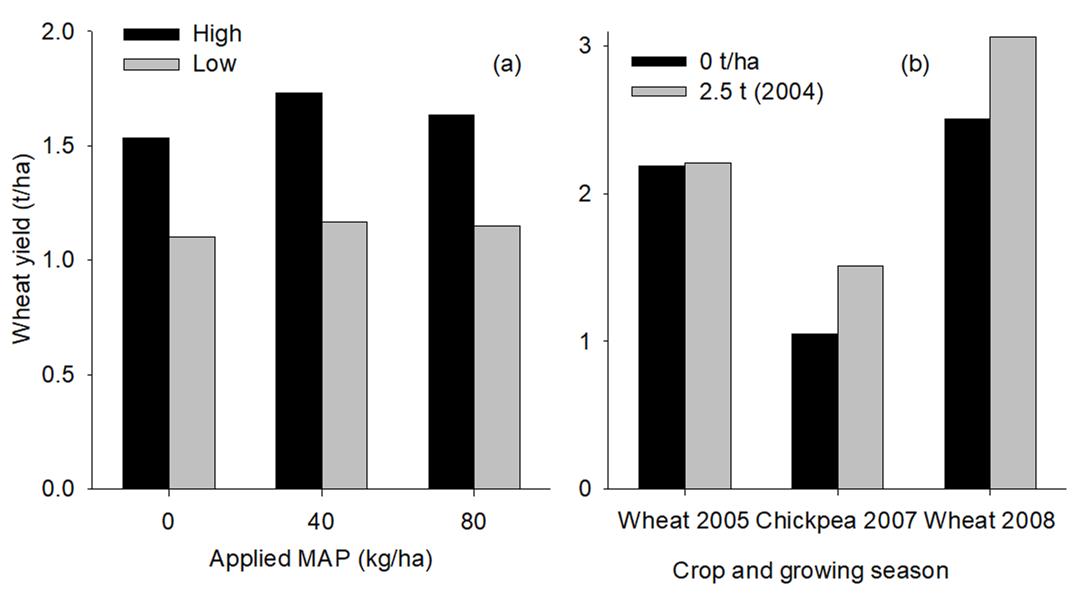
Figure 6. Results of on-farm experiments at the Goondiwindi site:(a)wheat yield response to applied MAP for the low- and high-yielding classes; and (b) yield response to applied gypsum seen on constrained areas.
Gypsum applied to adjoining farm at 2.5 t/ha in 2004 had no effect on wheat grain yield in 2005, but significantly increased chickpea grain yield by 0.46 t/ha in 2007 and significantly increased wheat grain yield by 0.56 t/ha in 2008 (Figure 6b). The delayed effect of the applied gypsum was expected because its movement through the soil profile is dependent on rainfall. The cumulative economics of a single gypsum application to the constrained class, for two wheat crops and one chickpea crop, would translate to an accumulated profit of $232/ha/3 yr.
At the Garah site, applied N up to 50 kg N/ha significantly increased barley grain yield in both the low-yielding (constrained) class and the high-yielding (unconstrained) class (Figure 7). However, in the constrained class, the gross margin was $45/ha at 50 kg N/ha and decreased to -$12/ha at 100 kg N/ha, while in unconstrained areas the gross margin was $49/ha at 50 kg N/ha and decreased to $10/ha at 100 kg N/ha. Both gypsum and compost significantly increased barley grain yield in both the constrained and unconstrained classes in the first year of its application (Figure 7).
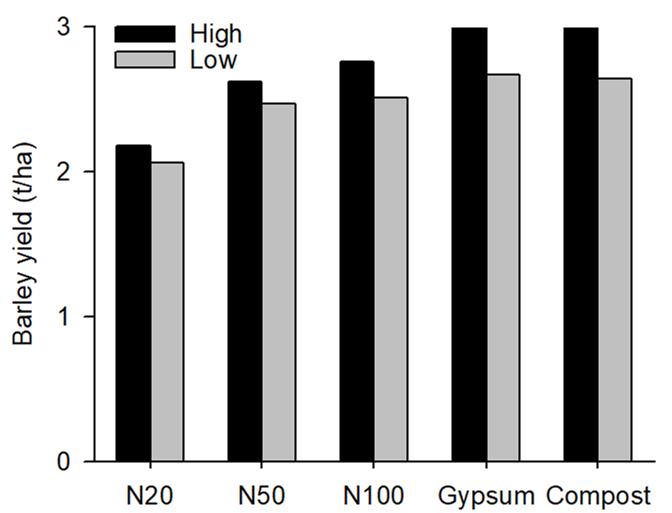
Figure 7. Barley yield response to applied nitrogen, gypsum and compost in the low-and high-yielding classes at Garah
Discussion
Using ECa to partition soil into regions of similar production potential as a means to describe within-field variability and create management classes requires an understanding of the relationships between ECa and grain yield. In the present study, at all three sites there was a strong negative relationship between ECa-CLL and mean grain yield (Figure 2), allowing identification of management classes based on ranges of ECa-CLL. The results further suggest that the soil properties integrated in ECa-CLL observations are related to yield limitations in these soils. However, inconsistent relationships have been reported between ECa and crop yields across years and locations among published reports (Kitchen et al. 1999; Johnson et al. 2003). In areas with high rainfall, the relationships between ECa and grain yield tends to be positive (Kitchen et al. 1999) while in semi-arid regions, especially for winter crops, the relationship between ECa and grain yield has been found to be negative (Johnson et al. 2003). This could be due to the fact that ECa primarily measures salt concentrations (McNeill 1992) and the impact of high salt concentrations is evident mainly in drier years (Sadras et al. 2003; Dang et al. 2010). Jung et al. (2005) showed that the sign of the correlation between ECa and grain yield for claypan soils followed the pattern of in-crop rainfall (ICR): there was a positive correlation in years with >150 mm of in-crop rainfall, compared with a negative correlation for years with <150 mm of in-crop rainfall. In the former, higher rainfall dilutes the salt concentration in the soil solution, thus minimising the salt effect on crop yields while in the latter, high salt concentrations in the soil solution of readily soluble sodium and chloride adversely affect crop yields. They summarised that rainfall affected grain yield more than the variations in soil properties. In the present study, all three sites were in semi-arid regions, where insufficient in-crop-rainfall (i.e. in most years <150 mm) poses the primary limitation to crop production. Under these climatic conditions ECa-CLL may be a more consistent predictor of winter cereal grain yield potential than ECa-DUL values.
For farmers to adopt class-based site-specific management, the development of management classes must be simple, functional and economically feasible. We have assumed that all the fields we studied could be partitioned into at least two management classes. Taylor et al. (2007) stated that it is rare for more than three classes to be justified, regardless of the size of the field. As a first approximation, the classes could be delineated using farmer’s personal observations of the variability of grain yield in an individual field. We have found that experienced farmers have a fairly good understanding of yield variability within their fields. This is supported by the findings of Oliver et al. (2010). By working closely with farmers and using EM38 surveys, it is possible to devise a class-based management strategy for individual fields.
Site-specific soil and nutrient management
Identifying the spatial variability of soil constraints could provide an opportunity to ameliorate soil, resulting in economic and environmental benefits. For example, in the present study, gypsum application provided a financial benefit of $207 ha over 3–4 years at Site 2, and also provided a significant yield response at Site 3 with the expectation of recovering the variable costs in subsequent years. The potential environmental benefits would be increased rooting depth, increased PAWC and reduced concentrations of sodium chloride in the soil profile (Dang et al. unpublished data), with increased infiltration and improved surface drainage (Jaywardane and Chan 1995). The range in potential economic benefits by reducing input costs is similar to the benefits derived by others (Robertson et al. 2007; Fisher et al. 2009). The environmental benefits can be significant when using site-specific management in which the right amount of input is applied to each location. The presence of un-utilised nitrate-nitrogen in the constraint areas poses greatest risk to N-leaching (Wong et al. 2006).
Conclusion
Vertosols exhibited the greatest variation in soil properties associated with soil constraints, including ECse, soil chloride and sodium concentrations integrated over a soil depth of 1.5 m for the three sites considered. The EMI (electromagnetic induction) provided the best estimates of the deep subsoil properties and especially soil chloride and soil moisture. This is important because high concentrations of chloride below 0.9 m (0.9–1.5 m) restrict water extraction by crop from the subsoil and is associated with reduced grain yield. Since solid-solution phases of gypsum contributes to low and relatively similar ECa at different soil moisture contents, and gypsum is common in many soils of the region, it is suggested that ECa measurements should be functionally related to soil solution sodium and chloride.
The ECa showed strong negative correlations between grain yields both at DUL and CLL but more strongly with the latter. Strong correlations among ECa-CLL, soil properties associated with soil constraints and winter cereal grain yields indicated that ECa-CLL portioned management classes satisfactorily. Simple on-farm experiments provided an excellent framework for economic and environmental assessment to make management more precise by targeting constraint areas of the paddock or farm.
References
Blackmore, S, Moore, M (1999) Remedial correction of yield maps. Precision Agriculture 1, 53–66.
Dang YP, Dalal RC, Pringle M, Biggs AJW, Darr S, Moss J, Payne J, Orange D (2011) Electromagnetic induction sensing of soil identifies soil constraints to crop production in north-eastern Australia. Australian Journal of Soil Research 49, 559-571.
Dang YP et al. (2010) Diagnosis, extent, impacts and management of subsoil constraints in the northern grains cropping region of Australia. Australian Journal of Soil Research, 48, 105–119
Dang YP et al. (2008) High subsoil chloride reduces soil water extraction and crop yield from Vertosols. Australian Journal of Agricultural Research, 59, 321–330
Dang YP et al. (2006)Subsoil constraints to grain production in the cropping soils of the north-eastern region of Australia: an overview. Australian Journal of Experimental Agriculture, 46, 19–35
Fisher PD, Abuzar M, Best F, Rab MA (2009) Advances in precision agriculture in south-eastern Australia, Part I: A methodology for the combined use of historical paddock yields and Normalised Difference Vegetation Index to simulate spatial variation in cereal yields. Crop and Pasture Science 60, 844–858.
Jayawardane NS, Chan KY (1995) The management of soil physical properties limiting crop production in Australian sodic soils—a review. Australian Journal of Soil Research 32, 13–44
Johnson CK, Mortensen DA, Wienhold BJ, Shanahan WJ, Doran JW (2003) Site-specific management zones based on soil electrical conductivity in a semiarid cropping system. Agronomy Journal 95, 303–315
Kitchen NR, Sudduth KA, Drummond ST (1999) Soil electrical conductivity as a crop productivity measure for claypan soils. Journal of Production Agriculture 12, 607–617
McBratney AB, Pringle MJ (1999) Estimating average and proportional variograms of soil properties and their potential use in precision agriculture. Precision Agriculture, 1, 125–152
McNeill JD (1992) Rapid, accurate mapping of soil salinity by electromagnetic ground conductivity meters. In ‘Advances in measurement of soil physical properties: bringing theory into practice’. Special Publication No. 30. pp. 209–29 (Soil Science Society of America: Madison, WI)
O’Leary G, Ormesher D & Wells M (2003) Detecting subsoil constraints on farms in the Murray Mallee. In ‘Proceedings of the 11th Australian Agronomy Conference’, Geelong, Victoria
Oliver YM, Robertson MJ, Wong MTF (2010) Integrating farmer knowledge, precision agriculture tools, and crop simulation modelling to evaluate management options for poor-performing patches in cropping fields. European Journal of Agronomy 32, 40–50
Robert PC (2002) Precision Agriculture: a challenge for crop nutrition management. Plant and Soil, 247, 143–149
Robertson M, Isbister B, Maling I, Oliver Y, Wong M, Adams M, Bowden B, Tozer P (2007) Opportunities and constraints for managing within-field spatial variability in Western Australian grain production. Field Crops Research, 104, 60–67
Sadras V, Baldock J, Roget D, Rodriguez D (2003) Measuring and modelling yield and water budget components of wheat crops in coarse-textured soils with chemical constraints. Field Crops Research 84, 241–260
Taylor JA, McBratney AB, & Whelan BM (2007) Establishing management classes for broadacre agricultural production. Agronomy Journal, 99, 1366–1376
Whelan BM, McBratney AB, & Minasny B (2001) Vesper spatial prediction software for precision agriculture. In ‘Proceeding 3rd European Conference on Precision Agriculture’ (Eds G Grenier, S Blackmore), Montpellier, France, 18–20 June 2001. pp. 139–144
Wong MTF, Asseng S, Zhang H (2006) A flexible approach to managing variability in grain yield and nitrate leaching at within-field to farm scales. Precision Agriculture 7, 405–417.
Acknowledgements
The research undertaken as part of this project is made possible by the significant contributions of growers through both trial cooperation and the support of the GRDC. The authors sincerely thank them for their continued support for this research.
Contact details
Yash Dang
School of Agriculture and Food Sciences
The University of Queensland
Mb: 0427 602 099
Email: y.dang@uq.edu.au
GRDC code: DNR00008
GRDC Project Code: DNR00008,
Was this page helpful?
YOUR FEEDBACK
