Validating the SclerotiniaCM app for managing sclerotinia in canola
Author: Bonnie Jupp, Alice Butler, Ciara Beard, Anne Smith, Laurie Wahlsten, Bec Swift and Jean Galloway, DPIRD | Date: 25 Feb 2019
Key Messages
- SclerotiniaCM is an app to aid growers and consultants in making economic fungicide application decisions to manage Sclerotinia in canola. Petal testing, fungicide trials and sclerote germination monitoring were used to validate the SclerotiniaCM app which was undergoing testing in the 2018 season. The app is due for release in 2019.
- The South Coast experienced a drier start to 2018 and this produced patchy emergence of canola as well as delayed apothecia germination (late August) and disease development. In contrast, most of the Geraldton Port Zone experienced periods of constant moisture from July to early September and thus highly conducive conditions for apothecia germination (mid-July) and crop disease development. The SclerotiniaCM app correctly identified the value of applying a fungicide spray in trials and large-scale demonstrations in commercial crops in the Geraldton port zone while suggesting spraying would not be worthwhile on the south coast.
- Apothecia observations, petal infection, disease progress and yield results from both the Geraldton and Albany port zones confirmed the SclerotiniaCM app offers an easy and useful tool for making decisions on whether or not to apply fungicide for Sclerotinia management.
Aim
Sclerotinia is a difficult disease to manage in canola as spray decisions are best made before the disease visibly develops in crop. The disease has three trigger points that require the weather being conducive for: 1) sclerotia to germinate to form apothecia, 2) petal infection and 3) crop infection when petals drop into the canopy. Sometimes disease does not eventuate because of dry weather during any of these three stages. The aim of this work was to use a range of tools to determine if we can be confident that the SclerotiniaCM app is producing reliable outputs that will help canola growers make informed management decisions in a given season. These tools were apothecia observations, petal testing, disease observations and fungicide trials and demos in the Geraldton and Albany port zones.
Method
Monitoring in-season Sclerotinia development for better management had five main components; monitoring of apothecia germination (including automated imaging systems usage), petal testing, running the SclerotiniaCM app, fungicide trials and farm scale management demonstrations to gather data to validate the app.
Sclerote depot monitoring
Sclerotia, collected locally in 2017, were placed within canola paddocks in 2018 at Woogenellup (near Mt. Barker), Northam, Toodyay and at multiple sites in the Geraldton port zone. At the Northam and Toodyay sites, sclerotia that formed in the 2016 season were also used. The sclerotia were exposed to natural weather conditions within the crop canopy. Automated imaging systems were used to monitor apothecia germination at Woogenellup, Northam and Toodyay. The systems used a Samsung smart phone with an app programmed to take photos hourly of sclerotia and then upload them to a server that could be accessed remotely. Sclerote depots were routinely checked by DPIRD staff to determine when they germinated to form apothecia and how long the apothecia persisted. This was done in person by DPIRD staff for depots in the Geraldton port zone and by remotely viewing the photos of the Woogenellup, Northam and Toodyay depots. This information was used as an indication that the disease cycle was starting and was made available to growers via PestFax and Twitter.
Petal testing to determine presence of aerial disease spores
Petals were collected weekly from four commercial canola crops on the South Coast (Woogenellup, South Stirling, Frankland), one crop in the central wheatbelt (Toodyay) and three near Geraldton (East Chapman, Greenough and Moonyoonooka) from early flowering (10 per cent bloom) to late flowering (60 per cent bloom) and analysed using Morrall and Thomson (1991) method for testing petal infection. This involved plating 4 petals (10 reps per treatment and sampling date) onto commercially available media (potato dextrose agar) that promoted the growth of Sclerotinia, leaving plates to incubate for four to five days and then scoring the number of Sclerotinia-infected petals out of the total number plated and expressing this as percent petal infection. Petal infection levels were provided to the growers to aid in spray decisions and to confirm that disease was present at the time that the SclerotiniaCM app was being used to make spray decisions.
Fungicide trials
Two small plot Sclerotinia fungicide application timing trials, one in Greenough and one in Frankland were established in commercial canola crops prior to crop flowering to gather data on yield loss due to disease in these locations and compare different management options. Both sites had a history of Sclerotinia and other site details are shown in Table 1. Fungicide was applied by boom spray on the back of a ute at 100 L/ha water volume. Sclerotinia symptoms were assessed during the season and at crop maturity in both trials by examining 40 random plants in four stops per plot without pulling plants up. The plants were scored for the worst symptom only, out of the following criteria: lesion on lateral branch, lesion on primary branch, dead lateral branch, dead primary stem, plant lodged due to sclerotinia.
Table 1. Trial details for the fungicide application timing trials conducted at Frankland and Greenough in 2018.
| Frankland (Albany) | Greenough (Geraldton) |
|---|---|---|
Rotation | Cereal, TT canola, cereal, IT canola | Canola, lupin, cereal |
Variety | Pioneer 45Y25 | Hyola 404RR |
Expected yield | 2 t/ha | 1.5 t/ha |
Soil type | Gravelly loamy sand | Clay |
Trial treatments One early spray (20-30% bloom) – One late spray (50% bloom) – Two sprays (early and late) Unsprayed (control) | 20/08/18 06/09/18 20/08/18 and 06/09/18 | 02/08/18 16/08/18 02/08/18 and 16/08/18
|
SclerotiniaCM app and large scale on-farm demonstrations
The SclerotiniaCM app has been developed by DPIRD and GRDC to examine the economics of applying fungicide for sclerotinia. The app uses disease history on farm, current and predicted weather conditions, the cost of producing canola as well as predicted yield and price to work out the likelihood of generating a positive return from spraying. Growers from South Stirling, Frankland, Woogenellup, Monjebup, East Chapman, Greenough and Moonyoonooka provided information for paddocks being petal tested and the app was updated periodically with weather conditions to determine the likelihood of generating a positive return from spraying.
Large-scale on-farm demonstrations were established with +/- fungicide in growers’ paddocks at Frankland, East Chapman, Greenough and Moonyoonooka to gather yield data to compare with the SclerotiniaCM app (Table 2). A registered fungicide was applied by the growers. Each area, sprayed or unsprayed, was approximately a boom width x 50m. At crop maturity, 300 plants in each area were assessed for sclerotinia symptoms without pulling plants up. The plants were scored for the worst symptom as per the scoring method above. Four strips were harvested from each area at the end of the season and yield and grain quality assessments done.
Table 2. Details for the large scale +/- fungicide demonstrations conducted in the Geraldton Port Zone (PZ) in 2018.
| Greenough (Geraldton PZ) | East Chapman (Geraldton PZ) | Moonyoonooka (Geraldton PZ) |
|---|---|---|---|
Rotation | Canola, lupin, cereal | Canola, lupin, cereal | Canola, lupin, cereal |
Variety | Nuseed GT-42 | Pioneer 43Y23 | Pioneer 43Y23 |
Expected yield | 1.7 t/ha | 2.2 t/ha | 1.7 t/ha |
Soil type | Clay | Loam | Loam |
Apothecia first observed | 18/07/18 | 25/07/18 | None observed |
Fungicide treatment (sprayed and unsprayed): | sprayed at 30-40% bloom on 10/8/18 | sprayed at 30% bloom on 06/08/18 | sprayed at 30% bloom on 7/8/18 |
Results
Apothecia emergence and petal testing
Petal infection varied considerably between sites and over time, depending on time of ascospore release from apothecia, variety, flowering time and better crop establishment creating a denser canopy.
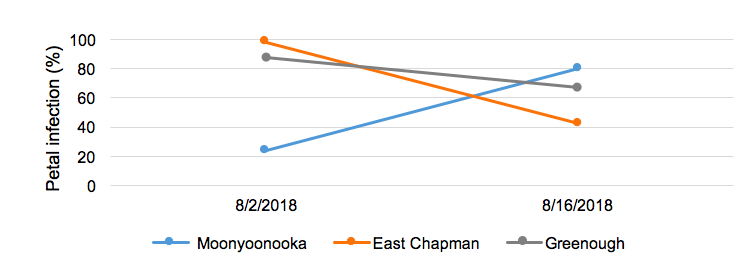
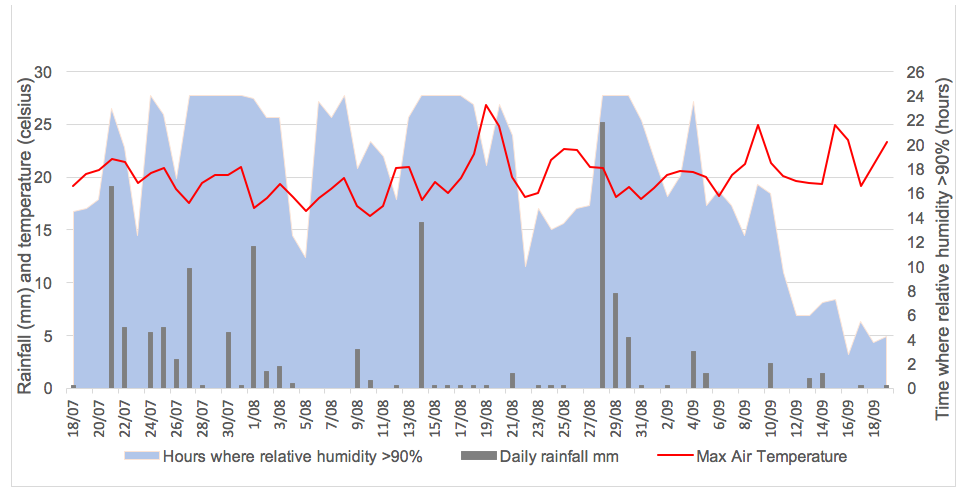
In the Geraldton Port Zone, apothecia were first observed at the Greenough and East Chapman sites on the 18 July and 25 July respectively and were plentiful, in response to substantial early July rainfall and subsequent ongoing conducive weather conditions (Figure 2). They were still persisting and new ones forming a month later, while they were scarce at the Moonyoonooka site. The East Chapman and the Greenough sites recorded very high petal infection on 2 August (98% and 88% respectively) when both were at 30 per cent bloom (Figure 1). Infection levels dropped over time at both of these sites with 43 and 67 per cent respectively found on 16 August when the crop was at 40 per cent bloom. The Moonyoonooka site, which flowered later, had low infection initially (24 per cent on 2 August), but this increased to 80 per cent on 16 August (Figure 1).
In the central wheatbelt at Northam and Toodyay, sclerotia germinated to produce apothecia in mid-July and persisted for a two-month period. Sclerotia formed in the 2016 season germinated at a similar time to the sclerotia produced in 2017 and persisted in a similar manner. The period in which the 2016 and 2017 sclerotes germinated coincided with flowering of the canola crops in this area. Petal testing of the trial at Toodyay on 21 August recorded 60-100% petal infection, confirming that infection had occurred during flowering.
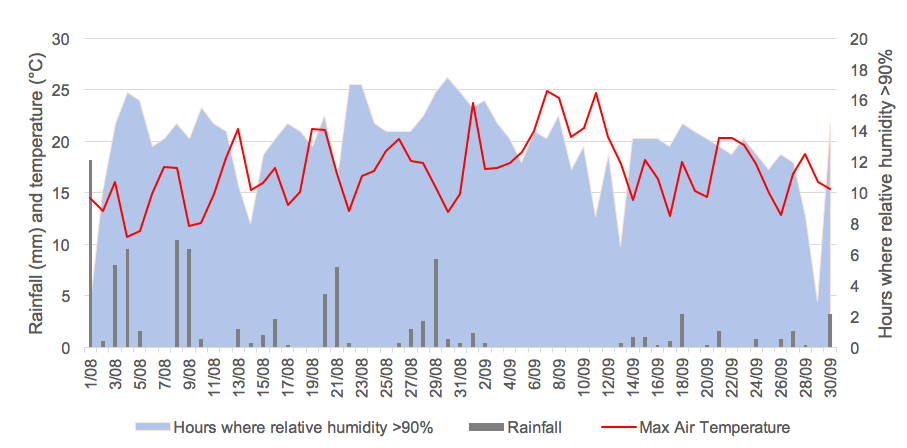
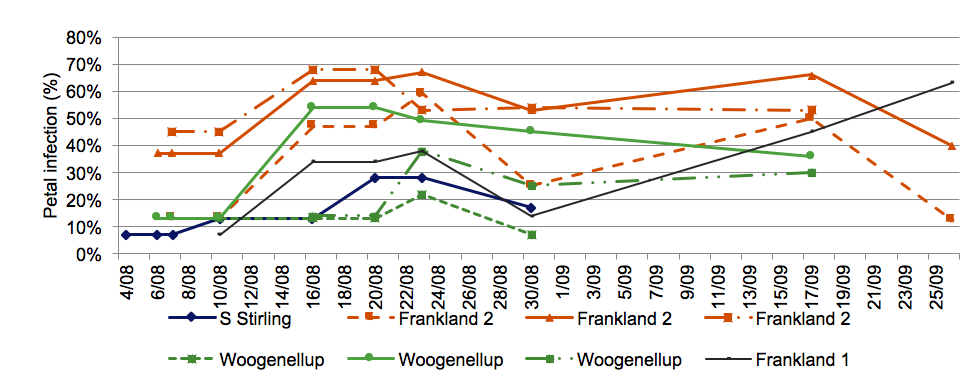
On the south coast, the first observed apothecia emergence at Woogenellup via the automated imaging system was on 23 August. This coincided with two days where relative humidity was greater than 90 per cent for 17 hours and a general increase in maximum air temperature (Figure 3). These apothecia persisted until 12 September (approximately 3 weeks). Petal infection in this paddock was highest on both 16 and 20 August at 54 per cent and from there infection levels steadily declined to 36 per cent on 17 September (Figure 4). Petal infection at the sampled south coast sites ranged from 7 – 68 per cent in August-September (Figure 4). Growers were very intrigued with petal test results as there was no visual signs of disease in crop until 40 – 50 per cent flower, the end of the spraying window. The South Stirling and Woogenellup sites had the lowest petal infection levels for the testing period, both of these crops flowered earlier than the other sites and escaped most of the ascospore release (Figure 4). September rainfall was below average for all sites with a total of 16.6 mm at the DPIRD Stirlings South station and 19.8 mm at the DPIRD Frankland weather station (Figure 3).

Figure 1. Petal infection levels at three sites in the Geraldton Port Zone in August 2018 at approximately 30% and 50% flowering.

Figure 2. Maximum air temperature and rainfall at the Greenough trial site and hours where relative humidity under the crop canopy was >90%, for the 24hr period after the date for 18 July to 19 September (after 19 September there was no significant rain).

Figure 3. Maximum air temperature and rainfall at DPIRD Stirlings South weather station (8km SE from Woogenellup site) and hours where relative humidity was >90%, for the 24hr period after the date for August and September 2018.

Figure 4. Petal infection levels of paddocks in Frankland, Woogenellup and South Stirling from 4 August to 26 September 2018 (10 – 60 % flowering). Multiple sites were monitored in a paddock at Frankland and at Woogenellup.
SclerotiniaCM app
On the South Coast, growers reduced their target yields as the season progressed. The Monjebup growers did not consider spraying for sclerotinia in 2018 due to poor yield potential, their decision was supported by the negative net returns calculated by the app (Table 3). Growers from the other sites were routinely checking paddocks and followed petal infection results closely for direction on sclerotinia management. The SclerotiniaCM app predicted a positive net return from a single spray at these sites. For the Frankland 1 site the app predicted a 7 per cent yield gain, unfortunately, the trial could not be harvested due to waterlogging damage.
Table 3. Mean net return ($/ha) from a single fungicide spray calculated by SclerotiniaCM app for South Coast paddocks at Frankland, Woogenellup, South Stirling and Monjebup for 3 dates at 10-15% flowering based on growers estimated target yields.
Sites | Jul-30 | Aug-03 | Aug-08 |
|---|---|---|---|
Frankland 1 | $36 | $30 | $11 |
Frankland 2 | $53 | $47 | $24 |
Woogenellup | $51 | $52 | $14 |
South Stirling | $44 | $18 | $22 |
Monjebup | -$18 | -$24 | -$28 |
In the Geraldton port zone, growers increased their target yields in the app as the season progressed as the ongoing winter rainfall increased yield potentials. All growers at the three sites (Greenough, Moonyoonooka and Chapman) decided to apply fungicide for sclerotinia in 2018 due to the conducive season even before receiving the petal infection results. The SclerotiniaCM app calculated a yield response of 13-16% at all the sites from a single fungicide application at 20% bloom. The app calculated that net returns from fungicide application would be high at all three sites for a single fungicide spray (Table 4) but suggested there would be no benefit applying a second spray at 50% bloom at these locations in 2018 (Table 4). The app correctly estimated the yield gain that could be achieved at the Greenough trial from a single fungicide application (16%), (Table 5). The benefits of a second spray at the Greenough trial were not picked up by the app (Table 5).
Table 4. Mean net return from first and second fungicide sprays calculated by SclerotiniaCM app for Geraldton port zone paddocks at Moonyoonooka, East Chapman and Greenough. First spray at 20% flowering and a second spray at 50% flowering.
Site | Jul-26 (first/single spray) | Aug-16 (second spray) |
|---|---|---|
Moonyoonooka | $98 | -$15 |
East Chapman | $73 | -$19 |
Greenough | $88 | -$32 |
Table 5. Yield gain comparison between predictions from the SclerotiniaCM app and the Greenough spray trial from a) a single early spray (20% bloom), and b) two spray treatment (one early spray at 20% bloom) and a second late spray (at 50% bloom). * the two spray (early and late) treatment only had two replicates recorded for yield due to a faulty harvester.
Treatment (spray decision) | Yield (t/ha) | % Yield gain (Trial result) | % Yield gain (App prediction) |
|---|---|---|---|
Do not spray (No spray) | 2.2 | ||
Apply a single spray at 20% bloom | 2.5 | 16 | 16 |
Apply a second spray at 50% bloom | 3.0* | 20 | 0 |
Fungicide timing trials and large scale on-farm demos
Geraldton port zone
In 2018, the Geraldton port zone experienced periods of regular rainfall and ongoing moisture from July onwards along with cool temperatures and high humidity (Figure 2), highly conducive conditions for sclerote germination and disease development. These conditions, coupled with noticeably large numbers of apothecia sightings throughout the season prompted the vast majority of growers in sclerotinia risk areas to conduct an early flowering spray, with some turning to a second spray in high disease pressure areas. Sclerotinia stem and basal infection levels were high in Geraldton.
Basal infection was present in the Greenough trial with stem infection at ground level occurring prior to flowering. The 20-30% bloom spray appeared to reduce symptoms of basal infection when the trial was assessed at 50 per cent bloom, but this effect was not evident when the trial was scored at the end of the season.
Fungicide application significantly reduced sclerotinia stem infection (Table 6) and this was particularly evident in disease on the primary stem and number of plants lodged due to disease.
Table 6. Disease scores at the Greenough trial as a percentage of infected plants showing each symptom, scored on 10 October 2018. Only scores significantly different (p<0.05) between treatments are shown. Early spray at 20-30% bloom, late spray 50% bloom.
Symptom description/Treatment | Unsprayed | Early Spray | Late spray | 2 sprays |
|---|---|---|---|---|
No infection | 41 | 60 | 60 | 72 |
Primary stem has lesion | 6 | 5 | 3 | 0 |
Lateral branch is dead or dying | 9 | 11 | 8 | 11 |
Primary stem is dead or dying | 25 | 13 | 16 | 8 |
Lodged | 13 | 6 | 9 | 8 |
In the Greenough trial the double spray strategy (20% and 50% applications) significantly increased yield though this result may not be robust as the number of replicates in this treatment were reduced. Single fungicide applications did not give a significant yield response (Table 7). There were no differences between treatments for protein levels, moisture, oil and 1000 grain weight - averages across the trial were 20.8 per cent protein, 7.2 per cent moisture, 42.3 per cent oil and 3.5g for 1000 grain weight.
Table 7. Yield (t/ha) and grain protein (%) results from Greenough spray trial, harvested 26 October 2018. * the two spray (early and late) treatment only had two replicates recorded for yield due to a harvester fault.
Treatment | Grain yield (t/ha) |
|---|---|
Unsprayed | 2.1 |
1 Spray Early (20% bloom) | 2.5 |
1 Spray Late (50% bloom) | 2.4 |
2 Sprays (early & late) (20% & 50%) | 3.0* |
Lsd (5%) | 0.45 |
In the large scale on-farm demos at Moonyoonooka, East Chapman and Greenough, a single fungicide spray significantly reduced disease at each site predominantly due to reduced death of lateral and primary branches (Table 8). However, there was no significant yield response to fungicide at two out of three of the sites likely due to the hot dry spring which finished the season abruptly. There were some minor grain quality differences. Untreated yields were 1.8 t/ha at Moonyoonooka, 2.5 t/ha at East Chapman 2.5 t/ha and at Greenough there was a 3 per cent yield increase (significant at p<0.01) with unsprayed yielding 1.8 t/ha and sprayed 1.9t/ha.
Table 8. Disease scores as a percentage of plants in a 30 x 50 m area (0.15 ha) for each treatment showing each disease symptom at the three on-farm demos, scored on 10 October 2018. Cultivar Pioneer 43Y23 at Moonyoonooka, Nuseed GT-42 at Greenough and Pioneer 43Y23 at East Chapman.
Treatment | Healthy | Dead lateral | Dead primary | Lodged |
|---|---|---|---|---|
Unsprayed Moonyoonooka | 74 | 7.7 | 12 | 0 |
Sprayed Moonyoonooka | 91 | 5.0 | 2.3 | 0 |
Lsd (5%) | 6.84 | ns | 4.75 | ns |
Unsprayed Greenough | 77 | 11 | 8 | 2.0 |
Sprayed Greenough | 88 | 6 | 3 | 0.7 |
Lsd (5%) | 6.02 | 4.13 | 4.01 | 2.54 |
Unsprayed East Chapman | 80 | 8 | 7 | 1.3 |
Sprayed East Chapman | 93 | 4 | 2 | 0 |
Lsd (5%) | 5.45 | 3.75 | 3.76 | ns |
Albany port zone
At all of the South Coast sites, sclerotinia stem and basal infections were found; however, disease pressure was low due to the dry September. Of the four South Coast petal testing site, Frankland 2, which had the highest petal infection was the only site that a grower chose to apply fungicide to control disease. The grower applied fungicide on 26 August at late flowering (40-50 per cent), however harvest cuts recorded no yield benefit.
At the Frankland trial there were no observations of apothecia or sclerotinia symptoms prior to or at the time of the first spray on 20 August at early flowering (20 – 30 per cent). Disease did develop and scoring at the end of the season recorded significantly lower infection in the sprayed plots (Table 9). Basal infection occurred but fungicide had no significant influence on it. There was a higher percentage of lateral branches and primary stems dying from diseasein the unsprayed plots compared to the sprayed. The early spray did not significantly reduce disease on the lateral branches, but the late spray gave a significant reduction (6.7 per cent).
Table 9. Disease scores at the Frankland trial as a percentage showing each symptom, scored on 14 November 2018. Only scores significantly different between treatments (p<0.05) are shown. There was no lodging from disease observed.
Symptom description | Unsprayed | Early Spray | Late Spray | 2 sprays |
|---|---|---|---|---|
No infection | 50 | 70 | 66.7 | 73.3 |
Primary stem has lesion | 15 | 10 | 10 | 13.3 |
Lateral branch is dead or dying | 17.5 | 15 | 6.7 | 6.7 |
Primary stem is dead or dying | 10 | 5 | 6.7 | 3.3 |
Conclusion
Even if sclerotia are observed to germinate and petal infection levels are high, disease pressure can still be low if subsequent weather conditions are not conducive for crop infection when the petals drop into the crop canopy. The sclerote depots and petal testing provide an indication of potential disease pressure in a season but do not guarantee disease will occur in crop. Apothecia germination and petal infection coupled with paddock history may aid in spray decisions, but as disease development is so dependent on weather conditions in the following two-three weeks after spraying, this is not a perfect strategy.
The SclerotiniaCM app offers an easier and potentially more useful tool for making decisions in the paddock on whether or not to apply fungicide for sclerotinia management. Testing of the app in commercial crop situations showed it gave an accurate estimate of the value of applying fungicide or not in the 2018 season. In the Albany port zone, the dry weather and late apothecia germination meant fungicide application was not worthwhile and this was reflected in the app outputs for this area showing negative net returns and yield assessment at Frankland. In the Geraldton port zone, where the winter months were consistently wet and apothecia plentiful from mid-July, the app outputs for the three sites clearly showed that a single fungicide spray around 20-30% bloom (early August) would be beneficial and likely to give a yield response of 13-16%. This however, was not realised due to the dry spring finishing the season abruptly and halting disease progress. Work is continuing on progressing the app to enable the value of a second fungicide spray in high disease risk seasons and more marginal areas to be determined. In using this app, due to be released in 2019, growers and agronomists can gauge if the probability of the return from applying fungicide will be worth the time and effort depending on their specific circumstances.
References
Morrall RAA and Thomson JR.1991. Petal Test Manual for Sclerotinia in Canola. University of Saskatchewan, pp. 1-27. ISBN 0-88880-248-X.
Varieties displaying this symbol are protected under the Plant Breeders Rights Act 1994.
Acknowledgments
Thanks to GRDC and DPIRD for funding the research and the growers who hosted the trials and demonstrations. We would like to thank Art Diggle for supplying the SclerotinaCM prototype and providing support to Alice, Bonnie and Ciara in the use of the app, the DPIRD research support unit staff at Geraldton (Steve Cosh, Trevor Bell and Larry Prosser) and Albany for seeding and harvesting trials and demonstrations. Christiaan Valentine, Tim Scanlon, Kanchana Wickramarachchi and Dave Nicholson, DPIRD, for the use of the sclerote automated imaging system and access to the images.
GRDC Project Numbers:
DAW00256: Building crop protection and crop production R&D capacity in regional Western Australia
Project 9176863: Disease epidemiology and management tools for Australian grain growers
Paper reviewed by: Andrea Hills
Was this page helpful?
YOUR FEEDBACK
