Hay – how is it ‘stacking up’?
Author: Colin Peace (Jumbuk Ag) | Date: 14 Mar 2019
Take home messages
- Domestic and export demand for hay remain solid in short term.
- Export prices are matching those of domestic drought demand.
- Suggest accessing export oaten hay market with a new crop contract.
Background
Hay in the rotation benefits future grain crops and is an option for many in difficult seasons. 2018 has seen large areas of cereal and canola crops cut for hay, much of which currently remains for sale on-farm. Hay prices are high but can change rapidly according to weather patterns. Hay marketing is also very different to grain, requiring new relationships and patience.
Method
Through analysis of the Australian Bureau of Statistics (ABS) and conversations with contractors and hay growers, the hay supply and demand for the 2018 season has been undertaken and some conclusions drawn.
Results and discussion
Prices
2018 saw hay prices reach record levels due to the extended drought down the east coast of Australia. Although the current prices have eased by approximately $40/t, prices are well supported.
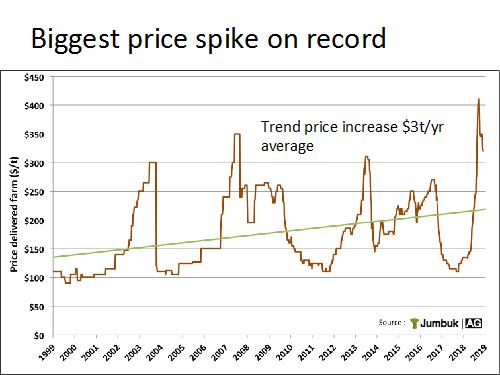
Figure 1. Price for hay delivered on-farm ($/t) from 1999 to 2019.
Supply
The 2018 hay and silage season saw a surprisingly large volume of hay baled. Around 15% of the area sown to wheat and barley in Victoria was cut for hay, albeit at low yields. The other key issue for supply was the impact of the mid December rain on the pastures in Gippsland and Western Districts. These areas enjoyed extended grazing on green pastures and subsequent generous volumes of hay and silage (Figure 2).
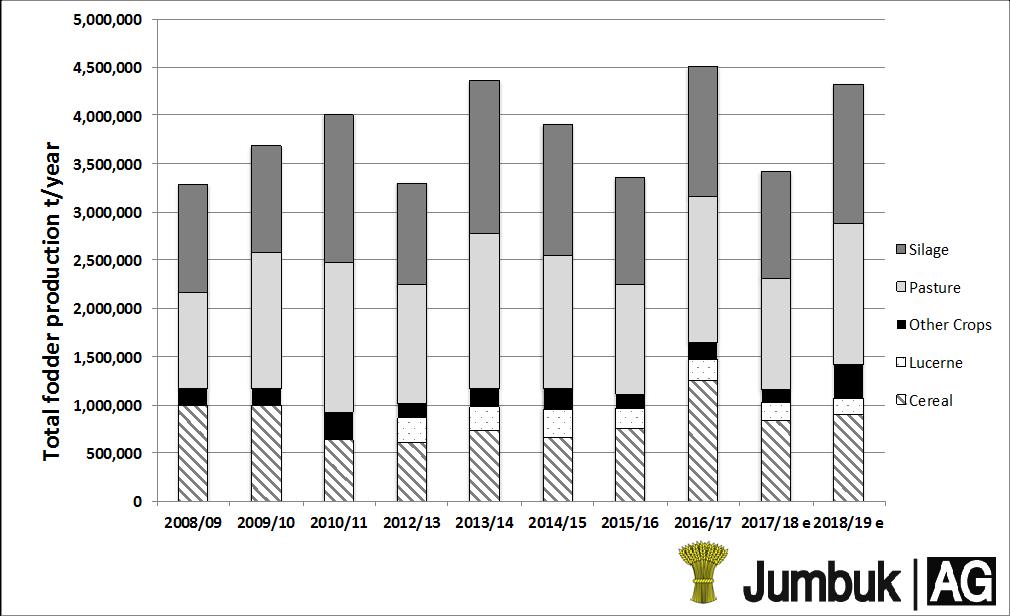
Figure 2. Historical hay production in Victoria (ABS) and estimates for 2018/19 (Jumbuk Ag).
Demand
The 2018 demand for hay ramped up in April last year with graziers from NSW and Qld buying up carryover hay. This demand continues this year and the extended road train network in Victoria is helping the huge northern-bound freight task.
The eight export plants in the Victorian region have been actively competing with the local market and export volumes have been maintained. Chinese demand continues to remain strong (Figure 3).
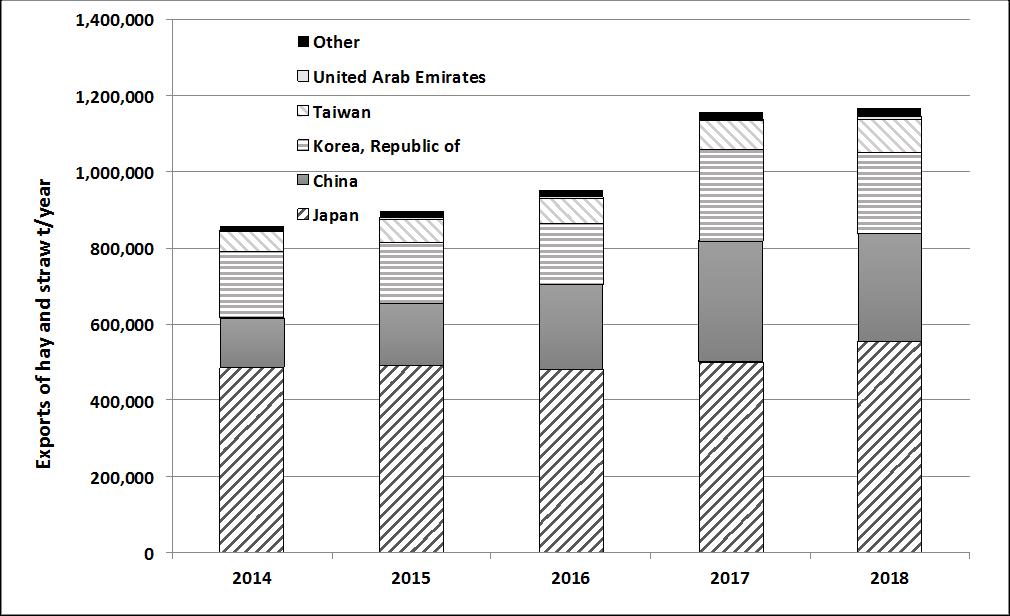
Figure 3. Historical exports of Australian hay and straw (Source: ABS).
Quality
As often happens with droughted cereal hay, the quality of hay has been well above average.
Table 1. Comparative quality of hay samples analysed in the first three months of the season.
Hay type | Year | No. of Samples | Crude Protein (%) | Energy ME (MJ/kg DM) | NDF (%) | |
|---|---|---|---|---|---|---|
Canola | 2006 | 579 | Avg | 15.9 | 9.8 | 41.3 |
4.0-27.2 | 4.1-13.1 | 25.4-77.8 | ||||
Canola | 2018 | 579 | Avg | 14.7 | 9.5 | 42.5 |
3.7-26 | 3.5-12.8 | 27-66.4 | ||||
Wheaten | 2016 | 160 | Avg | 6.8 | 8.1 | 59.0 |
Wheaten | 2018 | 611 | Avg | 10.4 | 10.0 | 50.8 |
(Source: FeedTest Werribee)
Although the canola crops, first cut in early to mid-flower, were testing at 17 to 19% protein, the average for the season has been similar to that during the drought of 2006. As volumes of hay are generous and quality of hay highly variable (particularly for canola hay) buyers are selecting hay on test results.
Monitoring hay stacks for the smell of tobacco, the appearance of slumping bales and by using hot meal probes (i.e. hay moisture meters) is proving valuable to avoid spontaneous combustion. Hay additives are also proving popular to help reduce the oxygen in baled hay, avoid quality losses of heated bales and minimise the chances of fire.
Marketing
Summer demand for protein hay has been increasing, particularly as vetch hay supply is greatly reduced this year and most irrigators are no longer watering their lucerne stands. The cost of grain, hay and water is crippling the dairy industry and cows are being culled from the Murray and Goulburn Valleys and moved to southern Victoria. Buyers are assessing hay with even more scrutiny than previous years.
Access to export markets and shed storage will be essential for those growers who intend to maintain cereal hay in the rotations. Current indications are that a guaranteed minimum price for top grade export oaten hay for the 2019/20 season will be around $250 a tonne delivered to local hay processor plus storage and freight allowances if appropriate.
Following the opening of the new hay processor at Ultima, two new hay plants are expected to be commissioned this year at Raywood and St Arnaud.
Table 2. Example of quality implications of two lots of canola hay competing for a market.
Location | Top price | Bottom price |
|---|---|---|
Storage | Shedded | Paddock stacked |
Ex farm price $/t | $330 | $230 |
Bale weight kg | 640 | 580 |
Protein CP (%) | 20% | 12% |
Energy Mj ME/kg DM | 12 | 6 |
Dry matter content | 90% | 85% |
B Double payload t | 26.24 | 23.78 |
Freight paid $/t | $50.59 | $55.82 |
Price del GV Vic | $381 | $286 |
Protein cost $/CP% | $2.11 | $2.80 |
Protein comparison | 100% | 133% |
Energy cost cents/MJ | $0.035 | $0.056 |
Energy comparison | 100% | 159% |
Table 3. Typical gross margins for broadacre crops in 2019/20 harvest period
Yield | Price 19/20 | Delivery point | Breakeven price | Gross Margin | BE: Forecast Price | |
|---|---|---|---|---|---|---|
Wheat APW | 2.46 | $335 | Geelong port | $154.82 | $443.56 | 46% |
Barley Feed | 2.41 | $280 | Geelong port | $147.12 | $320.42 | 53% |
Barley Malt | 2.41 | $300 | Melbourne | $166.25 | $322.52 | 55% |
Canola | 1.64 | $550 | Geelong port | $288.48 | $428.23 | 52% |
Oats milling | 2.23 | $337 | Melbourne | $135.55 | $449.90 | 40% |
Chickpea desi | 1.34 | $630 | Melbourne | $293.10 | $451.66 | 47% |
Field pea | 1.35 | $380 | Melbourne | $215.29 | $222.20 | 57% |
Lentil nugget | 1.31 | $520 | Melbourne | $235.73 | $371.70 | 45% |
Faba beans | 1.4 | $350 | Melbourne | $232.70 | $164.21 | 66% |
Oaten Hay | 5.2 | $250 | Plant | $112.03 | $717.43 | 45% |
Conclusions
Factors that could maintain the current high hay prices:
- Very low carry in hay stocks.
- NSW/Qld demand started earlier this year.
- Still need a break next autumn.
- Mallee vetch all but gone.
- New road train routes encourage buyers.
- Irrigators pulling out of lucerne
Factors that could pull prices down include:
- Dairy herd culled.
- Big hay and silage season in the south.
- Price encourages straw production.
- More cereal crops cut this year.
- NSW demand unlikely to be as large.
Useful resources
Farm Gross Margin and Enterprise Planning Guide
Contact details
Colin Peace
PO Box 2252, Hawthorn
0413 835793
colin@jumbukag.com.au
@pcsjumbuk
Was this page helpful?
YOUR FEEDBACK