Hyper yielding cereals – are extra inputs needed and if so, do they pay?
Author: Darcy Warren, Nick Poole, Tracey Wylie, Michael Straight, Kat Fuhrmann (FAR Australia) and Jon Midwood and Ian Herbert (Southern Farming Systems (SFS)) | Date: 01 Mar 2019
Take home messages
- Research results from the GRDC Hyper Yielding Cereals (HYC) project have set new benchmarks for the yield performance of irrigated feed wheat with plot yields in excess of 15t/ha in 2016 and in excess of 12t/ha in 2017 and 2018.
- Higher final harvest dry matter content is essential for higher grain yields. Crop canopies producing 30t-35t/ha dry matter at harvest have produced yields of 15t-17t/ha in research plots, using feed grain germplasm not bred for the Australian high rainfall zone (HRZ).
- High yields clearly have the capacity to support higher crop input costs, but in terms of nitrogen (N) nutrition, it has been difficult to make the case for fertiliser inputs that match the off-takes.
- In contrast, for a long season environment such as Tasmania, where the season length can be extended by the use of supplementary irrigation, disease is a major constraint to production and additional costs associated with disease management have been easier to justify.
- In the HYC project, which has focused on the earlier sowing window (April), fungicide input has been shown to be highly cost effective.
- Many of the other crop agrichemical inputs (plant growth regulators (PGRs), herbicides and insecticides) to create a 13t/ha crop of wheat are no greater than those required for a 6t/ha crop.
- As with any farming system, it is the choice of cultivar that protects against the need and therefore the extra cost of additional inputs such as PGRs.
- On the mainland in the long season HRZ regions, input strategies can be based on the principles used in HYC research, but it is important to be more tactical in the deployment of the strategy.
Background
Despite a more suitable climate for grain production than mainland Australia and much higher yield potential, in Tasmania the average yield of red grain feed wheat is still about 5t/ha. Whilst this has increased relatively more than in other states in the past 20 years (source Australian Bureau of Agricultural and Resource Economics (ABARES)), it is still thought to be well below the potential. The Hyper Yielding Cereal (HYC) project supported by GRDC and led by FAR Australia, in collaboration with Southern Farming Systems (SFS), aims to make Tasmania less reliant on grain supplied from the mainland through increased productivity of feed grain wheat and barley. Through the collaboration of international, national, local expertise and breeders, the five year project is working to close the gap between actual and potential yields, as well as using links with end users to promote the value of trading quality feed grains.
Research
Over the past three years, the irrigated HYC Centre at Hagley in Tasmania has used more than 1000 experimental research plots each year to identify new cereal lines and agronomy strategies that could lift feed grain productivity in the Tasmanian HRZ. The concept of the research has been to explore whether the April sowing window can be used to maximise biomass and yield potential without giving rise to large increases to input costs.
In 2016, the first year research results from the HYC project set new benchmarks for the yield performance of feed wheat with plot yields in excess of 15t/ha. The soft finish and high rainfall experienced were in stark contrast to 2017 when low rainfall, higher temperatures and late frosts affected the grain fill period and reduced maximum yields to 12t-13t/ha. In many ways, the contrast of the 2016 and 2017 seasons has been useful in determining which new cultivars/lines perform well in both seasons. In 2018/2019, wheat yields have been in excess of 12t/ha, again experiencing a drier season. However, barley was producing yields in excess of 10t/ha for the third year in succession.
High harvest dry matter essential for higher grain yields
In order to generate higher yielding cereals, it has been essential to generate high harvest dry matter. This has been clearly observed in HYC research with some of the more promising cultivars producing the higher dry matter contents. The final harvest dry matter in 2016 HYC research for the highest yielding cultivars/lines was approx. 30t-35t/ha and showed significantly higher grain yields than the control cultivars, Manning, SQP Revenue and Beaufort (Figure 1). In addition to higher dry matter, the same cultivars had better standing power and exhibited better control of Septoria tritici blotch (STB) and leaf rust.
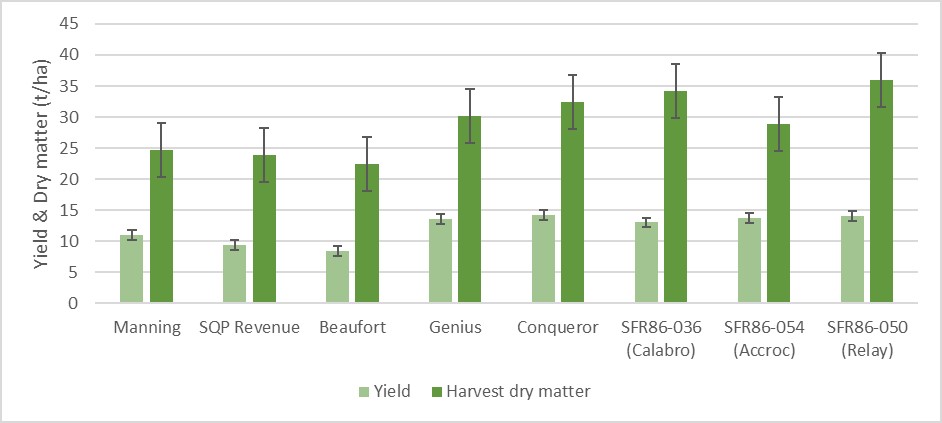
Figure 1. Influence of cultivar/line on grain yield and dry matter (t/ha) at harvest versus commercial controls sown 6 April – HYC research 2016/2017 season.
But are these hyper yields dependent on extra crop inputs?
FAR Australia runs and co-ordinates an array of linked specialist research centres in the south east of Australia that allow us to look at the different outputs from germplasm that have been successful in the HYC project (Table 1).
Table 1. Grain yield (t/ha), Gross output ($/ha), Gross margin ($/ha) and cost per tonne of production achieved by RGT Accroc feed wheat at FAR Australia research centres in 2018.
Yield | Gross output | Gross margin (variable costs) | Cost per tonne* | |
|---|---|---|---|---|
Research Centre | t/ha | $/ha @ $312/t | $/ha | $/t |
HYC Research Centre | 12.49 | 3896 | 3043 (819) | 65.6 |
(Hagley, TAS - HRZ) – GSR* 494 + 60mm irrigation | ||||
SA Crop Technology Centre | 10.52 | 3282 | 2794 (488) | 46.4 |
(Millicent, SA - HRZ) – GSR 650mm | ||||
Disease Management Centre | 8.26 | 2577 | 2141 (436) | 52.8 |
(Gnarwarre, VIC – HRZ) – GSR 290mm | ||||
Riverine Research Centre | 0.6 | 187 | -181 (368) | 613.3 |
(Yarrawonga, VIC – MRZ) – GSR 166mm | ||||
Assumed price for feed wheat in all regions - $312/t; HRZ – High rainfall zone; *Cost per tonne based only on variable costs divided by the yield (t/ha) achieved (fixed costs not taken into account).
Clearly, higher yielding crops will support higher input costs, for example, the value of a 10% yield increase at 5t/ha and $312/t in the medium rainfall zone (MRZ) gives a gross output of $156/ha, whilst the increase in the HRZ at 10t/ha would be worth $312/ha — in other words smaller % increments on high yielding crops support the case for higher inputs, but do they pay? In the above case, the largest component of the extra variable costs in Tasmania revolves around higher N fertiliser input and irrigation water, however, results to date would suggest that large amounts of applied N fertiliser are unnecessary to grow high yielding crops. HYC research looked at the nutrition requirements required to generate high yields. It would be presumed that more yield requires more N fertiliser to support those yields. In HYC research in 2017, RGT Relay feed wheat generated yields of up to 13t/ha (Table 2). The assumptions were that since the site did not show excessive soil N reserves from soil test results, it would respond to very high levels of N fertiliser input. However, ironically in the HYC trials to date, high yields have not been produced by N inputs larger than 150kg–225kg N/ha, despite the off-takes in the crop exceeding this total.
N.B. Although not previously researched in the HYC project, it is essential to make sure that phosphorous (P) and potassium (K) are properly budgeted for in terms of crop off-takes.
Table 2. Grain yield (t/ha), % site mean, % grain protein, test weight (kg/HL) and % screenings – RGT Relay, HYC 2017.
Fertiliser product, rate (kg/N) & timing | Yield | Mean | Protein | Test wt. | Screen | |||||||||
|---|---|---|---|---|---|---|---|---|---|---|---|---|---|---|
TRT | GS00 | GS22 | GS30 | GS32 | GS39 | (t/ha) | (%) | (%) | (kg/HL) | (%) | ||||
1 | MAP | ---- | ---- | ---- | ---- | 11.66 | c | 92.6 | 8.7 | f | 72.8 | a | 2.3 | abc |
2 | MAP | ---- | 80 | 80 | ---- | 12.48 | ab | 99.1 | 11.5 | ab | 71.1 | ab | 2.5 | ab |
3 | MAP | ---- | 100 | 100 | ---- | 12.13 | bc | 96.3 | 11.4 | abc | 70.8 | ab | 2.3 | abc |
4 | MAP | ---- | ---- | 80 | 80 | 12.52 | ab | 99.4 | 10.4 | de | 70.5 | ab | 2.1 | abc |
5 | MAP | ---- | 40 | 40 | 40 | 12.72 | ab | 101.0 | 10.8 | a-e | 72.4 | a | 1.8 | c |
6 | MAP | ---- | 40 | 60 | 60 | 12.75 | ab | 101.2 | 10.5 | cde | 72.1 | a | 2.3 | abc |
7 | MAP | ---- | 40 | 80 | 80 | 12.95 | a | 102.8 | 10.8 | a-e | 72 | a | 2.6 | a |
8 | MAP | ---- | 40 | 100 | 100 | 12.90 | a | 102.4 | 10.9 | a-e | 67.1 | b | 2.2 | abc |
9 | MAP | ---- | 40 | 120 | 120 | 12.15 | bc | 96.5 | 11.6 | a | 70.9 | ab | 2.1 | abc |
10 | MAP | ---- | 40+ 20S | 80 | 80 | 12.90 | a | 102.4 | 10.7 | b-e | 70.3 | ab | 2.3 | abc |
11 | MAP | ---- | 40 | 120 | 74 | 13.07 | a | 103.8 | 11.2 | a-d | 71.7 | a | 1.9 | bc |
12 | MAP | ---- | 40 | 40 | ---- | 12.69 | ab | 100.7 | 10.1 | e | 70.2 | ab | 2.5 | ab |
13 | MAP | 80 | ---- | 100 | ---- | 12.86 | a | 102.1 | 11 | a-d | 72.8 | a | 2.2 | abc |
Mean | 12.60 | 100 | 10.7 | 71.1 | 2.2 | |||||||||
LSD 0.05 | 0.71 | 0.88 | ||||||||||||
P Val | 0.010 | <0.001 | 0.405 | 0.471 | ||||||||||
Note: When MAP was applied, it went out at a rate of 100kg/ha.
High fertility essential for higher yields
In HYC research, high yields have been strongly linked to higher fertility, where the extra N required to realise higher potential is provided by the soil and not by additional fertiliser. Therefore, yields of 13t/ha have not been produced by N fertiliser inputs of 300kg-400kg N/ha. High yields are produced on soils that would produce high yields without any N fertiliser applied. When N is applied, yields increase, but the evidence so far is that hyper yielding crops require far less artificial N to grow than would be expected. Whilst high yields will support higher N fertilisers costs, there is little evidence to support applying N fertiliser to match the potential off-takes e.g. to grow 13t/ha requires 325kg N/ha (based on 25kg N/t). Optimums have instead been achieved with no more than 200kg-225kg N/ha, sometimes less, and good soil fertility provided the extra N required for off-take. Large amounts of artificial N fertiliser and the accompanying extra costs are not required to grow high yielding crops.
In the UK, recent analysis of independent National Institute of Agricultural Botany Arable Group (NIAB TAG) trials shows similar findings to the HYC research during the past two years. Results from a large series of wheat trials indicated that high yield potential usually comes from higher soil fertility, where the extra N required to realise that potential is provided by the soil, such that the total applied N need not be significantly higher than for crops with lower yield potential. The analysis of trials on wheat from the UK put forward “that for every tonne of nitrogen fertilised grain/ha, two thirds of a tonne comes from the yield without nitrogen”. This was put forward to explain “why the additional amounts of nitrogen required for very high yields in field trials is less than would logically be expected” (NIAB TAG 2018). Clearly, the fertility of farming systems and soil organic matter are typically lower than the UK, however from the Tasmanian results, mixed farming regions in the HRZ will be better placed to provide this fertility for the whole farming system.
So, is there any need to increase agrichemical costs in order to generate higher yields?
In HYC research and recent research on the mainland, higher yields generally justify higher disease management costs in the HRZ. This is logical since higher yields are inextricably linked to greater soil water availability, which is correlated with larger crop canopies, greater crop humidity, and as a result, high disease pressure. In 2018 HYC disease management studies, the return on investment from fungicide application was assessed in the most promising cultivars (Table 3).
Table 3. Margin ($/ha) after fungicide and application costs (fungicide cost based on $95/ha and application cost based on $45/ha) have been deducted from the value of additional yield at $350/t, HYC 2018.
Response to fungicide | Extra income from fungicide | Margin after input cost and application | Return on Investment | |
|---|---|---|---|---|
Cultivar | t/ha | @$350/t | $/ha | $ back for every $1 spent |
RGT Accroc | 2.55 | 893 | 753 | 6.4 |
Annapurna | 1.89 | 662 | 522 | 4.7 |
RGT Calabro | 3.15 | 1103 | 963 | 7.9 |
RGT Relay | 2.80 | 980 | 840 | 7.0 |
| DS Bennett | 4.52 | 1582 | 1442 | 11.3 |
Conqueror | 3.70 | 1295 | 1155 | 9.3 |
Genius | 2.75 | 963 | 823 | 6.9 |
| Kittyhawk | 0.84 | 294 | 154 | 2.1 |
| Manning | 3.62 | 1267 | 1127 | 9.1 |
SFR 86-044 | 0.98 | 343 | 203 | 2.5 |
Mean | 2.68 | 938 | 798 | 6.7 |
All cultivars sown in early April responded positively to fungicide protection, giving yield increases between 0.84t-4.52t/ha (14%-77%) and return on investment from 2:1 through to 11:1, i.e. $11 returned for every dollar spent. Therefore, in HRZ regions with high disease pressure, particularly with the certainty that irrigation provides, it is easier to justify additional fungicides applied at key timings to combat key diseases. However, on the mainland in HRZ regions, it is worth setting out a strategy and then reviewing whether the strategy is still appropriate at key growth stages, since even HRZ regions have dry springs. In Millicent in 2018, RGT Accroc gave a yield response to fungicide of 2.53t/ha (almost identical to HYC research), however at Gnarwarre with 290mm growing season rainfall (GSR), the response to fungicide (based on two good foliar fungicides) was reduced to 0.65t/ha, however the return on investment was still 2.7:1 ($2.70 return for every $ spent). With dryland HRZ regions, it is worth putting in place a disease management strategy for cereals that has three points in the season where the need for each fungicide application can be reviewed. These growth stages are first node GS31, flag leaf emergence GS39 and head emergence GS59. In many mainland Australian HRZ scenarios, the last head wash is usually not required, however the need for the application can be reviewed on the basis of the environmental conditions between each of the growth stages. For example, in 2018 at Gnarwarre, there was less than 15mm of rainfall between the first spray timing growth stage and the second and about the same between the second and the third. This information, combined with information about the disease susceptibility of the cultivar, can be used to refine fungicide input costs to the season. More rainfall between the first, second and third growth stages, combined with cultivar susceptibility to diseases prevalent in your region, gives more confidence in a return from these agrichemicals.
It is important to recognise that the standing power qualities of a cultivar are more important at 12t/ha than they are at 7t/ha. In HYC research, the top cultivars have been tested to see when PGR support is required, but high yields do not automatically mean that PGRs have to be applied if cultivar standing power is good.
In essence, high yields do not require excessive inputs, although disease management is an area where more money should be spent than what may be needed in the MRZ and lower rainfall zone (LRZ) regions. To obtain high yields, it is essential that the cultivar chosen has the right ‘time clock’ (phenology) for development, particularly for earlier sown crops. The right time clock is important so that the key development period of stem elongation coincides with the best environmental conditions to maximise growth, and yield potential. For sowing prior to ANZAC day (25 April), research has shown that winter wheat cultivars provide much safer options for maximising yield and margins than spring wheat. Disease resistance management, particularly to STB and leaf rust in wheat, and scald, net blotch and mildew in barley is essential. Good standing power is essential for achieving yields greater than 8t/ha and prevents the need for PGRs.
Come and view the HYC research at the main Hyper Yielding Cereal Project Field Day in Tasmania on Thursday 14 November, 2019
Acknowledgement
The research undertaken as part of this project is made possible by the significant contributions of growers through both trial cooperation and the support of the GRDC — the authors would like to thank them for their continued support.
FAR Australia gratefully acknowledges the support of GRDC for the Hyper Yielding Cereal Project.
Contact details
Darcy Warren
FAR Australia
23 High St, Inverleigh, Victoria 3221
0455 022 044
darcy.warren@faraustralia.com.au
Nick Poole
FAR Australia
23 High St, Inverleigh, Victoria 3221
0499 888 066
nick.poole@faraustralia.com.au
GRDC Project Code: FAR 00003,
Was this page helpful?
YOUR FEEDBACK