On-the-go protein sensors
Author: Brett Whelan, University of Sydney | Date: 06 Mar 2019
Take home messages
Recording the spatial pattern in grain protein content, yield and moisture during harvest provides information that farmers and advisers can use to fully assess the outcomes of their agronomic programs. This information also provides a unique opportunity to better understand and improve crop nitrogen management and add value to product marketing in a range of circumstances. Australian farmers should explore the use of protein sensors to boost financial and environmental outcomes.
Background
Profits from grain crops are not just derived from yield, the quality of the grain delivered is critical to ensuring maximum profits for some grains. For cereals, the quality is largely determined by the grain protein content. For canola, corn and soybeans, the oil content is important.
Protein and oil content in the grain is determined by:
- grain crop type
- crop variety
- nitrogen in the soil and applied as fertiliser and
- moisture availability during the growing season.
Accurately measuring grain protein or oil content can be used to manage quality of marketed grain and when used in conjunction with yield, is useful in assessing how well crop nitrogen nutrition was managed in the harvested season and for locating areas where management may be altered in the future.
Grain quality monitors can be mounted on a harvester to measure protein and oil content during harvest operations. These sensors use near infrared spectroscopy (NIRS) - the same technology used in grain receival depots. Grain samples are presented to a light source; the light interacts with specific chemical bonds within the grain and is slightly modified because the bonds absorb some of the light energy. The reflected or transmitted light is recorded and when run through a calibration algorithm, this provides a measure of grain protein, moisture and oil content.
Instruments that use near-infrared transmittance (NIT) need to capture a stationary sample, so the measurement readings are obtained every 7–15 seconds (a measurement cycle of 0.14–0.07 Hz). Using near infrared reflectance (NIR), a continuous grain flow can be used, and the measurement taken more frequently.
Using grain protein content in Precision Agriculture (PA)
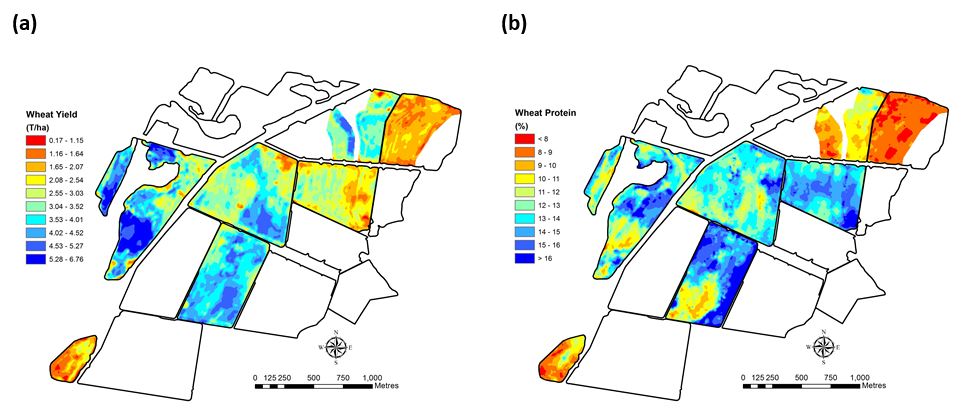
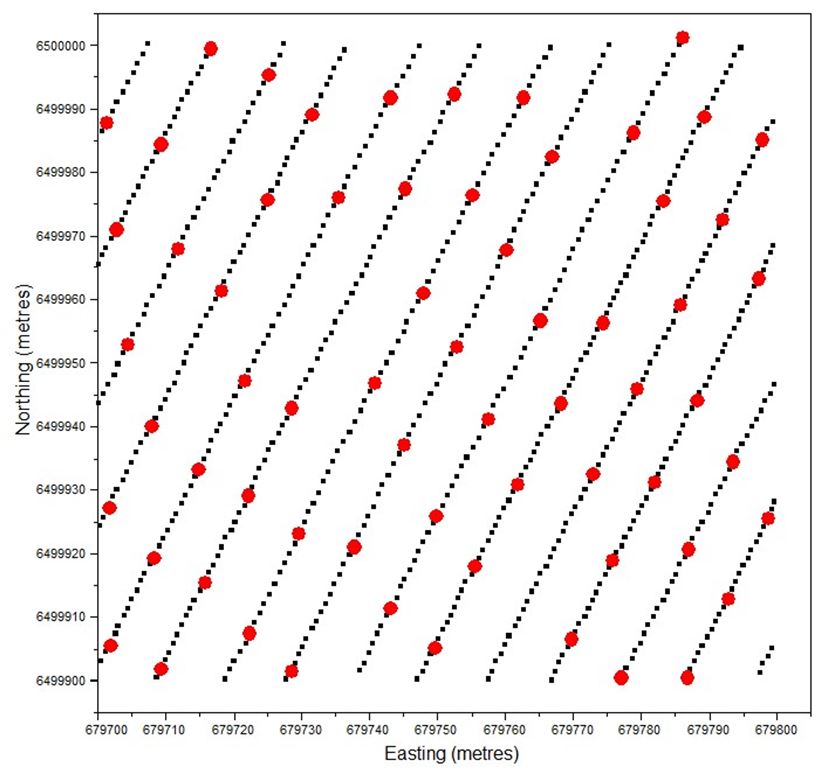
Within-farm and within-field variation in grain protein content, like grain yield, is widespread (Figure 1). The difference in sampling intensity between the yield (measured at 1 Hz) and the protein (measured at 0.08 Hz) produces a difference in observation density (yield ̴725 obs/ha and protein ̴65 obs/ha) as seen in Figure 2. However, the density is more than enough to produce detailed maps as seen in Figure 1b.
Figure 1. Spatial pattern of wheat grain yield (a) and wheat grain protein content (b) across a farm in northern NSW
Post-harvest grain segregation or bulk grain quality control
Monitoring the quality of grain in real-time during harvest provides opportunities to segregate grain based on quality or mix grain based on quality. Several commercial examples from Australia are explained in Clancy (2017).
Identifying areas within a field or farm where grain with specific protein levels can be harvested may provide premium marketing and increased profit opportunities.
Growers who can provide grain at a consistent quality may be in a better position to obtain premium contracts. In highly variable years, the ability to segregate part of the crop based on protein percentage may allow growers to meet contracts when the average quality of the farm output fails to meet the contract specifications (provided that the entire crop is not under contract). In these scenarios a protein sensor opens the possibility of strategic harvesting to target grain quality.
It is important to remember that quality monitoring can be done at any stage of the supply chain and should be performed regularly to assure quality levels and to maximise market segregation opportunities. NIRS quality monitors have been used successfully off-harvester (e.g. on a ground auger) to segregate/manage grain for delivery based on protein content. This does not provide spatial information on protein variability within fields but can be very effective as a differential marketing technique. The malting barley market is one example where this technique of off-harvester segregation is being used in Australia to maintain delivered product within a contracted quality window.
Gross margin maps
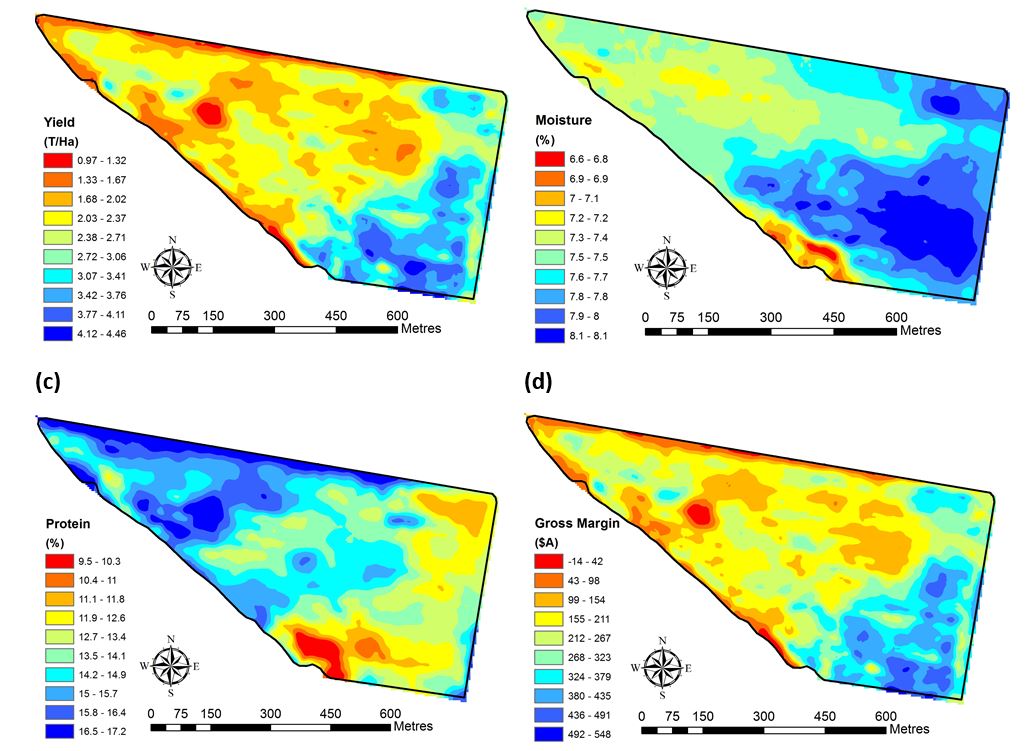
In Australia, grain protein is an important consideration in quality grading and therefore final grain sale price, particularly wheat and barley varieties. Currently for wheat, a small bonus payment is made on a 0.1% sliding scale above the base rate in each receival grade. For malting barley, there is a restricted window of receival standards to make Malting 1 grade (9-12% protein;>70% retention) and all grades must be below 12.5% moisture. Malting 3 grade accepts grain with protein up to 12.8% and retention rates down to 58% but applies a sliding penalty scale based on 0.1% protein increments and 1% retention rate decrements. With yield, moisture and protein maps available it is therefore possible to calculate more accurate revenue figures and produce maps of how the gross margin of production varies within a field and across a farm (Figure 3). These maps should be very useful to a farm manager, particularly for identifying problem areas for investigation, planning more profitable crop agronomy and rotations, or identifying repeatedly unprofitable areas for alternate uses.
Figure 3. Grain yield (a) grain moisture (b) grain protein content (c) and site-specific gross margin (d) maps made by combining all three data layers, applying quality premiums/discounts and subtracting uniform variable costs of production.
Nitrogen agronomy
Conditions that might increase the range of grain protein content found within a field include:
- variation in nitrogen availability within-field. Where different soil type or soil texture occurs, there may be variation in nitrogen supplies to the crop; and
- variation in moisture availability within-field. The interaction between topography, soil type and seasonal climatic conditions will result in spatial variation in the amount of water available to a crop across a field. This impacts on nutrient uptake, grain filling and yield, which all control final grain protein content.
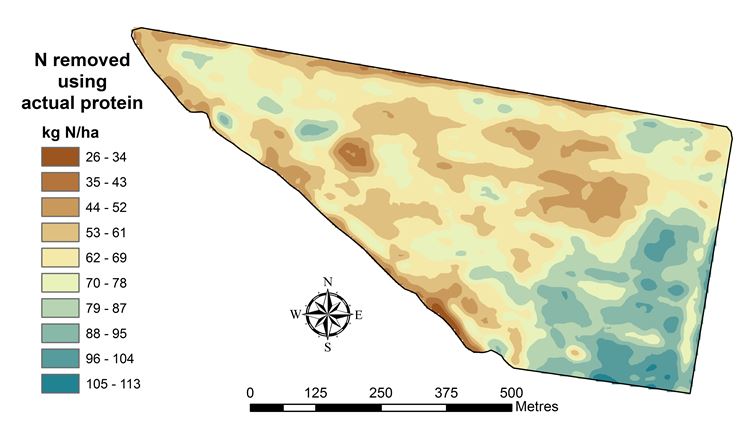
Locations in a field where grain protein content is identified as lower provide an opportunity to direct investigations into nitrogen availability and inform options for management intervention. If investigations suggest that a field has received adequate nitrogen for the growing season, then in the simplest situation, a map of nitrogen removal may become an option to guide variable-rate nitrogen application in the following season. The amount of nitrogen removed from the production system through harvested grain can be calculated by multiplying the mass of grain yield by the percentage of protein in the grain (Figure 4).
It is generally considered that there is a negative correlation between grain yield and grain protein in cereal crop plants. This means that as yield increases, then protein is expected to decrease. A positive correlation would mean that as yield increases, protein would also be seen to increase. The type of relationship (negative, positive or none) can tell managers something about a crops access to nitrogen and water. With measurements of yield and protein across a field using on-harvester monitors, it is possible to explore whether the relationship between the two is constant or does it change across a field (Figure 5). While negative correlations often dominate within a field, areas of positive correlations do occur in most fields as do areas where there is no definable relationship. These changes in the relationship usually form a pattern as seen in Figure 5.
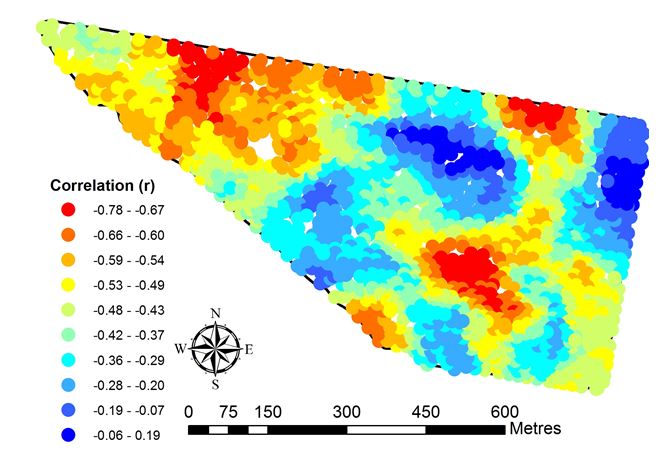
It is speculated here that areas within a field where the yield to protein relationship is negative could mean that access to N by the crop has been relatively uniform but the access to moisture has been variably limited by soil/landscape conditions. Where the relationship is positive, access to available moisture may have been more uniform but the amount of available N was changing. Areas where no relationship is seen (correlations close to 0) could be interpreted as regions where the relationship is changing between positive and negative. Sampling for soil nitrogen and available water holding capacity within these different regions could provide useful information for building better variable-rate N management plans.
Calibration and maintenance of quality sensors
Factory calibrations are supplied with quality sensors, however, a local calibration check is advisable. A number of grain samples can be analysed at the local receival silo and then passed through the harvester sensing system or a set of standard samples purchased for use. It is wise to check calibrations for all crop types and varieties to be harvested. Dust and material other than grain will affect the operation of these sensors and efforts should be made to keep the grain sample as clean as possible.
Conclusions
Protein monitors provide useful information by themselves, both at harvest for optimising marketing options and in further analysis to assess the past season’s agronomic management. Together with grain yield and moisture monitors, benefits can also be found in improved economic analysis of production, targeting strategic investigative sampling and in aiding future N management decisions. Australian farmers are encouraged to explore their use.
Acknowledgements
The research undertaken as part of this project is made possible by the long-term significant contributions of growers through both trial cooperation and the support of the GRDC, the author would like to thank them for their continued support.
References
Clancy, P. (2017) On‐the‐go protein sensors: Using real‐time protein data for more profitable marketing aggregations and nitrogen decisions. In: GRDC 2017 Grains Research Update – Pallamallawa.
Contact details
Brett Whelan
Precision Agriculture Laboratory, Sydney Institute of Agriculture, The University of Sydney
Biomedical Building, Australian Technology Park, Eveleigh NSW 2015
Ph: 02 8627 1132
Email: brett.whelan@sydney.edu.au
GRDC Code: CSP1803
GRDC Project Code: CSP1803,
Was this page helpful?
YOUR FEEDBACK

