A profit first approach to precision agriculture
Author: Kate Burke (Think Agri Pty Ltd) and Patrick Redden and Royce Pitchford (Rural Directions Pty Ltd) | Date: 20 Jun 2019
Take home messages
- Well planned and implemented precision agriculture (PA) helps capture farm profit and conversely, poorly planned and implemented PA can erode farm profit.
- The recipe for profitable PA adoption will be different for each farm business.
- PA information sourced from outside the farm business informs what’s possible, while information from inside the farm business informs what’s most likely to be profitable.
- Using the collective strengths of those inside your farm business and your service providers increases the chances of PA adding to profit.
Why take a profit first approach to precision agriculture?
Precision agriculture tools have long been available to grain growers, yet adoption rates vary among regions and technologies. Adoption of relatively simple applications such as auto steer and auto-section control has occurred by approximately 80% of grain growers across the GRDC Southern Region with higher rainfall areas closer to 70% and medium and low rainfall regions between 80 and 90% (Umbers 2017).
Adoption of other applications has been much slower, even if the applications have clearly demonstrated to provide value. These include variable rate (VR) application of fertiliser or soil ameliorants on different soil types across a paddock, yield monitoring and yield mapping to aid decision making, and selective spot spraying of weeds (Llewellyn and Ouzman 2015).
This slow adoption occurs despite considerable investment by GRDC in the Precision Agriculture Initiative from 2006 to 2010 and continued work by specialist groups such as the Society of Precision Agriculture Australia (SPAA), regional farming systems groups and expert consulting businesses. Dis-adoption has also been reported.
Yet at the same time, grain yield achievement (Ya) relative to water limited potential (Yw) is often below a reasonably expected 80% of Yw with considerable variation between and within regions (Hochman et al 2016). For example, a survey of 52 southern region paddocks in 2015 and 2016 found 62% of paddocks achieved yields below 80% of Yw (Lawes et al 2018).
Profit and return on capital achieved by grain growers is also highly variable with the upper 20% of farm businesses achieving returns far greater than the average return (Figure 1).
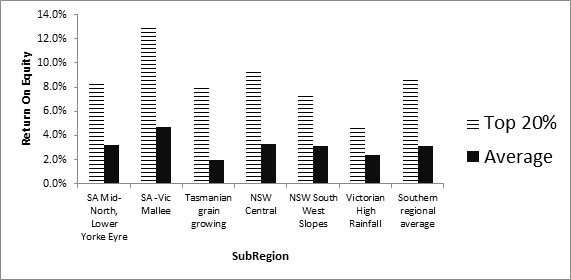
Figure 1. Return on Equity for farm businesses in Southern Australia between 2009 and 2013 (Source: GRDC RDP00013 2016).
The consistent trend of substantial variation in both profit achievement and grain yield among growers in similar environments demonstrates the opportunity for many growers to improve their bottom line and move closer to enduring profits.
It has been proposed that precision agriculture tools are more likely to provide economic value when farm businesses:
- Look inside their business to identify profit opportunities and ensure that profit driver basics are covered.
- Examine if PA tools will help capture identified profit opportunities and if the business is equipped to implement PA.
- Evaluate the potential economic benefit using appropriate methods and consider other benefits that may indirectly contribute to profit.
- Assemble a team of PA support from both inside and outside the farm business to plan and implement the PA application.
Introducing the Profit First approach
The Profit First approach to PA starts with understanding where the profit opportunities lie within one’s own farm business and then considering if PA can help capture that profit opportunity. Table 1 outlines the approach using a series of questions.
Table 1. The Profit First approach.
Stage | What you need to consider | Example Answer |
|---|---|---|
Question 1 | What profit gain opportunities exist for the farm business? | We have low pH soils limiting yield potential in some but not all areas on the farm. |
Question 2 | Does PA have a role in addressing those opportunities? | Soil types are variable within paddocks so VR application of lime could be an option. |
Question 3 | Does the business have the capacity to usefully implement? | The PA profit ready check list is a good place to start. |
Question 4 4.1 How much spatial variability exists? 4.2 Calculating the likely gain 4.3 What are the capital and operating costs? | Do the economics stack up and what else needs consideration? | A partial budget analysis compares using PA or not, (e.g VR lime v Uniform spreading) to address the issue. Lower liming costs will mean more paddocks can be amended in one season. |
Question 5 | How do we make it happen? | Considerations for effective implementation so that the profit gain opportunity is achieved |
Question 1: What profit gain opportunities exist for the farm business?
The first step in a Profit Approach to PA is a critical examination inside the farm business to identify possible profit opportunities.
Guidelines developed from previous GRDC research (GRDC RDP00013 2016) are a useful starting point. Survey work across the GRDC Southern Region revealed that farm businesses with elite financial performance during the 2009 to 2013 period had several traits in common (Figure 2).
These businesses:
1. optimised the farm gross margin and
2. understood and managed their fixed costs and
3. managed financial and seasonal risks proactively and
4. had access to highly capable people inside and outside their business.
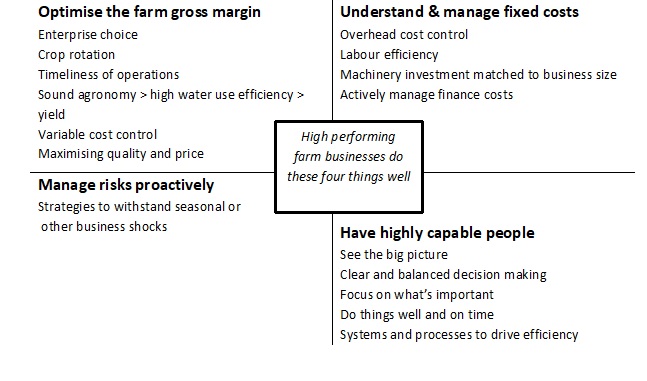
Figure 2. Profit drivers identified for the GRDC Southern Region (Adapted from GRDC RDP00013 2016)
Most variation in financial performance was explainable by grain yield, cost management and efficient use of resources (Table 2). Farm scale and commodity price were poor explainers. Yield was one of the biggest explainers so looking for opportunities to improve yield while managing costs well is one area where PA may have application.
Table 2. What caused variation in farm business performance? (Source: GRDC RDP00013 2016)
Factors that were most important | Factors that didn’t explain differences |
|---|---|
Grain yield | Scale/Farm size |
Fixed and variable cost management | Commodity price |
Efficient use of people, machinery and capital | |
The ability to withstand business shocks | |
Considered and timely decision making | |
Implementation of operations. |
Question 2: Does PA have a role in addressing those opportunities?
The GRDC Southern Region and the southern Riverina of NSW are diverse in landscape soil type, climate and farming systems. The applicability of PA tools varies accordingly but there are three general pathways in which PA tools can contribute to profit (Table 3). These mostly relate to optimising gross margin in the profit driver framework of Figure 2.
Table 3. PA pathways to profit
Pathway | Examples | Profit impact potential |
|---|---|---|
Strategic | ||
Unlocking yield potential by cost effectively managing site specific soil constraints and/or enabling cost effective farming systems changes | Sodicity Salinity Acidity Non-wetting sand Compaction Soil density Waterlogging | Usually where highest gains can be made. Yield potential is unlocked more quickly by using capital more efficiently. |
Tactical | ||
Achieving water limited yield potential in a cost-effective manner while managing production risk | Soil nutrition Matching yield potential to plant available water Crop monitoring Root disease management Fallow management of weeds In crop weed management | Can be high impact individually or incrementally. Relates to optimising gross margin by capturing yield potential cost effectively. |
Flexible/reactive | ||
Optimising quality and price and therefore increasing revenue | Frost Heat stress Harvest management Patchy weed infestations | High impact but less frequently. Relate directly to proactively managing risk and flexible and nimble management. |
To aid thinking about where PA could assist in the business, a series of tables were constructed that broadly classify the most likely potential profit opportunities and PA tools in each rainfall zone. (Tables 4 to 6). These are used to identify what is possible and then it’s necessary to think about the individual farm business supported by economic analysis to determine what actions may be profitable.
Table 4a. Factors impacting on profit in the Low Rainfall Zone.
Low Rainfall Zone | Plant Available Water | Sandy soils | Acid soil | Salinity | Sodicity | Water logging | Compaction | NPKS nutrition | Fallow management | Herbicide resistance | Frost | Heat stress |
|---|---|---|---|---|---|---|---|---|---|---|---|---|
Upper EP | √ | √ | √ | √ | √ | √ | √ | √ | √ | |||
Western EP | √ | √ | √ | √ | √ | √ | √ | √ | ||||
Upper North | √ | √ | √ | √ | √ | √ | √ | √ | √ | √ | √ | |
SAVIC N Mallee | √ | √ | √ | √ | √ | √ | √ | √ | √ | √ | ||
SAVic S Mallee | √ | √ | √ | √ | √ | √ | √ | √ | √ | √ | ||
Vic C Mallee | √ | √ | √ | √ | √ | √ | √ | √ | √ | √ |
Table 4b. The likely contribution of various PA applications to profit in the low rainfall zone (√√√ highly likely; √√ sometimes likely; √ less likely).
Low Rainfall Zone | Strategic | Tactical | Flexible | |||||||||||||
|---|---|---|---|---|---|---|---|---|---|---|---|---|---|---|---|---|
Drainage mapping | Zoned claying/ delving | Zoned ripping/ spading | Zone management through variable rate application of: | Vehicle autosteer | Implement steering (Protrakker) | Compaction management with CTF | Inter-row or on-row sowing | Site specific weed detection and control | Decision support for soil & crop monitoring | Mapping weeds | Protein Mapping | |||||
Lime | Gypsum | Seed | N, P, K, S | |||||||||||||
Upper EP | √ | √√√ | √√√ | √ | √√√ | √√ | √√ | √√√ | √√ | √√ | √√√ | √√√ | √√√ | √√√ | √√ | |
Western EP | √ | √√√ | √√√ | √ | √√√ | √√ | √√ | √√√ | √√ | √√ | √√√ | √√√ | √√√ | √√√ | √√ | |
Upper North | √ | √√ | √√ | √√ | √√√ | √√ | √√ | √√√ | √√ | √√ | √√√ | √√√ | √√√ | √√√ | √√ | |
SAVIC N Mallee | √ | √√√ | √√√ | √ | √√ | √√√ | √√√ | √√√ | √√ | √√ | √√√ | √√√ | √√√ | √√√ | √√ | |
SAVic S Mallee | √ | √√ | √√ | √ | √√√ | √√√ | √√√ | √√√ | √√ | √√ | √√√ | √√√ | √√√ | √√√ | √√ | |
Vic C Mallee | √ | √√ | √√ | √ | √√√ | √√√ | √√√ | √√√ | √√ | √√ | √√√ | √√√ | √√√ | √√√ | √√ | |
Table 5a. Factors impacting on profit in the medium rainfall zone.
Medium Rainfall Zone | Plant Available Water | Sandy soils | Acid soil | Salinity | Sodicity | Water logging | Compaction | NPKS nutrition | Fallow management | Herbicide resistance | Frost | Heat stress |
|---|---|---|---|---|---|---|---|---|---|---|---|---|
Lower EP | √ | √ | √ | √ | √ | √ | √ | √ | √ | √ | √ | |
Central YP | √ | √ | √ | √ | √ | √ | ||||||
Lower YP | √ | √ | √ | √ | √ | √ | √ | |||||
Northern YP - Mid North | √ | √ | √ | √ | √ | √ | √ | √ | √ | √ | √ | |
Wimmera-Bordertown | √ | √ | √ | √ | √ | √ | √ | √ | √ | √ | √ | |
SA Upper South East | √ | √ | √ | √ | √ | √ | √ | √ | √ | √ | √ | |
Central Vic | √ | √ | √ | √ | √ | √ | √ | √ | √ | √ | √ | |
Nth Central Vic | √ | √ | √ | √ | √ | √ | √ | √ | √ | √ |
Table 5b. The likely contribution of various PA applications to profit in the medium rainfall zone (√√√ highly likely; √√sometimes likely; √ less likely).
Medium Rainfall Zone | Strategic | Tactical | Reactive | ||||||||||||
|---|---|---|---|---|---|---|---|---|---|---|---|---|---|---|---|
Drainage mapping | Zoned claying/ delving | Zoned ripping/ spading | Zone management through variable rate application of: | Vehicle autosteer | Implement steering (Protrakker) | Compaction management with CTF | Inter-row or on-row sowing | Site specific weed detection and control | Decision support for soil & crop monitoring | Mapping weeds | Protein Mapping | ||||
Lime | Gypsum | Seed | N, P, K, S | ||||||||||||
Central YP | √ | √ | √ | √√ | √ | √√ | √√ | √√√ | √√ | √√ | √√√ | √√√ | √√√ | √√√ | √√ |
Lower YP | √ | √√ | √ | √ | √ | √√ | √√ | √√√ | √√ | √√ | √√√ | √√√ | √√√ | √√√ | √√ |
Northern YP - Mid North | √ | √√ | √√ | √√√ | √√√ | √√ | √√ | √√√ | √√ | √√ | √√√ | √√√ | √√√ | √√√ | √√ |
Wimmera-Bordertown | √√ | √√ | √√ | √√ | √√√ | √√ | √√ | √√√ | √√ | √√ | √√√ | √√√ | √√√ | √√√ | √√ |
SA Upper South East | √ | √√ | √√ | √√ | √√√ | √√ | √√ | √√√ | √√ | √√ | √√√ | √√√ | √√√ | √√√ | √√ |
Central Vic | √√√ | √ | √√√ | √√√ | √√√ | √√ | √√ | √√√ | √√ | √√ | √√√ | √√√ | √√√ | √√√ | √√ |
Nth Central Vic | √√ | √ | √√√ | √√√ | √√√ | √√ | √√ | √√√ | √√ | √√ | √√√ | √√√ | √√√ | √√√ | √√ |
Table 6a. Factors impacting on profit in the high rainfall zone.
High Rainfall Zone | Plant Available Water | Sandy soils | Acid soil | Salinity | Sodicity | Water logging | Compaction | NPKS nutrition | Fallow management | Herbicide resistance | Frost | Heat stress |
|---|---|---|---|---|---|---|---|---|---|---|---|---|
SA Lower South East + Kangaroo Island | √ | √ | √ | √ | √ | √ | √ | √ | √ | √ | ||
Southern Vic | √ | √ | √ | √ | √ | √ | √ | √ | √ | √ | √ | |
North East Vic slopes | √ | √ | √ | √ | √ | √ | √ | √ | √ | √ | √ | |
Tas Grain | √ | √ | √ | √ | √ | √ | √ | √ | √ |
Table 6b. The likely contribution of various PA applications to profit in the high rainfall zone (√√√ highly likely; √√sometimes likely; √ less likely).
High Rainfall Zone | Strategic | Tactical | Reactive | |||||||||||||
|---|---|---|---|---|---|---|---|---|---|---|---|---|---|---|---|---|
Drainage mapping | Zoned claying/ delving | Zoned ripping/ spading | Zone management through variable rate application of: | Vehicle autosteer | Implement steering (Protrakker) | Compaction management with CTF | Inter-row or on-row sowing | Site specific weed detection and control | Decision support for soil & crop monitoring | Mapping weeds | Protein Mapping | |||||
Lime | Gypsum | Seed | N, P, K, S | |||||||||||||
Southern Vic | √√√ | √ | √√√ | √√√ | √√√ | √√ | √√ | √√√ | √√ | √√ | √√√ | √√√ | √√√ | √√√ | √√ | |
North East Vic slopes | √√√ | √ | √√√ | √√√ | √√√ | √√ | √√ | √√√ | √√ | √√ | √√√ | √√√ | √√√ | √√√ | √√ | |
Tas Grain | √√√ | √ | √√√ | √√√ | √√√ | √√ | √√ | √√√ | √√ | √√ | √√√ | √√√ | √√√ | √√√ | √√ | |
Question 3: Does the business have the capacity to usefully implement PA opportunities?
Table 7 demonstrates a checklist that can be utilised for assessing whether the business has the capapcity to implement the PA opportunities previously identified by the business.
Table 7. Checklist for assessing PA opportunities.
Checklist for assessing PA opportunities | ||
|---|---|---|
1 | Is there room to improve water use efficiency and yield relative to climate limited potential via crop rotation, crop agronomy, and operational timeliness? | If yes, stop the PA path and explore these other Profit pathways first. |
2 | How long has the PA product or application been around? Has it been robustly tested in a commercial environment? | More established PA products tend to be cheaper with greater capability and reliability. |
3 | Does the technology influence long term average crop yield? | Technologies which unlock yield potential and result in yield increases, with only a small to moderate increase in cost can deliver substantial net economic benefit |
4 | Is the PA technology the most cost-effective mechanism to achieve the outcome that I am striving for? | Sometimes there are other ways to achieve the same outcome. Select the simplest and most cost-effective option to achieve a desired outcome wherever possible. |
5 | Have I undertaken a robust economic assessment? Did this analysis demonstrates a positive net benefit? | The range in net economic benefits can be substantial and is often very sensitive to the cost of purchasing the technology and the robustness of the assumptions made. |
6 | Do I understand how the benefit will be influenced by climatic variability between seasons? Do my assumptions accurately reflect the likely benefit or cost saving by taking a long-term perspective which captures the influence of seasonal variability? | Some technologies have very different payoffs under different seasonal conditions. It is important that this difference is understood and captured in an economic analysis. Tools such as CliMate can be used to add rigour to assumptions around seasonality and the way in which it may influence the benefit. |
7 | Do I understand how my available level of scale impacts the commercial result? | A technology which is commercially feasible for one business may not pass the commercial feasibility test for a smaller scale business. |
8 | Have I used long term, decile 5 pricing rather than spot pricing when calculating the net economic benefit or a range of price scenarios? | Spot pricing influences the value of the possible benefit or cost saving and can be misleading if the price used is substantially different from the longer term average. This applies to both input cost prices and grain prices. |
9 | Can I access the skill set and capacity to manage the data capture and interpretation required for this PA application? | Most forms of PA require data capture, analysis, and preparation. The impact on labour demand is an important consideration |
10 | Have I completed the economic assessment on the application of this technology without bias? | Personal bias can influence an economic assessment. A bias free analysis will be more robust. |
Question 4: Do the economics stack up and what else needs consideration?
Determining whether the economics stack up for PA adoption needs to be done at the individual farm level. Relying on examples from other farm businesses to decide whether or not to proceed with a PA project is dangerous if the underlying assumptions aren’t known. The Profit First PA management guideline provides a series of decision-making steps to help work through scenarios on an individual farm basis (Redden et al 2019). Figure 3 describes this process. Tables 8a and 8b illustrate how different the outcome can be for two different businesses.
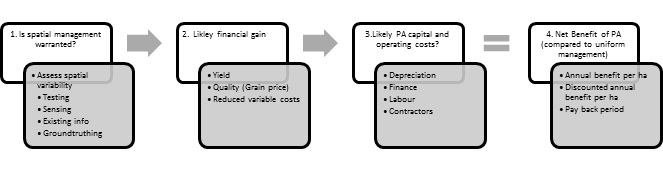
Figure 3. Stepwise process for undertaking economic analysis to establish a net benefit of PA.
Table 8a. The use of selective spot spraying technology for two farms has very different financial outcomes depending on the characteristics of the farm business.
Farm Size | Capital investment | Total annual benefit1 | Annual cost2 | Net annual benefit | Payback period | Annual margin (Net benefit/ Total benefit) | Required Scale (Breakeven Area) |
|---|---|---|---|---|---|---|---|
Ha | Total $ and ($/Ha) | Years | % | Ha | |||
4100 | 70,000 | 118,900 | 15,000 | 103,900 | 0.6 | 87% | 517 |
(17.07) | (29.00) | (3.66) | (25.34) | ||||
6000 | 350,000 | 123,960 | 81,000 | 42,960 | 3 | 35% | 3921 |
(58.33) | (20.66) | (13.50) | (7.16) | ||||
1Savings in chemical, application and or labour costs; 2Depreciation (15% flat rate), Finance, Repairs and Maintenance.
Table 8b. Capital outlay and the resultant annual depreciation costs are the main difference in cost structure.
Farm 1 Second hand | Farm 2 (New purchase with additional capability of blanket spray) | |
|---|---|---|
Hectares | 4100 | 6000 |
Purchase Price | $70,000 | $350,000 |
Annual Depreciation (15%) | $10,500 | $52,500 |
Annual Finance (5%) | $3,500 | $17,500 |
Total Annual Capital Costs | $15,000 | $81000 |
Annual Capital Costs $/ha | $3.66 | $13.50 |
Question 5: How do we make it happen?
Table 9 demonstrates a checklist that can be utilised for implementing Profit First PA.
Table 9. Checklist for Profit First PA implementation.
Checklist for Profit First PA implementation | |
|---|---|
|
|
2. Choose your PA team (and resources) |
|
3. Gathering the data |
|
4. Effective execution | Implementation ultimately comes down to execution. The following execution tips were provided by growers and advisers using PA successfully:
|
5. Evaluation | To evaluate the success of the project consider the following:
|
Conclusion
Considering farm business profit opportunities first, then establishing if PA can help achieve those opportunities should minimise the risk of adopting PA tools that aren’t warranted and increase the likelihood of a positive and profitable PA experience.
Useful resources
Applying PA – A reference guide for the modern practitioner (https://grdc.com.au/resources-and-publications/all-publications/bookshop/2013/11/applyingpa)
Calculating Return On Investment For On Farm Trials DIY Precision Agriculture (https://grdc.com.au/resources-and-publications/all-publications/publications/2016/11/calculating-return-on-investment-for-on-farm-trials)
Technical reference material on the development and application of PA in the grains industry (https://sydney.edu.au/agriculture/pal/publications_references/educational_resources.shtml)
References
GRDC RDP00013 (2016), Project Report for The integration of technical data and profit drivers for more informed decisions, authored by Rural Directions Pty Ltd, Macquarie Franklin, Meridian Agriculture, Agripath, and Corporate Agriculture Australia
Hochman Z, Gobbett D, Horan H, Garcia JN (2016). Data rich yield gap analysis of wheat in Australia. Field Crops Research 197, 97-106.1
Lawes R, Chen C and Van Rees H (2018). The National Paddock Survey — what causes the yield gap across Australian paddocks? GRDC Update Perth WA February 2108
Llewellyn RS and Ouzman J (2015) Adoption of precision agriculture related practices: status, opportunities and the role of farm advisers CSIRO www.csiro.au
Umbers A (2017) GRDC Farm Practices Survey Report 2016. Grains Research and Development Corporation, Canberra
Redden, P, Pitchford, R, Burke K 2018 Profit from Precision Agriculture: A summary of the current information on the economic value of Precision Agriculture tools in the GRDC Southern Region. Grains Research and Development Corporation Project 9176123
Redden, P, Pitchford, R, Burke K 2019 Profit from Precision Agriculture: A profit first approach to PA. A step by step decision making guide for growers and advisers
Grains Research and Development Corporation Project 9176123
Acknowledgements
The research undertaken as part of this project is made possible by the significant contributions of growers through both case study cooperation and the support of the GRDC, the authors would like to thank them for their continued support. We thank the numerous growers that generously shared their experience, results and insight. We also thank the Project Steering Committee team of Sam Trengove, Jess Koch, Andrew Whitlock, Brendan Williams, Daniel Harris, Rick Llewellyn and Randall Wilksch who provided valuable expertise and guidance.
Contact details
Kate Burke
Think Agri Pty Ltd
Echuca, Vic
0418 188565
thinkagri@icloud.com
@Think_Agri
GRDC Project Code: 9176123,
Was this page helpful?
YOUR FEEDBACK