Rotations in integrated farming systems
Author: Amanda Pearce (South Australian and Research Development Institute) | Date: 21 Aug 2019
Take home messages
- A 26% increase in wheat yield was observed following balansa clover, compared to a wheat on wheat rotation.
- Pasture legume phases can provide residual soil N levels comparable to that of pulse crops.
- The use of double breaks to increase soil N for subsequent crops needs further investigation.
Background
As part of the GRDC-SARDI Strategic Research Agreement a project titled ‘Integrated Farming Systems in the Medium Rainfall Zone’ commenced in 2017, with a research focus in the Upper South East (USE) to provide information on the whole of farming systems impacts of diverse crop rotations, particularly the incorporation of a pasture phase. This will allow for more profitable crop sequencing decision making, with the aim of increasing farm sustainability, diversity and ultimately profitability, through the adoption of improved rotations and break crop management options.
A literature review and research gap analysis report into the use of break crops and pastures in integrated farming systems in the MRZ was completed in April 2017, identifying key issues that limit their adoption and potential opportunities to expand their use. Informed by the findings, the project has three field research components: rotational trials, targeted agronomy trials and focus paddocks and presented findings focus on data generated from rotational trials established in 2017.
The rotational trials were designed to evaluate the following:
- What is the magnitude of impact of an annual pasture legume in the integrated farming system rotation in the MRZ of the USE on subsequent crops?
- Is the break effect of an annual pasture legume phase (environmental, agronomic, economic and risk) comparable to that of pulse and canola break crops?
- Do double breaks increase subsequent wheat yields compared to single breaks?
- Does the break effect impact on the second wheat crop and beyond?
This paper will discuss data collected in 2017 and 2018, focusing on soil nitrogen (N), annual ryegrass (ARG) populations and grain yields. It must be noted that the data presented is only a snapshot and further analysis and interpretation will be required as data from additional trial work becomes available. Data being collected and analysed for the trials, but not discussed in this paper, include water use efficiency of crops (moisture probes are installed in different sequences), soil borne diseases, grazing and hay value of crops, pasture biomass production, grain quality and the economics of break crops and rotations. A sensitivity analysis will be undertaken, allowing for variation in crop commodity prices, grain quality and grade classification, to prevent any bias towards a particular crop and/or rotation.
Method
In 2017 two rotational trials were established in the USE of SA, one at Sherwood and the other at Bordertown. Both sites were sown into wheat stubble.
A total of eighteen sequences are being evaluated over a four-year rotation (Year 1 2017, Year 2 2018, Year 3 2019 and Year 4 2020) (Table 1). Crops included in the sequences are wheat, barley, oat, canola, faba bean, lentil (Bordertown), lupin (Sherwood), balansa clover, subterranean clover (sub clover) and burr medic. A grower selected rotation is compared to continuous wheat and pasture phases, and single breaks of canola, oat, barley, lentil/lupin and pastures. In addition, double breaks of pastures are included and a sequence which does not include wheat.
Table 1. The eighteen sequences being evaluated over the four-year rotation.
Year 1 | Year 2 | Year 3 | Year 4 | Rotation |
|---|---|---|---|---|
Wheat | Wheat | Wheat | Wheat | Continuous wheat |
Balansa clover | Balansa clover | Balansa clover | Balansa clover | Continuous pasture |
Burr medic | Burr medic | Burr medic | Burr medic | Continuous pasture |
Sub clover | Sub clover | Sub clover | Sub clover | Continuous pasture |
Wheat | Canola | Oat | Faba bean | Grower |
Canola | Wheat | Wheat | Wheat | Single break |
Oat | Wheat | Wheat | Wheat | Single break |
Barley | Wheat | Wheat | Wheat | Single break |
Faba Bean | Wheat | Wheat | Wheat | Single break |
Lentil/Lupin | Wheat | Wheat | Wheat | Single break |
Balansa clover | Wheat | Wheat | Wheat | Single break |
Burr medic | Wheat | Wheat | Wheat | Single break |
Sub clover | Wheat | Wheat | Wheat | Single break |
Balansa clover | Balansa clover | Wheat | Wheat | Double break |
Burr medic | Burr medic | Wheat | Wheat | Double break |
Sub clover | Sub clover | Wheat | Wheat | Double break |
Canola | Sub clover | Wheat | Wheat | Double break |
Barley | Lentil/Lupin | Canola | Sub clover | No wheat |
The trial design includes two replicates at each site of all phases of a sequence, allowing year to year variability to be accounted for in the analysis. Sequences have been sown as 6m X 10m blocks. As a phased rotation trial, not all data can be presented until the end of the trial when all sequences have been completed.
Management of the trials follows region best practice for each crop type, with an aim to maximise production and minimise weeds, pests and diseases. Seeding has generally occurred in mid-May. Nitrogen management has been based on soil N tests and is specific for each crop type and rotation phase.
Soil nitrogen (N kg/ha (0 - 60cm)) was measured at the site: pre-seeding in May 2017, all blocks at post-harvest in 2017 (January 2018) and all plots at post-harvest in 2018 (January 2019).
Establishment of ARG was counted (6 counts of a 30cm X 30cm quad) in late June in 2017 and 2018.
Crop types, except pastures, were harvested by a plot header.
Results and discussion
Soil nitrogen
At Bordertown initial soil N pre-seeding (May 2017) was 74N kg/ha and at Sherwood 72N kg/ha.
Post-harvest of 2017 crops, soil N kg/ha differed for crop types at each of the Bordertown and Sherwood sites (Table 2). At Bordertown, lentil had significantly higher post-harvest soil N (kg/ha) than the cereals, canola, burr medic and balansa clover, but not significantly higher soil N (kg/ha) than faba bean and sub clover. At Sherwood, balansa clover had significantly higher post-harvest soil N (kg/ha) than the cereals, canola and sub clover, but not significantly higher soil N (kg/ha) than faba bean and lupin. Burr medic had lower levels of soil N kg/ha post-harvest than the other pastures at Sherwood.
Table 2. Soil N kg/ha (0 – 60cm) post-harvest of 2017 crops, at Bordertown and Sherwood.
2017 Crop | Bordertown | Sherwood |
|---|---|---|
Balansa clover | 50 | 50 |
Barley | 42 | 30 |
Canola | 21 | 31 |
Faba bean | 64 | 41 |
Lentil | 88 | ~ |
Lupin | ~ | 44 |
Burr medic | 45 | 16 |
Oat | 40 | 17 |
Sub clover | 65 | 34 |
Wheat | 47 | 24 |
Site Mean | 51 | 32 |
P value | 0.006 | < 0.001 |
Lsd | 30 | 13 |
~ not sown
Analysis evaluating the interaction of the 2017 crop on residual soil N post-harvest of the 2018 crop is currently being completed.
The influence of the 2017 crop on residual N post-harvest of the 2018 crop needs further investigation and more data will become available pending statistical analysis. Additional soil sampling was completed in July 2019 because low rainfall, post-harvest, over the 2018-2019 summer may have limited mineralisation when the initial soil sampling occurred, and therefore, the full potential of residual N may not have been realised. Importantly, soil N post-harvest of 2019 crops will provide information on the value of double breaks (no wheat sown in 2017 and 2018).
As in 2017, soil N kg/ha differed for each of the crop types at Bordertown compared to Sherwood post 2018 harvest (Table 3). At Bordertown the 2018 crops; balansa clover, lentil and faba bean had significantly higher post-harvest soil N compared to that of cereals and canola. At Sherwood, sub clover had greater residual soil N kg/ha than all other crop types.
Table 3. Soil N kg/ha (0 – 60cm) post-harvest of 2018 crops, at Bordertown and Sherwood.
2018 Crop | Bordertown | Sherwood |
|---|---|---|
Balansa clover | 68 | 41 |
Barley | 25 | 23 |
Canola | 31 | 36 |
Faba bean | 65 | 39 |
Lentil | 54 | ~ |
Lupin | ~ | 42 |
Burr medic | 46 | 42 |
Oat | 26 | 26 |
Sub clover | 51 | 55 |
Wheat | 33 | 35 |
Site Mean | 46 | 38 |
P value | < 0.001 | < 0.001 |
Lsd | 19 | 11 |
~ not sown
Annual ryegrass (ARG) populations
In 2017, ARG populations were lower at Bordertown (site average 3 plants/m2) compared to Sherwood (site average 56 plants/m2), with populations generally greater in cereal plots compared to the other crop types.
Grain yields
Mean grain yields for 2017 harvested crop types are presented in Table 4. The oats at Sherwood were cut for hay in 2017 to manage the ARG population, as per standard grower practice.
Table 4. Grain yield average (t/ha) per crop type at Bordertown and Sherwood, 2017.
2017 Crop Type | Bordertown | Sherwood |
|---|---|---|
Wheat | 3.84 | 2.90 |
Barley | 4.61 | 2.65 |
Oat | 4.33 | - |
Lupin | ~ | 3.11 |
Lentil | 1.89 | ~ |
Faba bean | 4.18 | 3.81 |
Canola | 1.92 | 0.91 |
~ not sown, - oats cut for hay due to high ARG pressure (as per grower practice), no harvest
Crop yields (2018) from all sequences are currently being analysed. Mean harvest data for crop types (excluding wheat, which are presented in Table 5 and Figure 1), harvested in 2018 are presented in Table 6.
Table 5. Mean harvest data (grain t/ha) for 2018 crops (excluding wheat), showing previous crop at Bordertown and Sherwood.
Bordertown | Sherwood | ||
|---|---|---|---|
2017 Crop | 2018 Crop | t/ha | t/ha |
Wheat | Barley | 5.37 | 4.00 |
Sub clover | Barley | 5.39 | 4.66 |
Lupin | Canola | ~ | 1.12 |
Lentil | Canola | 2.50 | ~ |
Wheat | Canola | 2.32 | 1.32 |
Oat | Faba bean | 2.75 | 1.49 |
Wheat | Faba bean | 1.95 | 1.77 |
Barley | Lupin | ~ | 1.50 |
Wheat | Lupin | ~ | 1.63 |
Barley | Lentil | 1.90 | ~ |
Wheat | Lentil | 1.33 | ~ |
Canola | Oat | 3.75 | 2.16 |
Wheat | Oat | 2.34 | 2.41 |
~ not sown
The interaction of the 2017 crop on 2018 wheat yields has been analysed separately, providing an insight into the impact of a single break crop. At Bordertown wheat yields averaged 5.35t/ha, and there were no significant differences following a legume break crop compared to following a cereal break (Table 6).
Table 6. Bordertown 2018 wheat grain yields (t/ha), following different crop types sown in 2017.
2017 Crop | 2018 Crop | 2018 Wheat Yield t/ha |
|---|---|---|
Wheat | Wheat | 5.15 |
Barley | Wheat | 5.89 |
Oats | Wheat | 5.19 |
Canola | Wheat | 4.90 |
Lentil | Wheat | 5.80 |
Faba bean | Wheat | 5.23 |
Burr medic | Wheat | 5.20 |
Sub clover | Wheat | 5.42 |
Balansa clover | Wheat | 5.39 |
Site Mean | 5.35 | |
P value | 0.831 (NS) |
NS – not significant
At Sherwood, the lower grain yielding site (average wheat yield 3.69t/ha), subsequent wheat yields were responsive to legume break crops (Figure 1). Sherwood wheat yields in 2018 were greater following balansa clover and subterranean clover, compared to the break crop canola and cereal options. There was up to a 26% increase in wheat yields following balansa clover, compared to a wheat on wheat rotation.
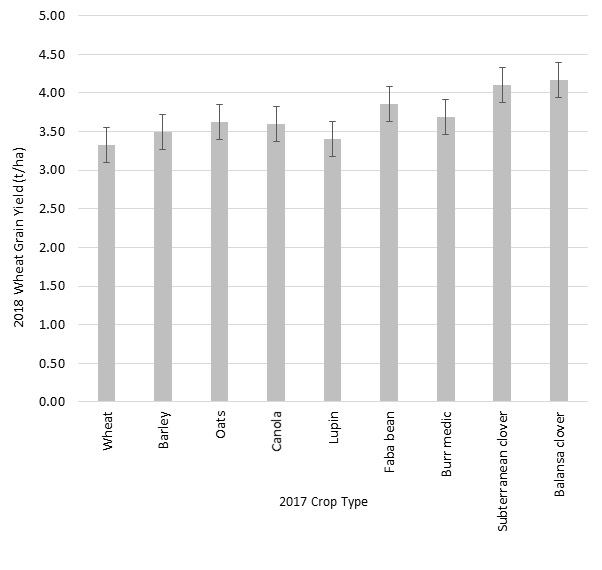
Figure 1. Sherwood 2018 wheat grain yields (t/ha), following different crop types sown in 2017. Error bars indicate standard error.
Conclusion
Data presented in this paper are initial findings from the first two years of the four-year phased rotational trials, and as a consequence, needs to be interpreted with caution, until all phases, sequences and robust analyses have been completed. Pasture legume phases can provide residual soil N amounts comparable to that of pulse crops, providing a potential benefit to subsequent crops. The use of double breaks to increase soil N for subsequent crops needs further investigation.
All harvest data is being statistically analysed, however when reviewing wheat grain yields in 2018, it was observed that at Bordertown, the higher yielding site, the value of a legume break crop to increase subsequent wheat crop yields was not realised in 2018. In contrast, at Sherwood, the lower yielding site, it was observed that the use of a pasture break crop did increase yields of subsequent wheat crops compared to canola and cereal break crop options. A 26% increase in wheat yields following balansa clover was achieved at Sherwood in 2018 compared to a wheat on wheat rotation.
Useful resources
GRDC (Grains Research & Development Corporation) (2009) Good rotations –when do you need a break.
Pearce AL, Turner F (2015) Final Report Crop Sequencing Project (CSP00146) – South East of South Australia – Lochaber. Technical Report Online
Acknowledgements
The research undertaken as part of this project is made possible by the significant contributions of growers through both trial cooperation and the support of the GRDC, the author would like to thank them for their continued support. The research has been funded through the GRDC- SARDI Strategic Research Agreement (Program 5, Regional Agronomy Capacity).
Contact details
Amanda Pearce
74 Struan House Road, Naracoorte SA 5271
PO Box 618, Naracoorte SA 5271
0407 400 939
amanda.pearce@sa.gov.au
GRDC Project Code: 9175938BA,
Was this page helpful?
YOUR FEEDBACK