Mungbean agronomy research for Central Queensland
Author: Doug Sands (DAF Qld), Peter Agius (DAF Qld), Kerry Bell (DAF Qld) | Date: 28 Nov 2019
Take home messages
- Mungbeans can be grown in any row spacing from 25cm to 100cm without any yield penalty up to 1.5 t/ha. Yield gains can be made by planting in 25 to 50cm rows in conditions that allow for yields above 1.5 t/ha
- Populations below 10 plants/m² will suffer yield penalties at all row spacings. Populations between 20 – 30 plants/m² will maximise yields in most yield brackets. The highest irrigated yields have been achieved with 35 – 45 plants/m² on narrow rows
- Planting mungbeans later in the summer window (February) can have significant yield benefits by avoiding high evaporative conditions leading up to flowering and during flowering.
Introduction
The Queensland Pulse Agronomy Initiative project funded a series of trials across Southern and Central Queensland from 2013 to 2018. These trials examined a range of issues that related to a physiology approach to improving yield and reliability in a broadacre crops by combining genetics (G) by environment (E) by management (M). The genetic component is represented by current breeding programmes in both mungbeans and chickpeas and the latest commercial releases. The environmental component relates to climate and weather which can be quite different across growing regions such as the inner Darling Downs of southern Queensland (SQ) versus the central highlands of Central Queensland (CQ).
The management component is all those things that agronomists and growers can control. In this particular project, experiments were designed to combine components like row spacing, plant populations and time of sowing to find the ‘sweet spot’ for mungbean production. While there was a number of trials conducted in this five-year period, this paper will focus on two experiments that were carried out in 2016 and 2017 to illustrate some of the general outcomes of this work and provide a typical data set for recommendations.
Experimental outline
Experiment 1 (2015-16 summer)
This trial was conducted at the research facility based at the Emerald Agricultural College. Mungbeans were planted at three sowing dates; 18 December, 13 January and 18 February, with each time of sowing (TOS) being a standalone block split into three row spacing (25 cm, 50 cm, and 100 cm). Each row spacing block was split in half and one side had irrigation applied through hand shift spray lines. These two halves were then each split into four population treatments (10, 20, 30 and 40 plants/m²). One variety was used across the trial (Jade) and all treatments within each time of sowing (TOS) block were replicated three times. Each plot was 4 meters wide by 12 meters long and Supreme Z® was applied with the seed at 30 kg/ha. The trial site had a pre-plant fertiliser application of CK55(S)® at 150 kg/ha on 50 cm spacing.
Due to ongoing dry conditions and a short turnaround from a wheat cover crop, the trial block was pre-irrigated twice before the first planting, ensuring there were consistent moisture conditions to plant into. The second and third plantings were planted on rainfall.
Due to some difficult conditions in December, established plant populations did not meet targeted populations (Figure 1). Significant differences were maintained between the 10, 20 and 30 populations but the 40 plants/m² ended up being similar to the 30 plants/m² populations. The January and February plantings were much better and established populations were close to target.
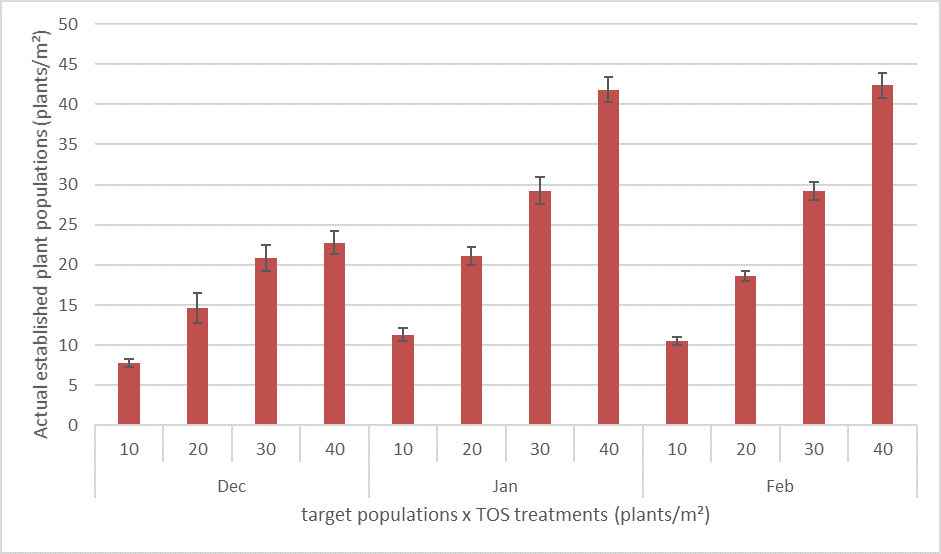
Figure 1. Target populations versus established populations across time of sowing.
Experiment 2 (2017-2018 Summer)
A trial was conducted at the research facility based at the Emerald Agricultural College. Mungbeans were planted at three sowing dates; 8 December, 18 January and 2 March, with each TOS block being planted twice in each replicate so that one block could be supplemented with sprinkler irrigation (soil water conditions) with the other being left as dryland (or rainfed). Each of these blocks where then split into two row spacing (25 cm, 100 cm) and each row spacing block was further split into 8 treatments which consisted of two varieties (Jade , Satin II ) by four foliar nitrogen (N) treatments (0, 10, 20 and 30 kg/ha).
Each plot was 2 meters wide by 16 meters long and Supreme Z® fertiliser was applied with the seed at 30 kg/ha at planting.
Due to ongoing dry conditions and a short turnaround from a sorghum cover crop, the trial block was pre irrigated twice before the first planting, ensuring there were consistent moisture conditions to plant into. The December and March TOS were planted with irrigation while the January TOS was planted on rainfall.
A number of measurements were recorded throughout the life of the crop. These included plant counts, light interception readings, dry matter cuts, hand harvest, machine harvest and weather data that was logged every 15 minutes. Also measured was starting plant available water content (PAWC) and a full soil analysis at planting.
Results
Experiment 1 (2015-16 summer)
There were large blocks of data collected from this trial including weather information, dry matter yields, grain yields, neutron probe readings, hand harvest yields and grain weight and protein data; for the purpose of this paper the results presented will focus on the yield performance of the row spacing and population treatments across the three times of sowing under irrigated and dryland conditions.
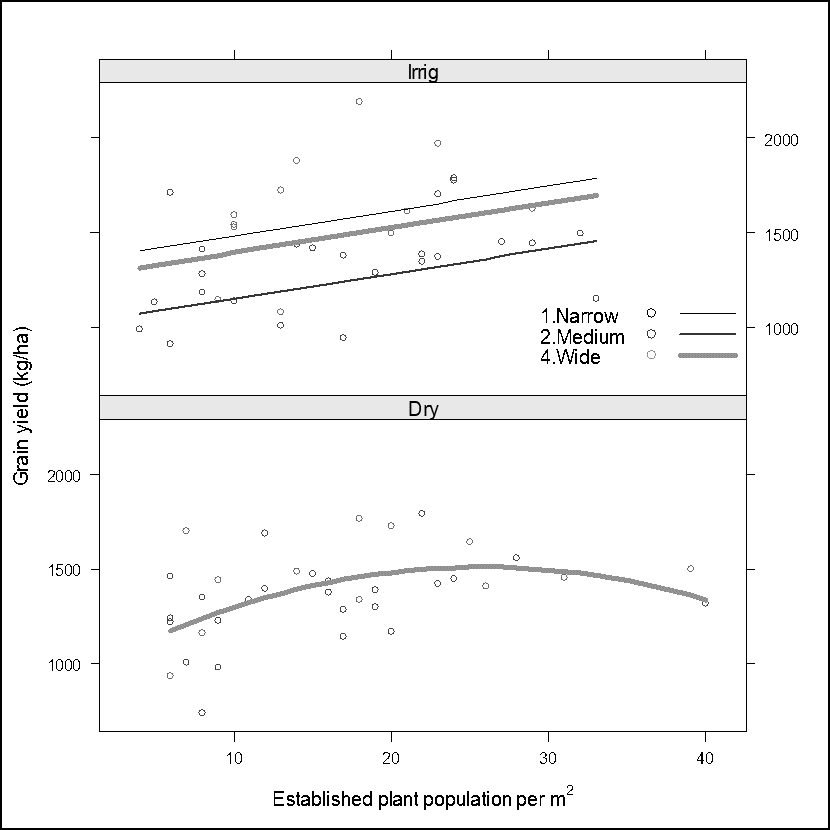 Figure 2A: Grain yield data analysed using linear mixed models within TOS1 (December) for population and row spacing effect across dryland and irrigated treatments
(Row spacing; narrow = 25cm, medium = 50cm, wide = 100cm)
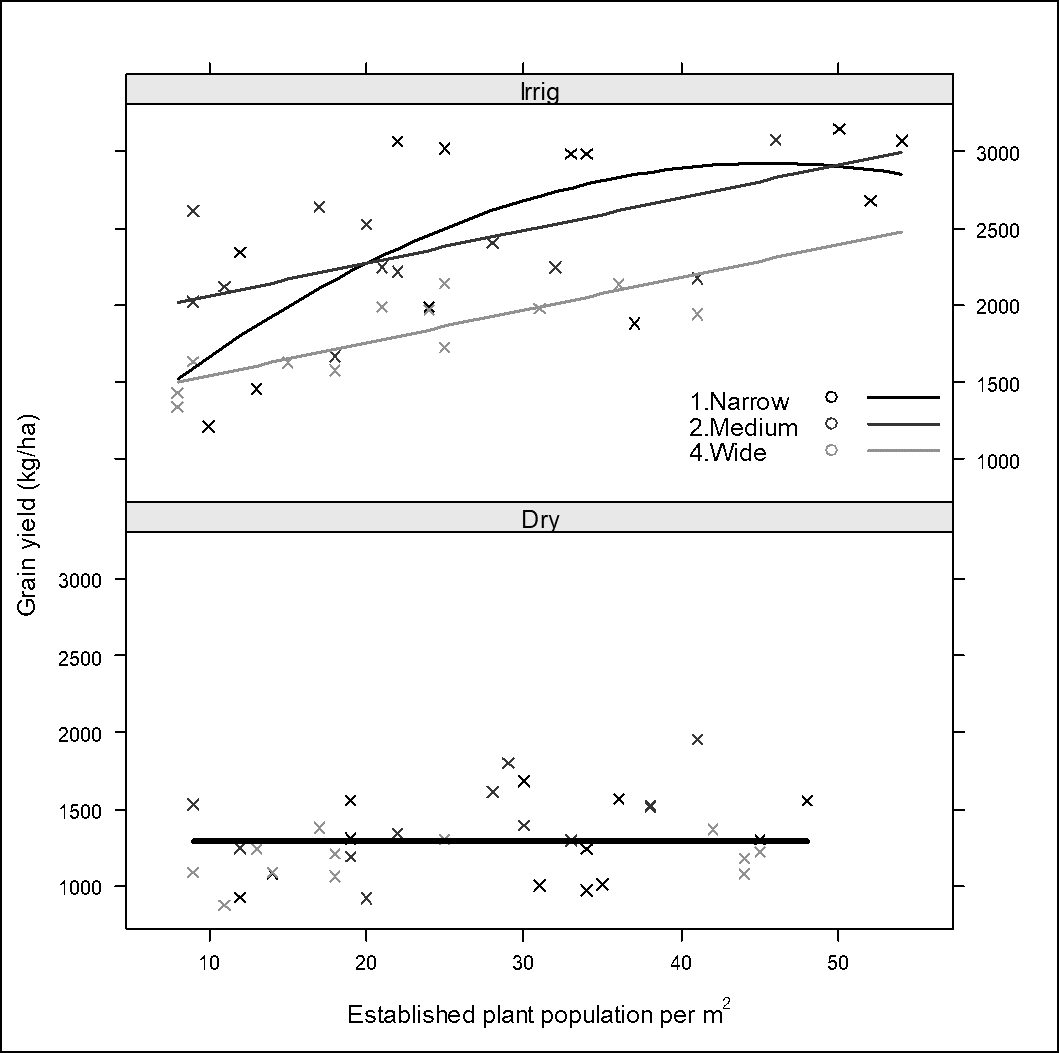
Figure 2B: Grain yield data analysed using linear mixed models within TOS2 (January) for population and row spacing effect across dryland and irrigated treatments.
(Row spacing; narrow = 25cm, medium = 50cm, wide = 100cm)
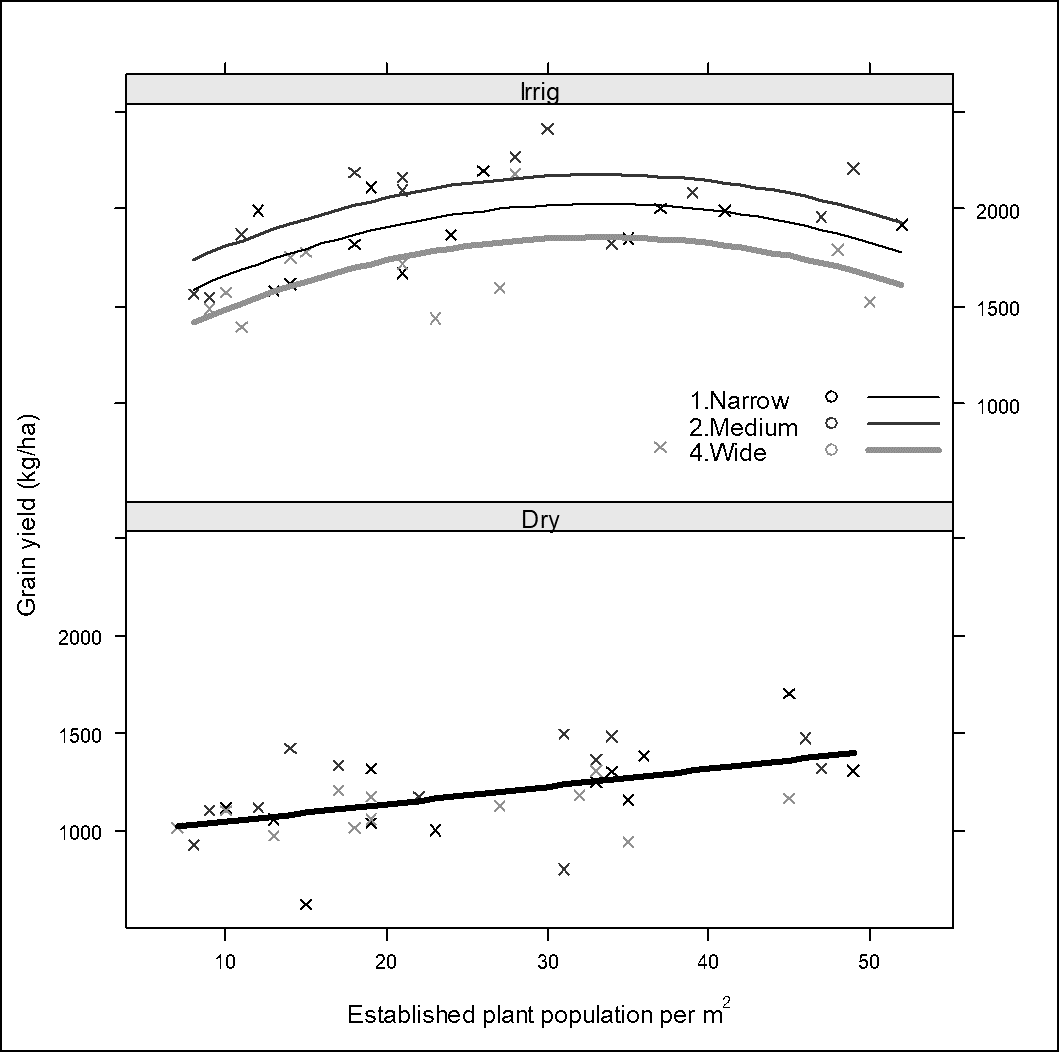
Figure 2C: Grain yield data analysed using linear mixed models within TOS3 (February) for population and row spacing effect across dryland and irrigated treatments.
(Row spacing; narrow = 25cm, medium = 50cm, wide = 100cm)
Grain yield data (Figure 2A-2C) would suggest there is no significant difference between row spacing in the dryland treatments. In all three TOS the dryland yield range was between 0.8 to 1.5 t/ha. This would suggest that within this yield bracket row spacing has no real impact on achieving those yields.
Population impact on yield in the dryland treatments are small (Figure 2C and 2A) or not significant at all (Figure 2B). This would indicate that plant compensation within various populations would seem to be good enough to achieve this water limited yields of between 0.8 to 1.5 t/ha.
When extra water is added through irrigation or rainfall there are more positive differences in both population and row spacing. Depending on the TOS there is a significant difference in the curves for row spacing in TOS2 (January) and TOS3 (February). Generally, the response is linear to population within each of these row spacing. The narrow (25cm) and medium (50cm) rows have a significant advantage at all populations while the 25cm rows can have a quadratic relationship where the lowest populations have a significant downside in yield compared to where yield peaks at 45 plants/m².
TOS may have an impact on the size and type of response. The December TOS (TOS1) had a basic linear response to population and February (TOS3) had a quadratic response to population and January (TOS2) had a bit of both. Yield brackets are different between each TOS with January (TOS2) being 1.5 to 3 t/ha whereas the other two TOS are in the 1.0 to 2.2 t/ha.
The overall trend suggests population and row spacing have limited impact up to 1.5 t/ha although there is generally a drop off in yield below 10 plants/m². When yields climb above 1.5 t/ha and this generally requires irrigation or well time rainfall events the narrow rows (25-50cm) and higher populations (35 to 45 plants/m²) can make significant improvements to yield.
Experiment 2 (2016-2017 Summer)
There are many aspects to the data collected for this trial, however in relation to this paper the data presented will focus on the TOS aspects of this trial and the differences that TOS has made to the performance of the crop.
Average grain yields across all three TOS (December, January and March) for both row spacing (Figure 3B) and variety (Figure 3A) would indicate that the later TOS (March) was the most successful in maximising grain yield. The only exception to this was Jade and the 100cm rows which plateau in January and March.
Similarly, the difference between those plots that got irrigated and the rainfed plots were greatest in the early TOS (December) while in January and March the effect was mostly non-significant. This response has been compromised by the fact that the January TOS received 104mm of rainfall after the start of flowering, and the March TOS received 164mm before the start of flowering. In contrast the December TOS received 72mm before flowering and 30mm after flowering.
As with all TOS trials the pattern of weather conditions is paramount in understanding the differences in crop performance.
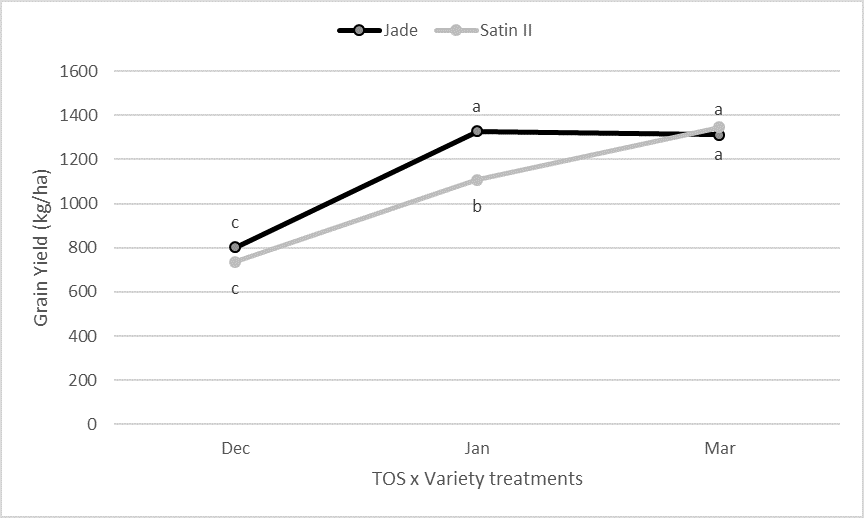 Figure 3A: Comparison of mean grain yields for varieties across three times of sowing (TOS). Means with the same letters are not significantly different at the P=5% level (LSD = 159.4).
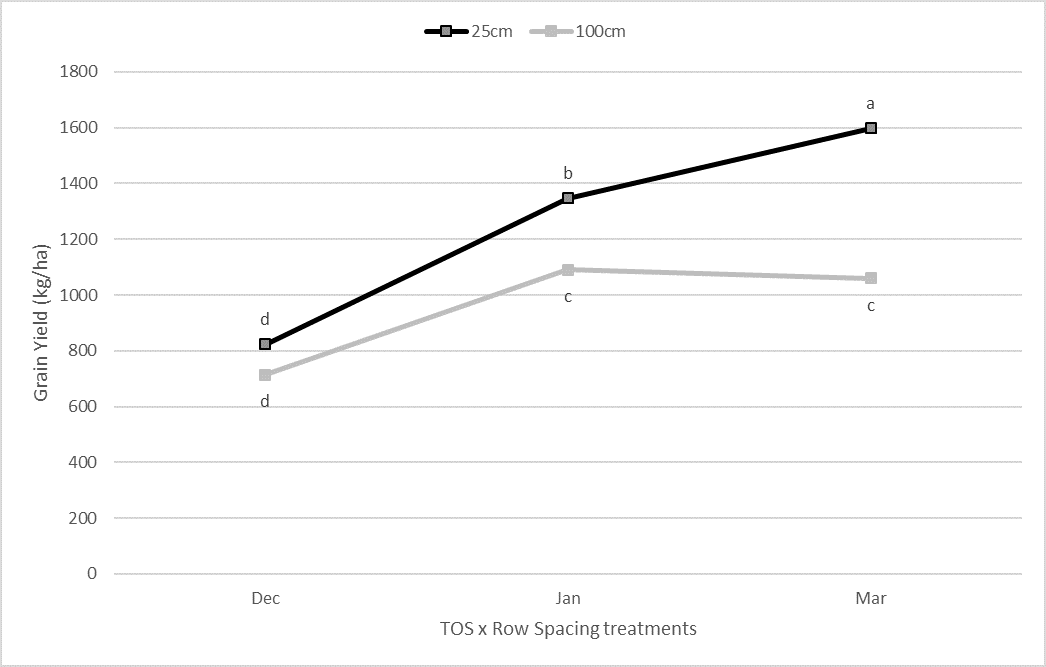 Figure 3B: Comparison of mean grain yields for row spacing across three times of sowing (TOS). Means with the same letters are not significantly different at the P=5% level (LSD = 179.6).
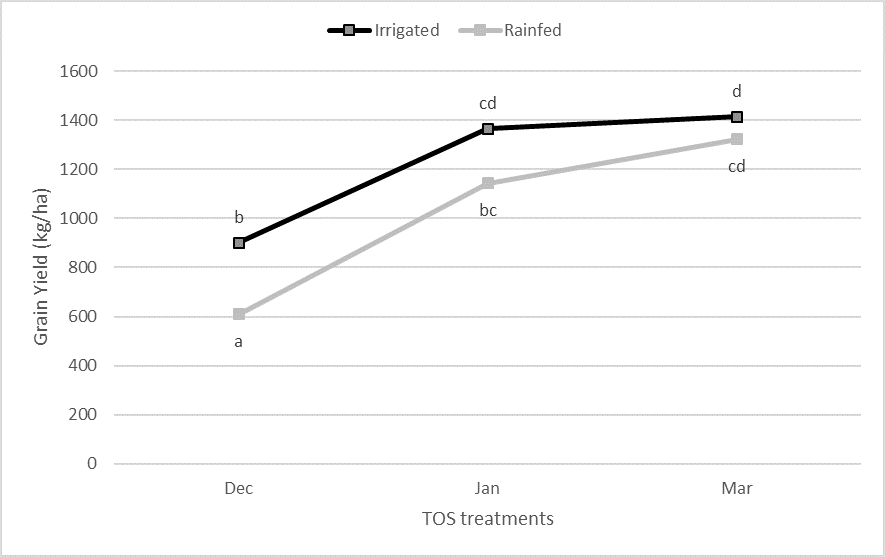 Figure 4. Comparison of mean grain yields for irrigated and rainfed treatments across three times of sowing (TOS). Means with the same letters are not significantly different at the P=5% level (LSD = 258.9).
Previous data sets from other TOS trials has shown that water balance in the plant is critical, especially the rate or speed that water has to be extracted (evaporative demand) and moved through the plant to maintain full turgor pressure in plant cells and maintain normal metabolism.
While temperature data and evaporation data can give good indications of when conditions are more extreme in relation to maintaining optimum plant growth, an alternative measure is vapour pressure deficit (VPD) which is a combination of temperature and humidity at the same moment in time. The drier the air the more pressure on the plant to lose water faster much the same way that delta T indicates the speed at which a water droplet will evaporate.
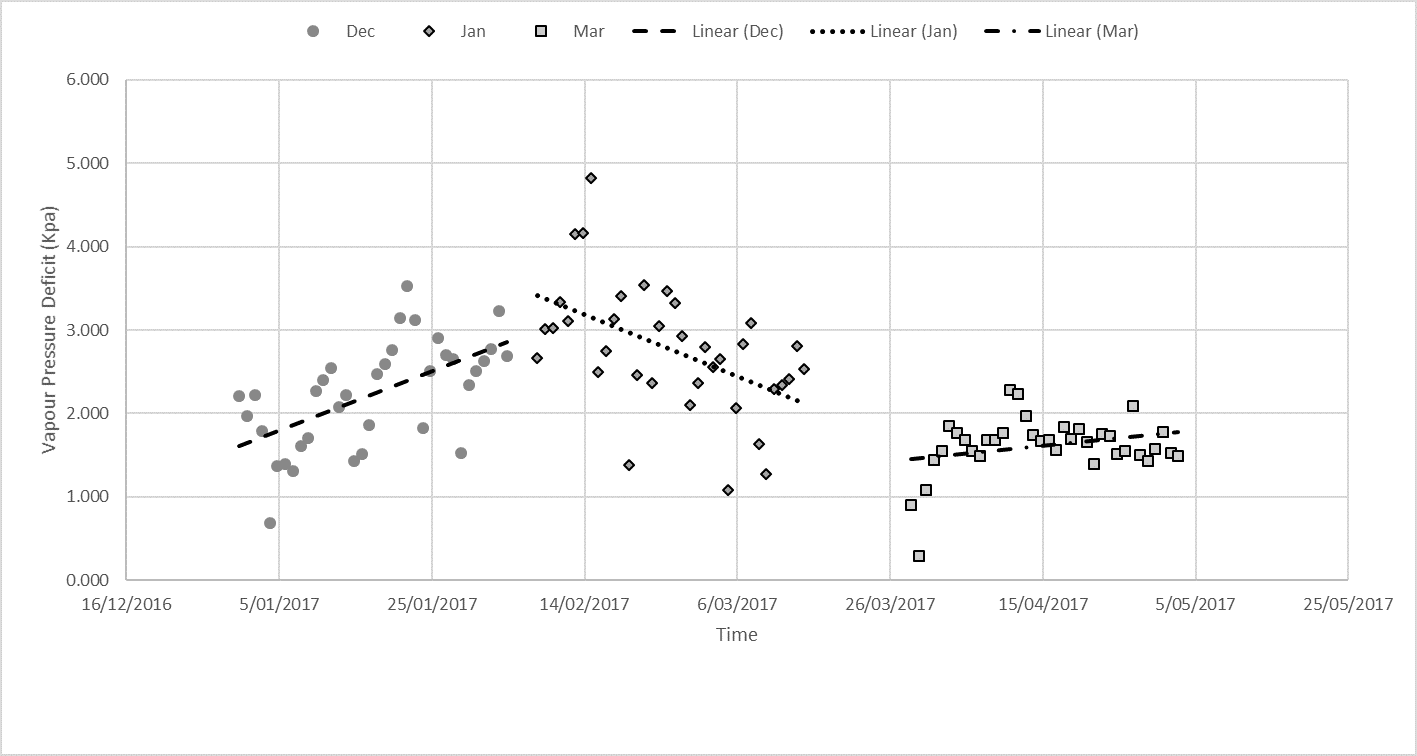
Figure 5. Mean daily Vapour Pressure Deficit (VPD) measurements for each time of sowing (TOS) over a five-week period centred on the start of flowering.
The VPD data for the 2017 trial (Figure 5) shows a contrast between all three TOS. The December TOS which had the lowest grain yield experienced increasing VPD from two weeks prior to the start of flowering and the three weeks that followed (most of the flowering period). The January TOS had almost the mirror image in terms of VPD readings with steadily declining numbers while the March planting had a more consistent readings which were mostly all under two kilopascals (Kpa).
It would be expected that these conditions would provoke a stress response of some sort in the plant itself. A symptom of this response may be evident in the pattern of dry matter accumulation in the plant particularly after the start of flowering.
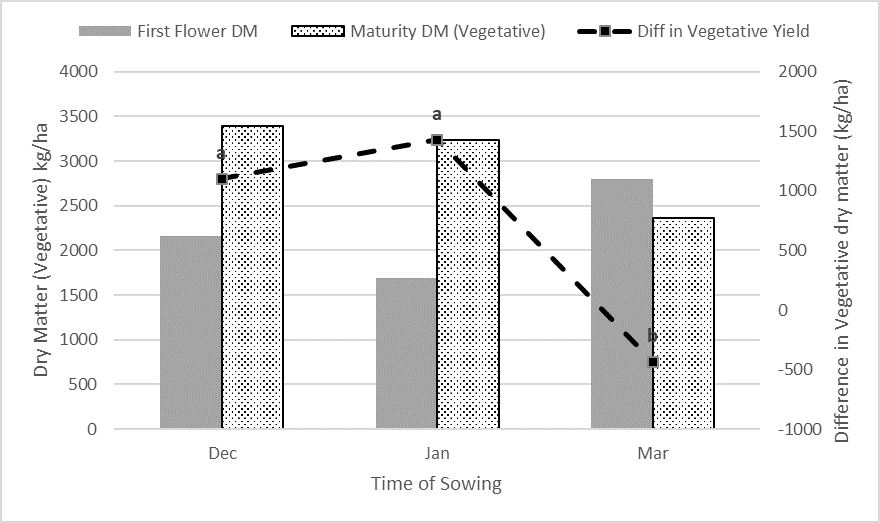 Figure 6. Difference in vegetative dry matter from the start of flowering to maturity across TOS. Means with the same letter are not significantly different at P=5% (LSD=415)
The two TOS that experience the highest levels of VPD, also produced the most amount of vegetative growth after the plant had started flowering (Figure 6). In contrast the March TOS grew no vegetative yield after flowering had started which is typically what the mungbean plant is physiologically programmed to do as it is classed as a vegetatively determinant plant. This means the December and January TOS were trying to grow vegetatively and reproductively at the same time which means a splitting of its resources at a critical time.
Consequently, the harvest index (total grain yield divided by total dry matter) of the first two TOS (Figure 7) were much lower than the March TOS of 0.33 – 0.35. This harvest index would suggest that yield potential was maximised in relation to vegetative growth for the March sowing whereas the other two TOS were not, despite growing more total dry matter (Figure 7). This may mean that plants growing in lower VPD conditions have the best chance of achieving their highest potential harvest index and consequently the most efficient grain yield.
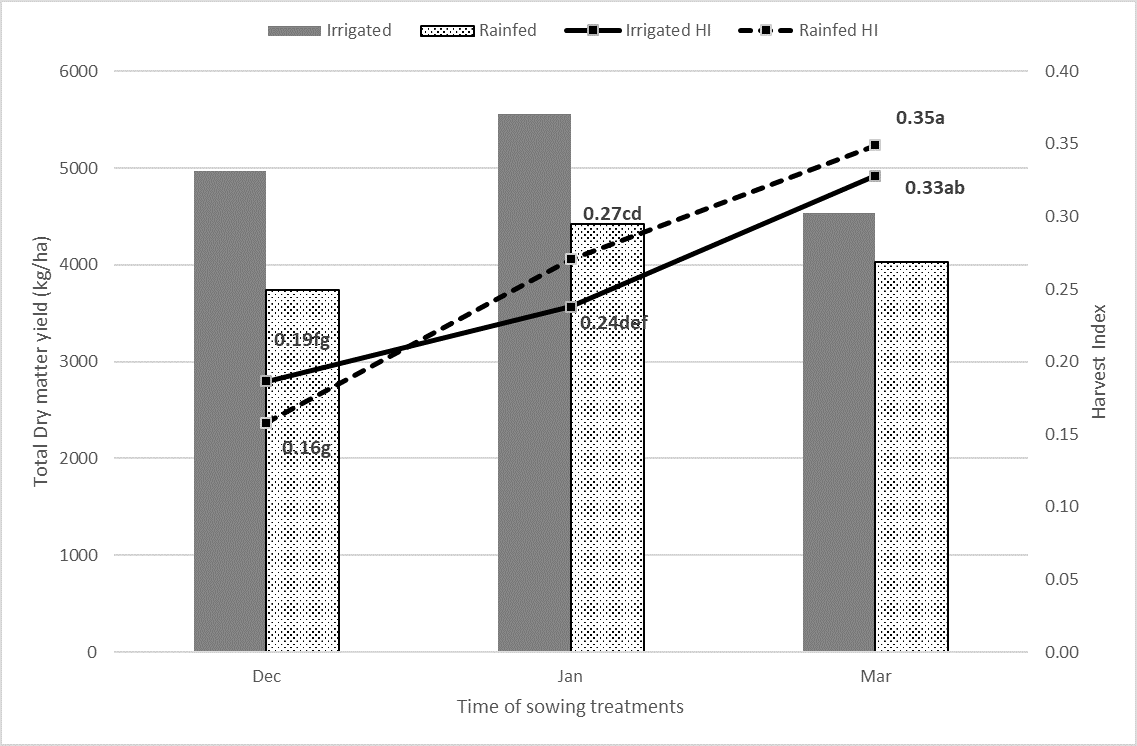 Figure 7. Comparison of total dry matter production and harvest index across TOS treatments split between irrigated and dryland conditions. Means with the same letters are not significantly different at the P=5% level (LSD=0.05247).
The consequence of this data is that plant windows should target weather conditions that give the plant its best chance of optimising its yield. Avoiding periods of high VPD conditions during flowering and the lead up to flowering could assist in maximising grain yield and harvest index for mungbeans. This experiment was conducted on the Central Highlands and clearly the later sowing had the benefit of avoiding those high VPD conditions; however, these conditions do not necessarily occur at the same time throughout the region nor do they occur at the same scale. For this reason, the optimum TOS maybe slightly different for each major growing region depending on when high VPD conditions are present and how severe they are. For example, there are subtle differences between the Central Highlands and the Dawson Callide growing areas in relation to VPD (Figure 8).
The Dululu site (Dawson Callide) shows VPD numbers dropping below 2.5 Kpa and staying below this figure from the 17 February onwards. For the Emerald site this does not occur until the 17 March (Figure 8). To ensure that the start of flowering occurs in these conditions; the sweet spot for planting should be no more than ~ 30 days earlier. Therefore, the most optimum planting window for Emerald is the 15 February (third week) and for the Dawson Callide it would be the 17 January (third week).
It is well understood that for dry land production systems planting opportunities will be based around the timing of rainfall so planting windows need to flexible; however the data in this paper makes the point that timing of weather conditions that contribute to a more optimum growing environment can change from region to region and can have a large benefit on yield.
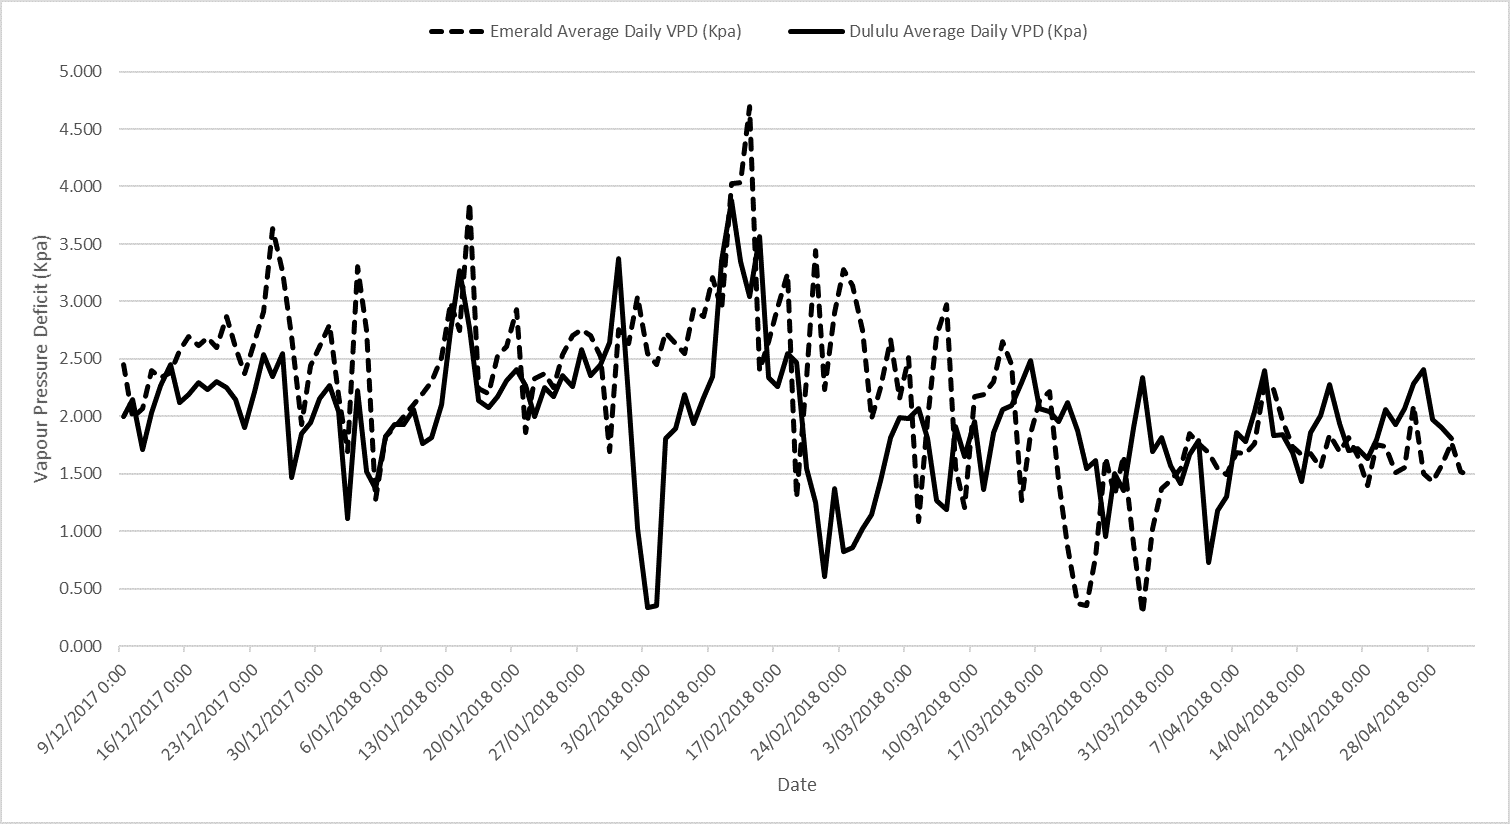 Figure 8. Daily mean VPD recorded for Emerald and Dululu in 2017-18 summer.
Summary
Row spacing configuration will only make an impact on grain yield for mungbeans when yields are approaching 1.5 t/ha or better and this tends to be where growers can use supplementary irrigation. Plant populations can be elastic as there is some compensatory capacity in the mungbean plant, however higher populations (35-45 plants/m²) can make a significant difference on narrow rows in high yielding situations (>1.5 t/ha). At the other end of the scale populations that are less than 10 plants/m² can have a significant decline in yield in both irrigated and dry land production.
TOS experiments have proven over a number of years that planting windows can have a big impact on yield. Poor production seems to be associated with conditions where the plant struggles to maintain its water balance on stored moisture, therefore those conditions that create high evaporative pressure on the plant seem to be the most limiting to yield.
One way of identifying these conditions is through the use of VPD data which takes into account not only temperature but humidity as well. When mean daily VPD figures are low (<2.5 Kpa) then the mungbean plant seems have a more normal growth pattern and subsequently a better harvest index. For growers in the CQ region using later summer planting windows (late January to early March) gives them the best chance of getting low VPD conditions before and during flowering.
Acknowledgements
The research undertaken as part of this project is made possible by the significant contributions of growers through both trial cooperation and the support of the GRDC, the author would like to thank them for their continued support.
Contact details
Douglas Sands
Queensland Department of Agriculture and Fisheries
99 Hospital Road, Emerald 4720
Ph: 07 49910 811
Fx: 07 49837 459
Email: douglas.sands@daf.qld.gov.au
Varieties displaying this symbol beside them are protected under the Plant Breeders Rights Act 1994
® Registered trademark
GRDC Project Code: UQ00067,
Was this page helpful?
YOUR FEEDBACK
