A survey of crop establishment in canola and lentil — what have we learnt?
Take home messages
- Crop establishment among commercial crops is variable and improvements can be made in many cases.
- Improving establishment may lead to saving in seed costs.
- Establishment of canola and lentil is influenced by different factors.
- While some factors are outside the control of growers, there are a number of simple changes that can be made to maximise establishment.
Background
Germination and establishment is a critical period in crop growth. Firstly, germination and establishment determine the plant population, which influences the level of early crop vigour, competitiveness against weeds and yield. Secondly, the evenness of establishment influences the level of interplant competition. Early work on seedling emergence indicated that seedlings that emerged early had a competitive advantage over those that emerged later (Knight, 1983; Soetono and Donald, 1980; Gan et al., 1992). A uniform plant stand can reduce interplant competition and result in significant increases in yield (Yang et al., 2014) but the benefits of this tend to be greatest at low plant populations (Kemp et al., 1983; Sattorre, 1999, Kristensen et al., 2008).
There is relatively little information on the levels of crop establishment currently achieved in commercial crops. This paper summarises the results of a survey of crop establishment in canola and lentil in the southern and western GRDC zones and considers some of the factors that have contributed to variation in establishment. The aim of the survey was to provide benchmark data for current practices and identify the factors that most strongly affect establishment to inform future research.
Method
Commercial crops were surveyed in South Australia (SA), Victoria, Tasmania and Western Australia (WA) in 2018 and 2019. The crops targeted were canola, lentil and faba bean in the southern region and canola, lupin and wheat in the western region. This paper will only report on the results for canola and lentil.
In each paddock, five sample sites were randomly selected. At each location, seedling numbers were counted in two adjacent rows along a 3m length of row. The cumulative distance between 30 adjacent seedlings in each row was measured to estimate mean interplant distance. Seedling depth was measured by cutting seedlings at the soil surface, excavating the seed and measuring the vertical distance from the seed to the cut surface. The amount of stubble cover was assessed by comparison with standard photographic charts. A sample of the seed used to sow the crop was collected to measure mean seed weight and germination percentage.
A questionnaire was distributed to growers to gather information on the seeding equipment used, how it was set up and the management of the paddock and crop. Crop establishment percentage was estimated from the plants/m2 and the seeds/m2 sown. Uniformity of crop establishment was measured by the co-efficient of variation (CV) in plant number and interplant distance.
In a small number of paddocks, more intensive sampling of crop establishment was conducted to assess the variation in plant number and seedling depth across the width of a seeder bar. Measurements were taken from the left, middle and right sections of the seeder at two locations in the paddock. At each position the number of seedlings per 3m or row was counted, and the depth of seed placement was measured at seedlings approximately every 30cm along the row.
Results and discussion
Seeder age and set up
The median age of the seeders was six years in the southern region and eight years in the western region. Disc seeders were used by 13% of the growers. Inter-row sowing was practised by 54% of growers. All the growers used press wheels however only 22% of growers knew the specific pressure at which the press wheels were used, and among those there was a great variety in responses. The most common pressure reported was 10kg (by six growers) but values ranged from 5kg to 130kg. Good seed-soil contact is important for germination, but these results suggest there is a lack of information on what are appropriate pressures to use, to optimise the performance of press wheels under different conditions.
Separate delivery of seed and fertiliser was more commonly used by growers in the western region (83%), while in the southern region roughly half the growers used a single delivery system. Most growers in the southern and western regions sowed seed in a single row rather than using paired rows. The average depth of the furrow cut (mean ± SEM) was similar for canola (61 ± 6.0mm) and lentil (62 ± 6.5mm).
Sowing rates and crop establishment
The average sowing rate over all sites for canola was 2.7kg/ha (range; 1.4 to 4.0 kg/ha) and 48 kg/ha for lentil (range; 35 to 60 kg/ha). On average, growers sowed 60 to 70 seeds/m2 for canola and 118 seeds/m2 for lentil (Table 1). Crop establishment averaged 51% in canola in the western region to 82% in lentil. Lentil showed less variation in plant number and interplant distance than canola — the median CV for interplant distance was 145% in lentil and 160% in canola. The corresponding median CVs for plants/m2 were 20% in lentil and 25% in canola.
Table 1. The mean number of seeds/m2 sown, establishment (%) and seedling depth for canola and lentil in the southern and western regions. The values are shown as mean ± standard error of the mean (SEM) and the number of paddocks in the sample is shown in parentheses.
Canola | Lentil | |
|---|---|---|
Seeds/m2 sown | ||
Southern | 61 ± 4.1 (30) | 118 ± 4.5 (18) |
Western | 71 ± 9.9 (6) | |
Establishment (%) | ||
Southern | 67 ± 4.1 (29) | 82 ± 5.0 (17) |
Western | 51 ± 5.8 (6) | |
Seedling depth (mm) | ||
Southern | 22 ± 1.3 (38) | 35 ± 2.4 (24) |
Western | 19 ± 1.3 (9) |
Mean germination for all the seed samples submitted was 88% in canola and 90% in lentil. Growers who indicated they adjusted their sowing rate for seed size and/or germination percentage did not achieve significantly better establishment than growers who didn’t. However, the method of calibration appeared to influence establishment, with manual calibration tending to result in poorer establishment compared to using the seeder’s control system. Establishment following manual calibration was 63 ± 5.1% in canola and 79 ± 6.1% % in lentil, compared to 72 ± 9.2% and 99 ± 11.2% with the control system. The specific reason for this difference is unclear but it was a consistent effect in both crops. Among the canola paddocks, establishment was higher in hybrid varieties (72 ± 5.9%, n = 20) than in open pollinated varieties (60 ± 6.9%, n=14), which most likely reflects the greater vigour of the hybrid seed.
Table 2. Crop establishment (%) in two crops classified by sowing method. Crops were either sown between (inter-row) or not between (non-inter-row) previous crop rows, with a separate or single seed/fertiliser delivery system or in single or paired rows. The values are shown as the mean ± SEM and the number of paddocks in the sample is shown in parentheses.
Canola | Lentil | |
|---|---|---|
Sowing | ||
Inter-row | 62 ± 4.1 (17) | 85 ± 5.9 (14) |
Non inter-row | 67 ± 8.2 (15) | 73 ± 3.2 (2) |
Shoot type | ||
Separate | 70 ± 7.2 (17) | 92 ± 6.2 (11) |
Single | 57 ± 4.0 (15) | 65 ± 1.4 (5) |
Seeding rows | ||
Paired | 74 ± 10.7 (2) | 76 ± 1.6 (2) |
Single | 64 ± 6.7 (19) | 68 ±2.6 (6) |
Inter-row sowing did not significantly affect establishment in canola (Table 2). Most lentil crops were inter-row sown and their establishment was higher compared to crops that were not sown between the rows. However, this result needs to be interpreted cautiously because of the very small number of crops (two paddocks) that were not inter-row sown.
Separating seed and fertiliser delivery improved establishment in both crops (Table 2). The potentially harmful effects on germination and seedling growth of having seed and fertiliser close to one is well known and this effect can be exacerbated under dry conditions. Having separate delivery systems is an effective way of maximising establishment.
Using paired rows rather than sowing in a single row also tended to improve establishment, although there were fewer paddocks in this comparison (Table 2). Using paired rows will increase the seed bed utilisation (SBU), which will help reduce interplant competition within the row and mitigate any potentially harmful effects of fertiliser.
Canola establishment in the southern and western regions region was lowest on sandy soils and in the southern region it tended to increase with the clay content (Table 3). Lentil was less sensitive to texture. There was no consistent effect of soil properties (pH, EC and ESP%) on emergence.
Table 3. Establishment (%) of canola and lentil on soils with different textures. The values are shown as mean ± SEM and the number of paddocks in the sample is shown in parentheses.
Soil texture class | Canola | Lentil | |
|---|---|---|---|
Southern | Western | Southern | |
Sand | 55 (1) | 30 (1) | |
Sandy loam | 60 ± 14.8 (3) | 56 ± 6.1 (3) | 96 ± 25.3(2) |
Loamy sand | 67 ± 11.2 (4) | 54 ± 9.7 (4) | 80 ± 6.8 (6) |
Loam | 67 ± 11.5 (5) | 104 ± 13.1 (3) | |
Silty loam | 75 ± 17.8 (6) | 63 (1) | |
Clay loam | 75 ± 7.8(8) | 70 ± 6.9(2) | |
Management practices and establishment
Time of sowing was an important influence on establishment in canola and wheat. Establishment improved with later sowing into May (Figure 1). This effect may have been associated with the dry autumn over the southern and western region in 2018, which resulted in many crops being sown dry or under marginal soil moisture. This was supported by the relationship between rainfall and establishment in canola. Rainfall received in the four weeks centred on the time of sowing was positively related to establishment percentage (r = 0.39, P = 0.05, n = 25) and the uniformity of establishment, measured as the CV for plants/m2 (r - -0.41, P = 0.044, n = 25).
In canola, there are clear yield advantages to early sowing, so delaying sowing to improve establishment is counterproductive. However, the survey indicated there was a trade-off between sowing time and establishment, which seemed to be driven in part by rainfall. The survey confirmed that the risk of poor establishment in canola increases as soil moisture declines. It was also noted in the survey that most of the canola there was staggered emergence (that is, multiple canola growth stages), which is likely to have been largely affected by variation in soil moisture.
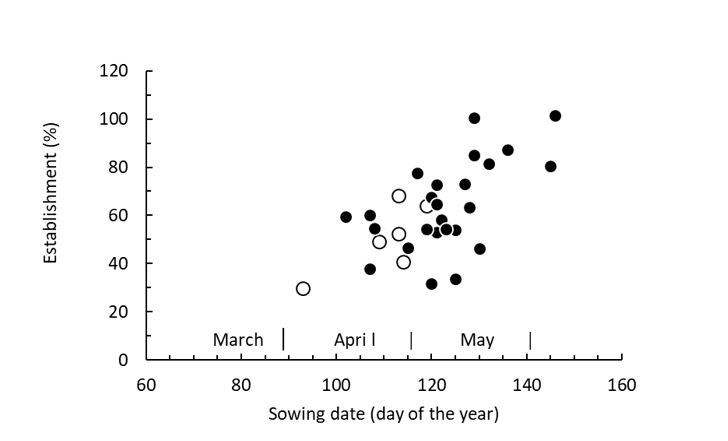
Figure 1. The relationship between sowing time and crop establishment in canola in the southern region (●) and the western region (○).
Lentil responded very differently to canola. Sowing date had no effect on crop establishment in lentil even though the range in sowing dates was similar to canola. High rainfall around sowing tended to reduce establishment percentage and decrease the uniformity of establishment. Per cent establishment was negatively correlated with rainfall received after sowing (r = -0.58, P = 0.02, n = 15) and total rainfall received in the two weeks prior to and after sowing (r = -0.64, P<0.01, n= 25). The CV for plant number was positively correlated with rainfall after sowing (r = 0.47, P = 0.08, n = 15).
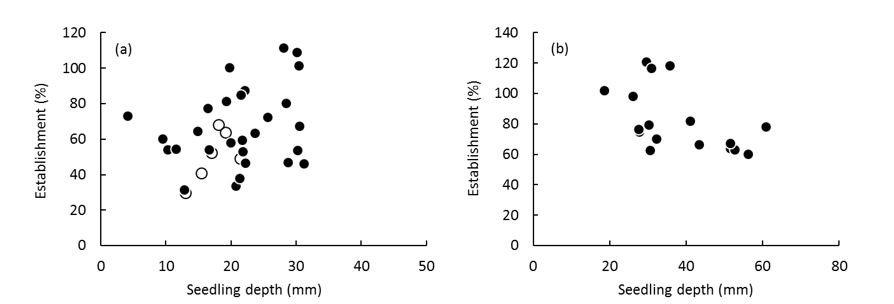
Figure 2. The relationship between seedling depth and establishment in (a) canola and (b) lentil in the southern region (●) and the western region (○).
Although variable, sowing to about 30mm improved establishment in canola in both the southern and western regions (Figure 2). It is likely that with the dry autumn in the survey area, there was insufficient moisture in the surface soil for high germination rates and growth of seedlings. In contrast, lentil establishment benefited from shallower seed placement, but the range of sowing depths was greater than that in canola.
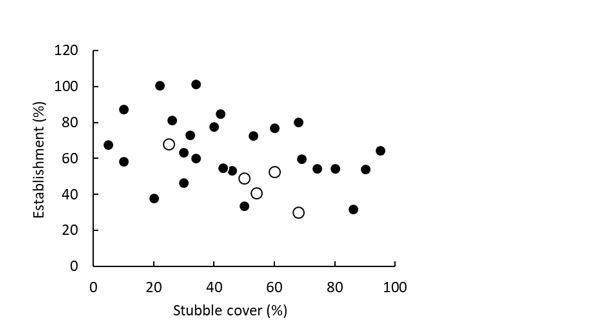
Figure 3. The relationship between the visual assessment of stubble ground cover and establishment in canola in the southern region (●) and the western region (○).
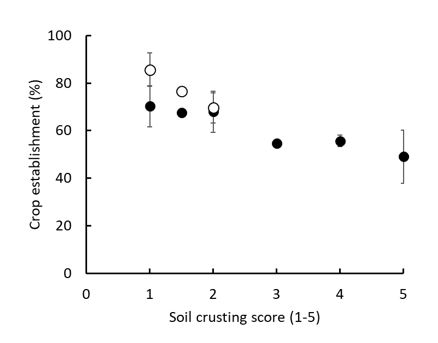
Figure 4. The relationship between assessment of surface crusting and emergence in canola (●) and lentil (○) in the southern region. Error bars are the standard errors of the means. Surface crusting was assessed visually based on a set of images; 1 well structured, no crusting; 2 moderate crusting; 3 severe crusting; 4 cultivated cloddy surface; 5 cultivated, good tilth. The number of paddocks on which the data are based ranged from one and 10.
High stubble loads at sowing tended to reduce emergence of canola (Figure 3) but the relationship was not strong. There was no effect of stubble cover on emergence in lentil. Emergence in both lentil and canola was sensitive to the condition of the surface soil (Figure 4) with emergence being lower as surface structure became poorer.
The survey data suggests that emergence in lentil is less sensitive than canola to a number of management practices and appears to be a more robust crop in this respect. The risk of poor establishment in canola is increased with shallow sowing under low soil moisture, high stubble loads and where surface structure is poor. The impact of reduced emergence on yield will depend on the degree to which plant number is reduced and how well the canola crop can compensate for low plant densities. Recent sowing rate trials suggest that at a yield level of about 1.5t/ha, populations of 20plants/m2 may not result in significantly lower yields compared to higher plant densities (Ware, 2018; McDonald et al., 2019).
Variation across seeders
The average values for plant number and seedling depth were similar at the two sampling sites in each paddock, but this belies the variability across seedling rows. There was considerable variation in the number of plants established and the depth of seed placement across a seeder (Figures 5 and 6). The average CV for plant number were 42% (SA site) and 33% (WA site), compared to an overall CV for canola of 25% across all the sites. Similarly, the average CV for seedling depth were 25% (SA) and 27% (WA), while the survey average for canola was 17%.
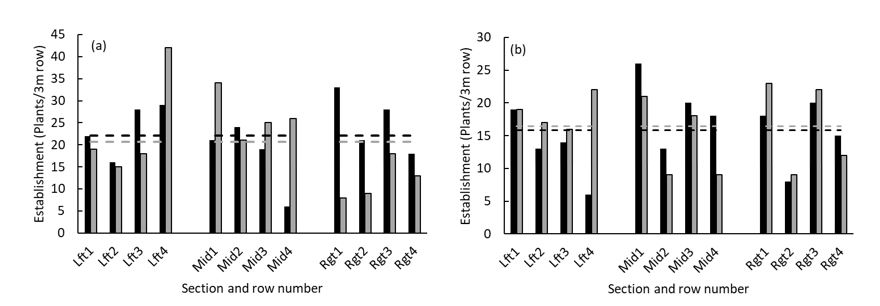
Figure 5. The variation in plant number of canola across the seeder bar in a paddock in (a) the mid North of SA (Flexicoil ST820) and (b) Corrigin, WA (Flexicoil PTX 601). The measurements were taken from adjacent rows in three sections of the seeder (left, middle and right), and from two locations in the paddock (black and grey bars). The horizontal lines are the average values for each location.
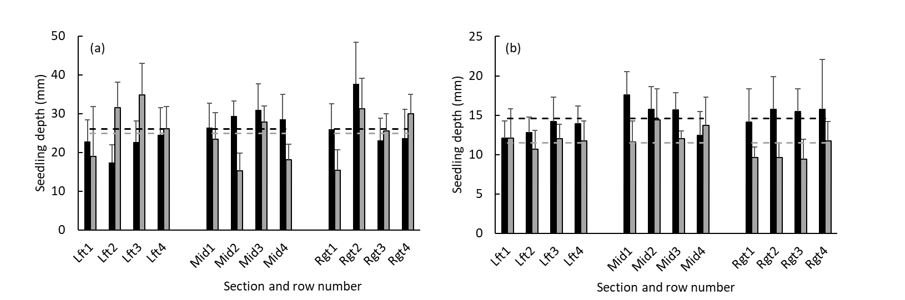
Figure 6. The variation in seedling depth of canola across the seeder bar in a paddock in (a) the mid North of SA (Flexicoil ST820) and (b) Corrigin, WA (Flexicoil PTX 601). The measurements were taken from adjacent rows in three sections of the seeder (left, middle and right), and from two locations in the paddock (black and grey bars). The horizontal lines are the average values for each location and the error bars are the standard deviations within each row.
Comparison of paddocks with good and poor establishment
While variation in crop establishment in canola and lentil was high among the surveyed paddocks, there were some growers achieving high and relatively uniform establishment. The features of paddocks that recorded high establishment (>80%), and poor establishment (<50%), are shown in Table 3, where results confirm a number of the trends observed in the survey.
In canola, better establishment was measured in later-sown crops, where there was slightly less stubble cover, slower sowing speeds and when there was more rainfall. In lentils however, sowing time and stubble cover were not related to establishment. In this case, higher establishment was associated with shallower depth of seed placement and when there was less rainfall after sowing.
Table 4. The average values of paddock and site characteristics from paddocks where high (>80%) and poor (<50 or <60%) establishment was measured in canola and lentil in the survey in 2018.
Canola | Lentil | |||
|---|---|---|---|---|
Est >80% | Est <50% | Est >80% | Est <60% | |
Seeder age (year) | 9 ± 2.0 | 7 ± 1.9 | 7 ± 1.0 | 6 ± 2.1 |
Stubble cover (% ground cover) | 34 ± 7.5 | 49 ± 10.3 | 70 ± 5.6 | 64 ± 5.9 |
Sowing date | 16 May ± 3d | 29 April ± 3d | 3 May ± 6d | 1 May ± 7d |
Sowing speed (km/h) | 8 ± 0.3 | 10 ± 0.6 | 10 ± 0.8 | 11 ± 0.8 |
Furrow depth (mm) | 57 ± 13.5 | 54 ± 15.8 | 68 ± 7.3 | 47 ± 6.0 |
Seedling depth (mm) | 25 ± 1.6 | 21 ± 2.1 | 30 ± 3.2 | 45 ± 3.9 |
Rainfall (mm) | ||||
14 days before sowing | 24 ± 8.8 | 11 ± 2.3 | 9 ± 3.6 | 10 ± 2.8 |
14 days after sowing | 20 ± 4.2 | 5 ± 5.6 | 4 ± 2.1 | 13 ± 3.4 |
Seedbed moisture content at time of assessment (% v/v) | 21 ± 1.7 | 20 ± 1.2 | 14 ± 5.7 | 23 ± 4.1 |
Conclusion
The survey highlighted the variation in crop establishment that occurs within a paddock and between paddocks. However, a number of growers are achieving high establishment and relatively uniform crop stands, which suggests improvements are feasible. The key outcomes from this survey to date are;
- Establishment in canola was lower and more sensitive to sowing conditions than lentil and this is where greater improvements can be achieved.
- The age and make of the seeder are less important than how it is set up and the conditions in the paddock at sowing.
- Maintaining good soil surface structure to minimise crusting will assist with better seedling emergence (through stubble retention or management of sodicity for example).
- Know your seeder. Factors under the control of growers that can influence establishment include; seeder set-up and operation (careful calibration), separating seed and fertiliser and increased SBU, sowing speed and sowing depth.
- Dry sowing - rainfall at sowing was more important to establishment in canola than in lentil, and early sowing will reduce establishment without adequate rainfall around the time of sowing. This is an inevitable trade-off that growers face with early sowing under dry conditions, but sowing rate trials suggest that as long as there are 20-30plants/m2 there may not be a significant yield penalty in canola.
Acknowledgements
The research undertaken as part of this project is made possible by the significant contributions of growers both through their cooperation and the support of the GRDC; the co-authors would like to thank them for their continued support.
We thank the many growers who collaborated with the survey and the assistance of the Leibe Group, the Facey Group, the Corrigin Farm Improvement Group and the McKillop Group in conducting the survey.
References
Gan, Y., Stobbe, E.H. and Moes, J. (1992) Relative date of wheat seedling emergence and its impact on grain yield. Crop Science 32, 1275-1281.
Kemp, D.R., Auld, B.A. and Medd, R.W. (1983) Does optimizing plant arrangements reduce interference or improve the utilization of space? Agricultural Systems 12, 31-36.
Knight, R. (1983) Some factors causing variation in the yield of individual plants of wheat. Australian Journal of Agricultural Research 34, 219-228.
Kristensen, K., Olsen, J. and Weiner, J. (2008) Crop density, sowing pattern and nitrogen fertilisation effects on weed suppression and yield in spring wheat. Weed Science 56, 97-102.
McDonald, G.K., Browne, C. and Noack, S. (2011). Precision planting in canola and lentil. In ‘Proceedings Australian Agronomy Conference’. (Wagga Wagga)
Sattorre, E.H. (1999) Plant density and distribution as modifiers of growth and yield. In ‘Wheat: Ecology and Physiology of Yield Determination’. (Eds E.H. Sattorre and G.A Slafer) pp. 141-159. (The Hawthorn Press, Binghamton, NY, USA)
Soetono and Donald, C.M. (1980) Emergence, growth and dominance in drilled and square planted barley crops. Australian Journal of Agricultural Research 31, 455-470.
Ware, A. (2018) Canola establishment on Upper Eyre Peninsula. In ‘Eyre Peninsula Farming Systems Summary 2017’. Pp. 140-141.
Yang, C., Gan, Y., Harker, N.K., Kutcher, H.R., Gulden, R., Irvine, B. and May, W. (2014) Up to 32% yield increase with optimised spatial patterns of canola plant establishment in western Canada. Agronomy of Sustainable Development 34, 793-801.
Contact details
Glenn McDonald
glenn.mcdonald@adelaide.edu.au
GRDC Project Code: UOA1803-009RTX,
Was this page helpful?
YOUR FEEDBACK