Developing a nationally validated model to predict flowering time of wheat and barley
Take home messages
- The GRDC national phenology initiative has been established to better predict flowering time of wheat and barley across the major cropping regions of Australia.
- A total of 64 wheat and 32 barley genotypes, selected for their diverse phenology, are being genotyped and phenotyped under different controlled conditions to parameterise the model. The same genotypes are also being grown and phenotyped at five field sites (two × WA, SA, NSW, VIC) across eight times of sowing to validate the model.
- The initiative will deliver a web-based tool through the National Variety Trials (NVT) website where growers and advisors can plan cultivar × time of sowing decisions for their specific environments. This will become available in 2022, with new cultivars being added as they are released.
Background
Wheat and barley must flower during an optimal period to maximise yield. The optimal flowering period (OFP) for a given environment can be defined as the period when risks of frost and insufficient biomass accumulation (from early flowering), and heat and drought (from late flowering), are minimised (Flohr et al 2017; Hunt et al 2019). Limiting these abiotic stresses during the reproductive phase leads to increased fertility and grain number on spikes, a longer grain-filling period and hence increased yield. The length and duration of the OFP is dependent on the environment. Hot low rainfall environments generally have an earlier and shorter OFP (late August to mid-September across <1-2 weeks). More temperate high rainfall environments will have a later and longer OFP (mid-September to late October, 2-3 weeks) (Flohr et al 2017; Liu et al 2020).
Interactions between the genotype (cultivar) sown, the environment it is being grown in and management practices — specifically time of sowing (TOS) — determine when flowering will occur in the field.
Cultivars develop at different rates in the field depending primarily on the alleles they carry. Occurring at five major development gene loci in wheat (Ppd-B1, Ppd-D1, Vrn-A1, Vrn-B1 and Vrn-D1), and four in barley (Ppd-H1, Ppd-H2, Vrn-H1 and Vrn-H2). These major genes determine a cultivar’s response to two environmental factors, temperature and photoperiod (day length). Temperature is the main environmental factor and daily mean temperatures between approximately 0°C and 35°C are conducive to progressing development (Porter and Gawith 1999). Cultivars carrying sensitive alleles at some, or all, of the VRN gene loci, will develop faster following an extended period of cool temperatures (i.e. winter, termed vernalisation; Trevaskis et al 2003). Cultivars with sensitive alleles at all VRN gene loci must experience vernalisation to progress from the vegetative to reproductive phase and are termed ‘winter habit type’. Conversely, cultivars that progress from the vegetative to reproductive phase regardless of whether they experience vernalising conditions or not are termed ‘spring habit type’. Most wheat varieties grown in Australia are spring types with moderate to no vernalisation response. It is also widely accepted that the spring type barley cultivars available to Australian growers have little to no response to vernalisation. In addition to habit type, cultivars vary in development rate due to response to photoperiod. Cultivars with sensitive alleles at the PPD gene loci will increase development rate as the days get longer, whereas photoperiod-insensitive cultivars will develop at a similar rate regardless of day length (Scarth and Law 1984). Variation in phenology of spring habit cultivars is largely dependent on this, and cultivars that are sensitive to photoperiod will accelerate development rate as the days start to get longer in early spring.
Traditionally spring habit cultivars are sown in southern Australia following the autumn break around late April to early May. These accumulate biomass over winter, flower between late August and mid-October (depending on location) and are harvested in early summer. However, the timing of the autumn break has become more variable and in-season rainfall has declined and become more variable since 1997 (Cai et al 2012), meaning that the traditional sowing window is no longer always suitable. According to records in the Yield Prophet® database, 78% of the 4149 paddocks across Australia between 2008-2015 showed cultivars sown outside of their optimal sowing windows, reducing national wheat and barley yield by an estimated 12% per annum (Flohr et al 2018). Growers therefore require a greater suite of cultivars with a broad range of phenological diversity that can be sown when there are opportunities anywhere from early March to mid-July. These opportunities could involve sowing slow developing winter wheat cultivars early, when stored soil moisture from fallow or early autumn rainfall events allow (Hunt et al 2019), through to sowing fast, vigorous spring types when the rainfall break is late (early to mid-winter). The benefit of early sown winter wheat is the stable flowering time from a wide range of times of sowing (Flohr et al 2018). Breeding explicitly for varying combinations of alleles of the major development genes that govern responses to temperature and day length, into a diverse range of parent material, could also lead to diversity in cultivars to be grown in different environments from a broad range of sowing times, while still ensuring crops flower during the OFP.
There is currently no accurate way to predict flowering time from a wide range of sowing times across the diverse environments of the Australian grain belt, especially at point of release of new cultivars. This is because breeding companies lack the resources or agronomic expertise to conduct experiments across many environments and sowing dates, to define accurate sowing windows for new cultivars. Instead, growers must rely on their own trial and error and agronomist’s advice, which can take multiple seasons to get right.
Recent advances have been made in crop modelling (Brown et al 2013; Zheng et al 2013) and genomics (Wang et al 2014), and molecular markers have been developed to identify alleles of major development genes (Eagles et al 2009). This has created an opportunity to synergise agronomy, genetics and genomics and crop modelling. This project combines these disciplines and aims to improve accuracy in predicting development for current and newly released wheat and barley cultivars across the Australian grain belt from a broad range of sowing times. It will do this by improving and developing parameters of the wheat and barley models in the Agricultural Production Systems sIMulator: Next Generation (APSIM Next Gen; Holzworth et al 2014), which will be informed through phenotypic data from controlled environment experiments, molecular marker information and/or genomic information. Phenology of cultivars will be recorded across eight TOS in Western Australia (WA), South Australia (SA), New South Wales (NSW) and Victoria (VIC)—capturing the full range of early to late times of sowing and diverse environments of the major production areas—and data will be used to validate the model. A preliminary validation of the wheat model is also being conducted on 14 genotypes using field experiment data from previous GRDC investments.
By 2022 a web-based platform will be deployed through the NVT website, running patched point climate datasets from nearby weather stations and the APSIM Next Gen wheat and barley models. This tool will allow growers and advisors to better inform decisions when selecting cultivars and TOS, with the flowering periods being estimated for a range of scenarios (below average, average and above average growing temperatures, etc.). Newly released cultivars will be added as they become available.
Method
Genotype selection
The Australian Phenology Panel (from herein termed ‘the panel’) of 64 wheat (Table 1) and 32 barley (Table 3) genotypes were selected for controlled environment phenotyping and field validation. Of the wheat genotypes, 47 are elite commercial cultivars chosen for their popularity among growers and diversity in phenology expressed in the field. The diversity of phenology is linked largely to the variation in alleles of the major PPD and VRN development genes. As such, each cultivar carries a unique allele combination across the five major genes except for a few cultivars with matching combinations where phenology in the field is different. The other 17 are experimental near-isogenic lines (NILs) bred from a Sunstate background (GRDC project CSP00183) to vary in alleles at the five major gene loci (Steinfort et al 2017). The NILs were selected to match allele combinations with the commercial cultivars where available. An additional four commercial cultivars and a breeding line (Table 2) were included for controlled environment phenotyping, to conduct an initial validation of the wheat model with field data from other current and past GRDC investments.
Table 1. Wheat cultivars selected to the Australian Phenology Panel, their habit, qualitative development speed and, where available, CSIRO Sunstate near-isogenic lines (NILs) with matched alleles at the PPD1 and VRN1 gene loci.
Cultivar | Habit | Qualitative development speed | Matched NIL pair |
|---|---|---|---|
Young | Spring | Very fast | CSIROW077 |
Axe | Spring | Very fast | CSIROW105 |
Emu Rock | Spring | Very fast | |
H45 | Spring | Very fast | |
LRPB Gauntlet | Spring | Fast | CSIROW029 |
LRPB Spitfire | Spring | Fast | Sunstate |
Mace | Spring | Fast | CSIROW005 |
LRPB Catalina | Spring | Fast | CSIROW011 |
EGA Hume | Spring | Fast | CSIROW027 |
LRPB Scout | Spring | Fast | Sunbee |
Wyalkatchem | Spring | Fast | |
Janz | Spring | Fast | |
Peake | Spring | Fast | |
LRPB Crusader | Spring | Fast | |
Suntop | Spring | Fast | |
Ellison | Spring | Mid-fast | CSIROW018 |
LRPB Trojan | Spring | Mid-fast | CSIROW002 |
Grenade CL Plus | Spring | Mid-fast | |
AGT Scythe | Spring | Mid-fast | CSIROW023 |
Merinda | Spring | Mid-fast | |
Scepter | Spring | Mid-fast | CSIROW005 |
Ouyen | Spring | Mid-fast | |
Derrimut | Spring | Mid-fast | |
EGA Wills | Spring | Mid | |
Magenta | Spring | Mid | |
EGA Gregory | Spring | Mid | CSIROW003 |
Cutlass | Spring | Mid | |
Yitpi | Spring | Mid | |
Calingiri | Spring | Mid | |
Mitch | Spring | Mid | CSIROW102 |
LRPB Lancer | Spring | Slow | CSIROW029 |
Braewood | Spring | Slow | |
Bolac | Spring | Slow | |
Strzelecki | Spring | Slow | CSIROW003 |
Beaufort | Spring | Slow | |
Forrest | Spring | Very slow | |
Sunbri | Spring | Very slow | CSIROW087 |
EGA Eaglehawk | Spring | Very slow | |
Kellalac | Spring | Very slow | |
Sunlamb | Spring | Very slow | |
Longsword | Winter | Fast | CSIROW007* |
Whistler | Winter | Fast | |
LRPB Kittyhawk | Winter | Mid | CSIROW021 |
Rosella | Winter | Mid | CSIROW021 |
EGA Wedgetail | Winter | Mid | CSIROW073 |
Manning | Winter | Slow | |
SQP Revenue | Winter | Slow |
*no longer a pair based on most recent genotyping.
Table 2. Additional wheat genotypes selected for initial model validation, their habit and qualitative development speed.
Cultivar | Habit | Qualitative development speed |
|---|---|---|
Condo | Spring | Fast |
LRPB Nighthawk | Spring | Very slow |
Illabo | Winter | Mid-fast |
ADV08.0008 | Winter | Mid |
DS Bennett | Winter | Mid-slow |
Of the 32 barley genotypes (Table 3), 30 are commercial cultivars selected for their diversity in phenology within the Australian germplasm. Two are NILs in a low earliness per se (EPS) background with winter and spring habit. Three additional cultivars have been included for controlled environment phenotyping (Table 4).
Table 3. Barley cultivars selected to the Australian Phenology Panel, their habit and qualitative development speed.
Cultivar | Habit | Qualitative development speed |
|---|---|---|
Biere | Spring | Very fast |
CSIROB3 | Spring | Very fast |
Compass | Spring | Fast |
Grout | Spring | Fast |
Keel | Spring | Fast |
Rosalind | Spring | Fast |
Spartacus CL | Spring | Fast |
Stirling | Spring | Fast |
Fathom | Spring | Mid-fast |
Alestar | Spring | Mid |
Bass | Spring | Mid |
Baudin | Spring | Mid |
Dash | Spring | Mid |
Fleet | Spring | Mid |
Flinders | Spring | Mid |
Granger | Spring | Mid |
RGT Planet | Spring | Mid |
Schooner | Spring | Mid |
Scope | Spring | Mid |
Shepherd | Spring | Mid |
Banks | Spring | Mid-slow |
Commander | Spring | Mid-slow |
Lockyer | Spring | Mid-slow |
Capstan | Spring | Slow |
Franklin | Spring | Slow |
Gairdner | Spring | Slow |
Navigator | Spring | Slow |
Oxford | Spring | Slow |
Westminster | Spring | Slow |
CSIROB1 | Winter | Very fast |
Urambie | Winter | Fast |
Cassiopee | Winter | Slow |
Table 4. Additional barley cultivars, their habit and qualitative development speed.
Cultivar | Habit | Qualitative development speed |
|---|---|---|
Mundah | Spring | Fast |
Unicorn | Spring | Very fast |
Yagan | Spring | Fast |
Controlled environment phenotyping
Two experiments (one wheat, one barley) were designed to phenotype the 69 wheat and 35 barley genotypes. They were grown in eight (four for wheat, four for barley) controlled environment treatments at La Trobe University, Bundoora, VIC. The four controlled environments (as decribed in Bloomfield et al 2018) were selected to completely deprive and/or saturate critical photoperiod and vernalising conditions, as follows;
- short days, not vernalised (SN)
- short days, vernalised (SV)
- long days, not vernalised (LN)
- long days, vernalised (LV).
Each environment was a randomised complete block design with three replicates, randomised in R (R Core Team 2018). Short day photoperiods were eight hours and long days were 17 hours. Artificial lights (a combination of florescent tubes and incandescent bulbs) were used in each controlled environment and produced approximately 300µmol/m2/s at pot height. Seeds of each genotype were pregerminated in petri dishes for 48 hours to break potential dormancy. In non-vernalised treatments, two seeds of each genotype were sown per 90mm olive pot and grown at a constant temperature of 22°C. After one week, they were thinned to one plant per pot. Plants in vernalised treatments were sown in seedling trays and grown in a Thermoline TRHL Series (Thermoline, Wetherill Park, Australia) temperature and humidity-controlled cabinet for eight weeks at 5°C. Photoperiods in the cabinet were also 17 (LV) or eight (SV) hours with artificial light from 8 × 54W T5 lamps producing 160µmol/m2/s. Seedlings of each genotype were then re-potted into 90mm olive pots and transferred to a controlled environment room set at 22°C with short (SV) or long (LV) photoperiods.
Phenotypic data were recorded from emergence to anthesis. Recorded on each plant were emergence date, progressive leaf number as Haun stage (main stem; Haun 1973), final leaf number (main stem), heading dates of wheat (main stem and 50% of culms), awn peep dates of barley (main stem and 50% of culms) and anthesis dates (main stem and 50% of culms). Leaf number was recorded twice per week and plants were monitored daily for final leaf number, heading (wheat), awn peep (barley) and anthesis.
Air and soil temperature were recorded at 30min intervals in each environment using Tinytag Plus 2 model data loggers (Gemini Data Loggers, Chichester, UK) with soil probes attached.
APSIM Next Gen parameters
The simulations are performed on APSIM Next Gen (Holzworth et al 2014) to predict flowering time for wheat and barley cultivars across the Australian grain belt. The model predicts development with the ‘phenology’ component of the Plant Modelling Framework (PMF) developed by Brown et al (2014). For wheat, the phenology component of the PMF advances through a series of phases from sowing though to ripening (see detailed description in Brown et al 2018), while this project focusses on phases from sowing to anthesis. Once a phase reaches a target (enough days above a minimum day length, accumulated vernal time, accumulated thermal time, or a combination of some or all) in one phase, the model will progress to the next. The lengths of phases vary between cultivars. Responses to extremes of photoperiod and vernalisation in the controlled environments determine the main parameters. For example, a winter type must accumulate vernal time (enough cold days over an extended period) to progress from the emergence (vegetative) phase into the stem elongation (reproductive) phase. A spring type with little to no vernalisation requirement will progress based mostly, or entirely, on accumulated thermal time. At present, the barley model uses the same critical temperature values as the wheat model because of their similar responses to thermal accumulation, however this is to be investigated further. The important traits to parameterise a cultivar are progressive, and final, leaf numbers in the four controlled environments.
Field validation
Design
Field experiments were conducted in 2019 and are being repeated in 2020. Five field sites were selected to assess variation in major grain producing environments of Australia. The sites are Wagga Wagga NSW (35.05°S, 147.35°E), Yan Yean VIC (37.54°S, 145.09°E), Callington SA (35.07°S, 139.05°E) and Merredin (31.49°S, 118.21°E) and Dale WA (32.21°S, 116.76°E). The panel was sown at eight times of sowing targeting 1 and 15 March, April, May and June. A partially replicated (p-rep) design (Cullis et al 2006) was used with the eight TOS blocked separately due to experimental constraints — meaning blocking structure is confounded with the TOS treatment. Partial replication was imposed on 90 genotypes (60 wheat and 30 barley), with the remaining six genotypes used as controls. The genotypes Spartacus CL and RGT Planet were the controls for barley, and the genotypes Scepter, LRPB Lancer, Manning and Beaufort were the controls for wheat. Genotypes were not blocked by crop type. Different sets comprising 25% of the cultivars were replicated in each TOS block in order to obtain better overall replication of the genotypes. In total, for the eight TOS blocks, 88% of the cultivars were replicated 10 times and 12% of the cultivars were replicated nine times. The controls were replicated 12 times.
While the replication proportions were consistent for all sites, the layouts differed. At locations Merredin, Callington and Yan Yean, each TOS block comprised 15 columns (ranges) × eight rows, with a complete trial layout of 15 columns × 64 rows. At locations Wagga Wagga and Dale, each TOS block comprised 12 columns (ranges) × 10 rows, with a complete trial layout of 12 columns × 80 rows. Plot size was three rows × approximately 2m with a target density of 50 seeds per linear meter of row. Different randomisations were used for each site and year combination. Row spacing was as per district practice at each site (25cm at Wagga Wagga, 22cm spacing at Merredin and Dale, 22.8cm at Callington and 20cm at Yan Yean). Plots were sown in a north-south direction with 100kg/ha MAP + Flutriafol. Pesticides and fertilizer were applied as needed throughout the season. Earlier times of sowing were irrigated with 25mm of water after sowing to establish the crop, and then kept topped up to Decile 3 of the lowest rainfall site (Merredin).
Experimental conduct
Seed was bulked up and treated with Fluxapyroxad (Systiva®, BASF) and Imidacloprid (Gaucho®, Bayer) by Kalyx (Kalyx, Young, NSW) at the GRDC NVT site near Young, NSW in 2018. Genotypes used in the field experiments in 2019 are as in Table 1 and 3, except that Grout was replaced by RGT Accroc at Wagga Wagga and Callington in 2019.
Sites were monitored twice per week from the first TOS until heading/anthesis was complete in the last plot. Emergence, heading (wheat) and awn peep (barley) were observed on all plots, while leaf number as Haun stage, final leaf number and anthesis were measured on a subset of cultivars (wheat: Axe, Beaufort, Cutlass, EGA Gregory, LRPB Kittyhawk, LRPB Lancer, Mace, Manning, Scepter, LRPB Trojan, Suntop; barley: Commander , Compass, Fathom, RGT Planet, Spartacus CL, Urambie) in TOS one, four and eight. Emergence was recorded on 1m of the centre row of each plot until stable. Heading was recorded on 10 plants in the centre row of all wheat plots until 100% of culms had headed. Awn peep was recorded on 10 plants in the centre row of all barley plots until 100% of culms had awns peeping. Leaf number and final leaf number were recorded on three plants in the centre row outside of the marked 10 plants in the subset mentioned above. Anthesis was recorded on 10 randomly selected heads outside of the marked 10 plants until 10 heads had flowered (yellow anthers extruding or in the floret) in the subset mentioned above. Observations were recorded on the FieldPrime software developed by CSIRO ( Field Prime )
Climate data was logged at all sites on weather stations at 30-minute intervals, measuring air temperature and photosynthetically active radiation at 1.2m, soil temperature at 3cm below ground and leaf temperature in Scepter plots in TOS one, four and eight. Dates and quantities of rainfall and irrigation were recorded at all sites.
Genetics and genomics
All wheat lines were genotyped using high throughput DNA extraction and KASP markers to identify alleles of the major PPD and VRN development genes (outlined in Bloomfield et al 2018). Barley lines have not yet been genotyped. Further analysis with 90K SNP data was conducted (through GRDC project CSP00183 and this project) to identify additional markers important for development. These markers will be utilised to further parameterise the models.
Statistical analyses of controlled environment experiments
Temperature data recorded at 30-minute intervals was used to calculate accumulated thermal time. Two-way analysis of variance (ANOVA) in the GENSTAT 19 software package (VSN International Ltd, Hemel Hempstead, UK) was used to analyse thermal time to flowering assuming a split-plot design with randomised blocks and environment as whole-plot and genotype as subplot.
Preliminary results and discussion
Controlled environment experiments
At present, the 69 wheat genotypes have been phenotyped in all four environments. The 35 barley lines have been fully phenotyped in the LN and LV environments and are currently being phenotyped in the SN and SV environments. Only results from six diverse wheat cultivars will be shown here. As expected, thermal time to flowering varied significantly between genotypes and environments (Figure 1). All genotypes experienced a significant photoperiod response (difference between SV and LV). Very fast spring types (for example, Emu Rock) experienced no significant response to vernalisation (difference between LN and LV). For the mid to slow developing spring types, significant decreases in time to flowering were varied. Some genotypes significantly responded to vernalisation, photoperiod and a combination of the two (for example, LRPB Trojan, Scepter and Beaufort), compared to others (such as LRPB Lancer) which responded significantly to photoperiod but only to vernalisation when photoperiod was short. Winter types (for example, LRPB Kittyhawk) showed a lot of variation in time to flowering in all environments except LV (results not shown). Significant differences in time to flowering between genotypes with matching alleles at the major PPD and VRN gene loci was also observed (results not shown). This warrants the further exploration into genomic and genetic information being carried out to identify other important genes associated with flowering time.
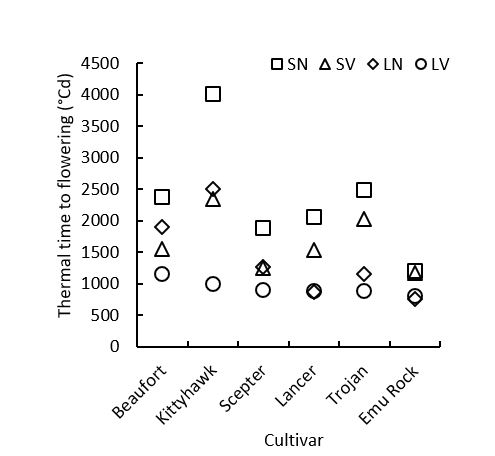
Figure 1. Mean thermal time from emergence to flowering of six wheat genotypes (G) under controlled environment (E) conditions, including; short days, not vernalised (SN); short days, vernalised (SV); long days, not vernalised (LN); and long days, vernalised (LV). Lsd (p = 0.05) = 268 for the two-way interaction between E and G.
Initial model validation
Using only controlled environment phenotypic data to parameterise it, the wheat model has performed well so far in simulating heading and/or flowering date of 47 genotypes used in field experiments in other GRDC investments (results not shown). The model was able to explain 72% of the variation in heading or flowering days after sowing across sowing dates from 14 March to 12 August and 46 sites. In its early stages the model is performing well overall. Estimated heading and flowering times are being simulated accurately for some cultivars, for example; Axe, Derrimut, H45 and LRPB Kittyhawk. However, inaccurate predictions have tended to be from overestimating heading and flowering times, for example; Cutlass, Magenta, Scepter. The model has only underestimated heading and flowering for Longsword, so it is possible that correcting the model for overestimations will remedy the issue for most cultivars. Further model improvements are discussed below.
Field validation and model improvements
One year of climate and phenotypic data from the five sites has now been collated. This will be tested against the model using the controlled environment parameters. Wheat genotypes will be modelled and validated, but barley genotypes cannot be modelled and validated until the controlled environment experiments have concluded.
It is hypothesised that model performance will be enhanced by deriving parameters from genetic and genomic information. Genome wide analyses are identifying new SNP markers important for flowering time and will be able to explain the variation in addition of the major PPD and VRN genes.
Conclusion
The National Phenology Initiative has brought together a multi-organisation and multi-disciplinary team to synergise research agronomy, data science and crop modelling, and genetics and genomics. The initiative aims to improve the accuracy in predicting flowering time of wheat and barley cultivars across the major cropping regions of Australia, including newly released cultivars. It does this by assessing a cultivar’s development in response to combinations of saturating and limiting vernalisation and photoperiod conditions as well as identifying alleles of important genes associated with development and flowering time. This data is used to parameterise the APSIM Next Gen wheat and barley phenology models. Multiple field experiments are being run over two years to capture a wide range of early to late times of sowing and diverse environmental conditions of major cropping environments. Model performance will be validated and improved using phenology data collected from the field trials. So far, an initial model of 47 wheat cultivars has explained 72% of heading and flowering when validated against field experiment data from a range of previous GRDC investments using only controlled environment data to parameterise the model. It is expected that further parameterisation with genetic and genomic information will improve the predicting capability of the APSIM Next Gen phenology models. Once tested and validated, this will be delivered as a web-based tool in 2022 through the NVT for growers and advisors to better inform cultivar × time of sowing decisions. New NVT listings will be added to the tool as they become available.
Acknowledgements
The research undertaken as part of this project is made possible by the significant contributions of growers through both trial cooperation and the support of the GRDC, the authors would like to thank them for their continued support.
Max Bloomfield gratefully acknowledges growers and the GRDC for their financial support through a GRDC Research Scholarship, and La Trobe University for a Research Training Program Scholarship. Thanks also to collaborators for hosting and assisting in trial management, and the FieldPrime team from CSIRO for training and use of the software.
References
Bloomfield, MT, Hunt, JR, Trevaskis, B, Ramm, K, Hyles, J (2018) Ability of alleles of PPD1 and VRN1 genes to predict flowering time in diverse Australian wheat (Triticum aestivum) cultivars in controlled environments. Crop and Pasture Science 69, 1061-1075. https://doi.org/10.1071/CP18102
Brown, H, Huth, N, Holzworth, D (2018) Crop model improvement in APSIM: Using wheat as a case study. European Journal of Agronomy _ Science Direct
Brown, HE, Huth, NI, Holzworth, DP, Teixeira, EI, Zyskowski, RF, Hargreaves, JNG, Moot, DJ (2014) Plant Modelling Framework: Software for building and running crop models on the APSIM platform. Environmental Modelling & Software 62, 385-398. doi:
Brown, HE, Jamieson, PD, Brooking, IR, Moot, DJ, Huth, NI (2013) Integration of molecular and physiological models to explain time of anthesis in wheat. Annals of Botany 112, 1683-1703. doi: 10.1093/aob/mct224
Cai, W, Cowan, T, Thatcher, M (2012) Rainfall reductions over Southern Hemisphere semi-arid regions: the role of subtropical dry zone expansion. Scientific reports
Cullis, BR, Smith, AB, Coombes, NE (2006) On the design of early generation variety trials with correlated data. Journal of Agricultural, Biological, and Environmental Statistics 11, 381. doi: 10.1198/108571106X154443
Eagles, HA, Cane, K, Vallance, N (2009) The flow of alleles of important photoperiod and vernalisation genes through Australian wheat. Crop and Pasture Science_ CSIRO
Flohr, BM, Hunt, JR, Kirkegaard, JA, Evans, JR (2017) Water and temperature stress define the optimal flowering period for wheat in south-eastern Australia__Field Crops Research
Flohr, BM, Hunt, JR, Kirkegaard, JA, Evans, JR, Trevaskis, B, Zwart, A, Swan, A, Fletcher, AL, Rheinheimer, B (2018) Fast winter wheat phenology can stabilise flowering date and maximise grain yield in semi-arid Mediterranean and temperate environments__Field Crops Research
Haun, JR (1973) Visual quantification of wheat development. Agronomy Journal 65, 116-119. doi: 10.2134/agronj1973.00021962006500010035x
Holzworth, DP, Huth, NI, deVoil, PG, Zurcher, EJ, Herrmann, NI, McLean, G, Chenu, K, van Oosterom, EJ, Snow, V, Murphy, C, Moore, AD, Brown, H, Whish, JPM, Verrall, S, Fainges, J, Bell, LW, Peake, AS, Poulton, PL, Hochman, Z, Thorburn, PJ, Gaydon, DS, Dalgliesh, NP, Rodriguez, D, Cox, H, Chapman, S, Doherty, A, Teixeira, E, Sharp, J, Cichota, R, Vogeler, I, Li, FY, Wang, E, Hammer, GL, Robertson, MJ, Dimes, JP, Whitbread, AM, Hunt, J, van Rees, H, McClelland, T, Carberry, PS, Hargreaves, JNG, MacLeod, N, McDonald, C, Harsdorf, J, Wedgwood, S, Keating, BA (2014) APSIM –
Evolution towards a new generation of agricultural systems simulation. Environmental Modelling & Software _ Science Direct
Hunt, JR, Lilley, JM, Trevaskis, B, Flohr, BM, Peake, A, Fletcher, A, Zwart, AB, Gobbett, D, Kirkegaard, JA (2019) Early sowing systems can boost Australian wheat yields despite recent climate change. Nature Climate Change 9, 244-247. doi: 10.1038/s41558-019-0417-9
Liu, K, Harrison, MT, Hunt, J, Angessa, TT, Meinke, H, Li, C, Tian, X, Zhou, M (2020) Identifying optimal sowing and flowering periods for barley in Australia: a modelling approach__Agricultural and Forest Meteorology
Porter, JR, Gawith, M (1999) Temperatures and the growth and development of wheat: a review. European Journal of Agronomy - Science Direct
R Core Team (2018) 'R: A language and environment for statistical computing.' (R Foundation for Statistical Computing: Vienna, Austria)
Scarth, R, Law, CN (1984) The control of the day-length response in wheat by the group 2 chromosomes. Zeitschrift für Pflanzenzüchtung 92, 140-150.
Steinfort, U, Trevaskis, B, Fukai, S, Bell, KL, Dreccer, MF (2017) Vernalisation and photoperiod sensitivity in wheat: Impact on canopy development and yield components. Field Crops Research - Science Direct
Trevaskis, B, Bagnall, DJ, Ellis, MH, Peacock, WJ, Dennis, ES (2003) MADS box genes control vernalization-induced flowering in cereals. Proceedings of the National Academy of Sciences 100, 13099-13104. doi: 10.1073/pnas.1635053100
Wang, S, Wong, D, Forrest, K, Allen, A, Chao, S, Huang, BE, Maccaferri, M, Salvi, S, Milner, SG, Cattivelli, L, Mastrangelo, AM, Whan, A, Stephen, S, Barker, G, Wieseke, R, Plieske, J, International Wheat Genome Sequencing Consortium, Lillemo, M, Mather, D, Appels, R, Dolferus, R, Brown-Guedira, G, Korol, A, Akhunova, AR, Feuillet, C, Salse, J, Morgante, M, Pozniak, C, Luo, MC, Dvorak, J, Morell, M, Dubcovsky, J, Ganal, M, Tuberosa, R, Lawley, C, Mikoulitch, I, Cavanagh, C, Edwards, KJ, Hayden, M, Akhunov, E (2014) Characterization of polyploid wheat genomic diversity using a high-density 90,000 single nucleotide polymorphism array. Plant Biotechnol J 12, 787-96. doi: 10.1111/pbi.12183
Zheng, B, Biddulph, B, Li, D, Kuchel, H, Chapman, S (2013) Quantification of the effects of VRN1 and Ppd-D1 to predict spring wheat (Triticum aestivum) heading time across diverse environments. Journal of Experimental Botany 64, 3747-3761. doi: 10.1093/jxb/ert209
Contact details
Maxwell (Max) Bloomfield
Department of Animal, Plant and Soil Sciences, La Trobe University
Bundoora VIC 3086
0421 233 202
M.Bloomfield@latrobe.edu.au
@Blooming_fields
GRDC Project Code: 9175445,
Was this page helpful?
YOUR FEEDBACK