Quantification of frost damage in grains using remote sensing
Take home messages
- Frost damage can be detected through sensing but cultivar, plant component, canopy structure and time after frost affects the spectra. Consequently, there are some approaches that look promising but there is currently no unique index that can consistently detect frost damage.
- Temperature variation within canopies due to canopy architecture, plant components and cultivar type causes spectra of frost damage to vary, making quantifying frost damage challenging.
- It appears likely that frost damage can be detected before the onset of visual symptoms, but it is unclear whether this is a relative measure or whether frost severity can be quantified.
- Quantifying frost damage requires comparison to a reference or control area of a paddock where little to no frost damage has occurred.
- Mapping frost damage for the purposes of cutting hay may be feasible but these techniques require field validation.
Background
Recent statistics for frost related damage in Australia estimated agricultural losses at $360 million each year (Rebbeck et al. 2007; March et al. 2015). Frosts that occur in wheat during or after ear-emergence can often result in severe stem and head damage, which can reduce grain yields and quality by up to 80%, depending on location, altitude, soil type and the severity of the frost. Wheat is particularly vulnerable to frost in the period between heading and grain-fill. Other than visually assessing a crop five to ten days after a frost event, there are no tools available to determine if frost damage has occurred or to map its extent across paddocks. Farmers would benefit greatly if they could obtain near real time information about the spatial extent of frost damage in paddocks that are likely to have yield losses. This knowledge would then enable decisions on when and how much of the crop to cut for hay. Maps of frost damaged areas of the paddock would also help farmers at harvest time as frosted areas of the paddock could be selectively harvested or left unharvested if necessary.
As part of the GRDC National Frost Initiative, a Rapid Frost Damage Assessment program was developed to investigate the application of a range of different sensors for the rapid detection of frost damage in wheat. Optical and thermal sensing systems are now being widely developed to measure crop response to abiotic and biotic stresses. These systems, coupled with recent advances in satellite and unmanned aerial vehicle (UAV)/drone technology, means that new opportunities exist for developing techniques to quickly map frost-damage in crops. Remote sensing tools for the rapid spatial quantification of frost damage could help Australian growers (and their advisers) to spatially, understand the impact of frost on yield. Before this research, it was not known whether frost damage in crops could be detected using sensors and/or whether it could be mapped.
The major questions asked in this research were:
- Can frost damage be detected and, if so, can impacts to yield be quantified?
- How soon after a frost event can frost damage be detected?
- What is the potential to map frost damage to provide information for cutting hay?
Methods
Frost exclusion – passive and active methods
Before being able to determine whether frost damage can be quantified either with temperature or a spectral response, it was necessary to develop methods to exclude frost so that an experimental control could be established. Without a control there is no definitive way to determine whether crop damage is due to frost or something else and there is no way to compare data from damaged and non-damaged plants. The two methods developed were: 1) exclusion chambers and 2) active heating.
Several exclusion chamber designs were tested with the final version (1m2 frame made of 40mm PVC pipe with a double skin consisting of 10 layers of 23μm plastic wrap) shown in Figure 1. By erecting the shelter on a clear afternoon about 90 to 120min before sunset, the chamber was able to maintain internal temperatures above 0°C when ambient canopy temperature dropped to -4.0 to -4.5°C during the night. The multiple layers of plastic wrap provided air spaces that insulated the space in the chamber. It was noted that after five to seven days of plants being protected by the chamber there was a chamber-induced effect on plant growth, even when the chambers were removed during the day. Consequently, the use of passive chambers is limited.
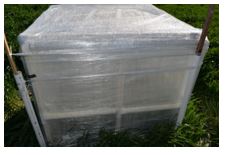
Figure 1. Frost exclusion chamber (photo by Mick Faulkner).
The second method used to exclude frost was through active heating at night during frost events to maintain temperatures just above freezing using a generator and a diesel caravan air heater with air piped through a PVC manifold (Figure 2). The automated system that was developed could be deployed at multiple locations within a research or paddock setting to provide a control area so that frosted areas could be compared with control areas and damage accurately assessed. This also alleviated the tedious task of placing chambers at night before an expected frost event.
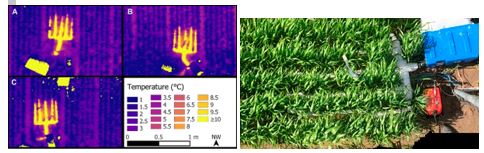
Figure 2. (left) Thermal image of the plot heater effect acquired from a UAV and (right) Close-up picture of diesel plot heater (Stutsel et al., 2019b).
Frost-imposition chambers were also developed to allow control of the timing and severity of frost for research and this is described in the companion paper in these proceedings (Nuttall et al., 2020).
Quantifying Frost Exposure
Measuring canopy temperatures
Low temperatures from a standard weather station are typically used to assess when a frost event might occur. It has been noted however, that temperatures within a canopy can be colder than those recorded at the 1.2m standard height of a weather station. Temperatures in this study were recorded at canopy height (upper most flag leaf) and these were used to calculate cold sums (Nuttall et al., 2020) to develop relationships to yield. Tiny tags were placed in the different experiments to record temperature at canopy/head height.
Spatial distribution of temperature
A fibre optic Distributed Temperature Sensing (DTS) was used to measure temperatures at the field scale, rather than the traditional point scale to determine the vertical and horizontal temperature distribution in the canopy (Stutsel et al., 2019a; Figure 3). The aim of using this technology was to identify where and when minimum temperatures developed within the crop.
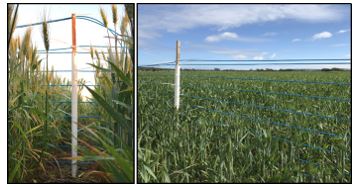
Figure 3. Distributed Temperature Sensing (DTS) fence. (left) Fence support pole. (right) DTS fence at the trial site (cables).
Non-destructive frost detection – temperature
To understand canopy temperature dynamics, sensors were deployed in the field as infrared thermometers (Figure 4) looking at the crop canopy across the experimental plots. This provided information that could be used to validate aerial temperature data and basic crop physiological measurement of damage to transpiration due to frost.
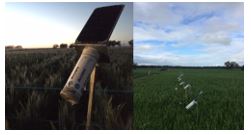
Figure 4. Infrared thermometers (Arducrop) that were used to measure canopy temperatures.
Non-destructive frost detection – spectral reflectance
Multispectral images were acquired from UAVs and proximal hyperspectral sensor measurements (350 - 2500nm, FieldSpec FR, Analytical Spectral Devices, Boulder, CO, USA) were also collected at ground level to assess spectral response to frost. Spectral data included sensor and imagery from the control chambers (removed from the crop) and frost-affected areas of plots or transects within paddock, depending on location, year and experiment. In addition, spectral data were collected in a laboratory experiment using an imaging spectrometer on frosted (Fr) and non-frosted (NFr) wheat heads and leaves (Murphy et al., submitted) and regions of significant differences were determined between 392-889nm.
Handheld spectral measurements were collected using a PolypenTM (Photon Systems Instruments, Drasov Czech Republic, 324-792nm) on leaves, heads and grains to determine its utility for use in frost detection. This is a relatively new tool that could be used by farmers or agronomists for assessment of abiotic stress damage to plant components.
Spectral mixture analysis
One of the main difficulties of using spectral information for detection of frost (and other stresses) is that the spectral signal is ‘mixed’ with other spectra from the canopy; such as heads, green leaves, senescent leaves, soil background and even shade. Thus a ‘spectral mixture analysis’ was used to ‘unmix’ the spectra using spectral libraries composed of other canopy spectra (Fitzgerald et al., 2019). The technique compares the mixed spectra to the library and estimates the fraction of the target signal (frost, in this case) in the mixed signal. When the frost fraction is compared to yield, a relationship can be developed to estimate severity of frost to yield loss.
Fluorometer
An active fluorometer (Multiplex 3.6, Force A, Orsay Cedex, France) (Figure 5) was used on wheat canopies and individual plant components (heads and leaves) to assess subtle difference in fluorescence emissions that could be related to frost exposure.
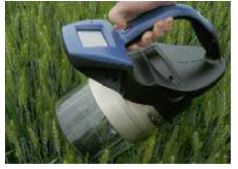
Figure 5. Multiplex fluorometer collecting measurements in wheat.
Results and discussion
Determining whether frost can be detected with sensors
Temperature and thermal imagery
Research in this program demonstrated the first application of DTS within an active trial environment, providing a new method to measure and understand temperature dynamics across trial sites. Results showed that even in mild frost events vertical temperature gradients of 0.24°C per 100mm height develop within wheat crops, with the coldest temperatures developing ~100 to 200 mm below the top of the ear. We also showed that there was a varietal influence on cold temperature development that was most likely driven by differences in height, canopy density and closure. Finally, there was greater variation in temperature within a sowing block than between blocks and that trial design and subsequent variety randomisation may impact the development of cold temperature more than topographic or soil differences. This information should lead to more confidence in results from frost trials and reduce instances of falsely identifying plants as being more frost-resistant when they may merely experience less severe cold.
Lightweight thermal cameras on UAVs are not stabilised to a constant temperature, resulting in poor accuracy. Weather data is also needed to normalise and compare across flights, likely making it an impractical method for commercial growers to detect frost in the near future. Infrared sensors (Fig. 5) provide good ground-level data to calibrate aerial imagery in a research context but they may not be practical to deploy in a paddock as many would be required to cover a paddock or farm.
Spectral measurements
Abiotic stresses, such as frost, can be detected with sensors and imagers but using spectral information to detect frost damage in crops had not been an active area of research before this research program. Once a frost event occurs, there are physiological changes to plants, including damage to photosynthetic processes and physical damage to tissues which can potentially manifest as changes in plant colour detected using spectral sensors.
To identify spectral regions that could indicate frost damage in wheat, spectra were collected from positively-identified Fr and Nfr wheat canopies in two seasons; 2006 and 2015. To clarify the differences, a normalisation of the data was performed, which helped identify eight spectral absorption regions (noted as ‘dips’ in the spectra, Figure 6a, shaded areas (1-8)). Taking the difference between the normalised NFr and Fr spectra from each data set (Figure 6b) determined where there were similarities and differences between the two years within each of the absorption regions identified in Figure 6a. Maximum differences are noted as higher values along the horizontal x-axis; and areas where there are peaks denote where the relationship changes. Maximum values, peaks and where there are similarities between the two years, show potential spectral regions for detecting frost damage (shaded areas, Figure 6b).
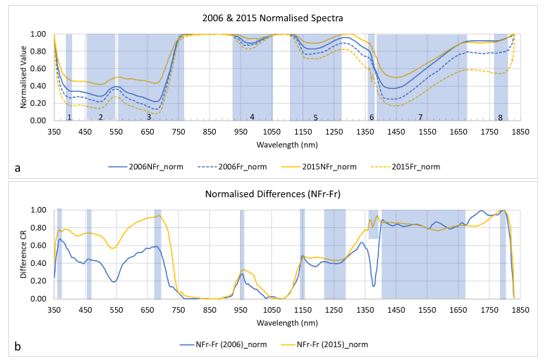
Figure 6. Spectra of wheat canopy in visible to near infrared portion of the spectrum. Two years and locations (2006, Horsham; 2015, Kewell, Victoria). (a) Spectra normalised and identification of spectral absorption regions (1-8, shaded) with differences between Fr and NFr. (b) Difference of normalised spectra (NFr - Fr) showing regions (shaded area) with potential to identify frost damage in wheat.
In a laboratory experiment where wheat heads and leaves were imaged using a hyperspectral imager (Murphy et al., submitted) it was shown that spectral responses differed between frost damaged heads and leaves, but there were spectral regions in common. From both laboratory and field studies, the regions in common for detection of frost damage across canopy, leaves and heads were 419-494nm and 670-675nm. Areas outside the range of the laboratory analysis include those identified in Figure 6b (shaded region). Those areas where data from multiple years overlap show potential to detect frost across a range of conditions. Wide regions showing similarity between the sites may indicate relatively stable regions in the infrared (for example approximately 1220-1270nm and approximately 1400-1670nm) while reflectance values near 1800nm (Figure 6b) showed the highest difference between Fr and NFr across both years. The visible portion of the spectrum (400-700nm), although indicating similar spectral shapes between the two years, show distinct differences between the plotted lines (Figure 6b). Because photosynthesis is affected by frost (noted by the differences in Figure 6b near 450 and 670nm, where chlorophyll absorbs energy) and this changes due to many factors, it is possible that the near infrared is a more stable region of the spectrum and is more suited for frost damage detection across environmental conditions and varieties.
Spectral measurements of wheat heads
Hyperspectral measurements were taken on wheat heads subjected to frost under controlled conditions using a handheld Polypen™ (Figure 7). Results showed that there were spectral changes in frost-affected heads even one day after a frost event (Figure 7a) but the difference in spectra (NFr - Fr) at one, three, four and six days (Figure 7b) after frost showed that the spectra changed depending when measurements were made. Although this indicates potential for a handheld device to measure frost damage in wheat heads before visual symptoms appear, this assessment may be limited to a qualitative assessment of frost damage because of spectral changes over time. The spectral differences appear to be due to changes in plant physiology after a frost.
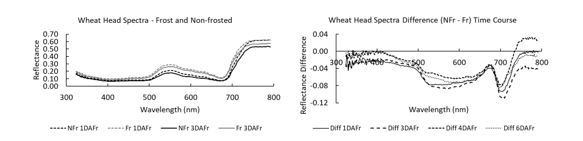
Figure 7. Spectra of wheat heads, cv Wyalkatchem collected with a Polypen™. (a) One and three days after frost (DAFr) for non-frost (NFr) and frost-damaged (Fr) heads. (b) Difference between NFr and Fr heads one, three, four and six DAFr. This shows that spectra change depending on time after the frost event.
Quantifying frost damage
As noted previously, it may be challenging to quantify the effects of frost on yield due to spectral changes after a frost, differences between varieties and varying temperature impacts to the canopy. However, if a method could be developed to measure the severity of frost damage and its impact on yield then spectral information could be used to quantitatively map frost after a frost event, allowing farmers to make decisions to cut for hay based on yield loss information. One approach that could be useful is the use of the information in the spectra to quantify yield impacts.
One full-spectrum analysis method is ‘spectral mixture analysis’. This method was used to estimate yield measured from the sampled areas (Figure 8). By comparing the measured spectrum of points where yield was collected to a library of spectral components (Figures 8a, b), the measured spectrum can be ‘unmixed’, resulting in a measure of the proportion of frost damage represented by a fraction of frost damage (Fr fraction). Here, yield was plotted against the Fr fraction (measure of frost severity) for three data sets (Figure 8c) collected at or near anthesis. Results showed that there is a frost spectral signature that can estimate yield (R2 values from 0.58 to 0.75) within an acceptable degree of accuracy (Root mean square error (RMSE) ranged from 0.11 to 0.46t/ha) but the relationships for each data set were different. As noted previously, this could be due to differences between time after frost, cultivar or other factors. Thus, there is still more research needed to understand and measure the factors that cause frost damage and to robustly estimate yield loss.
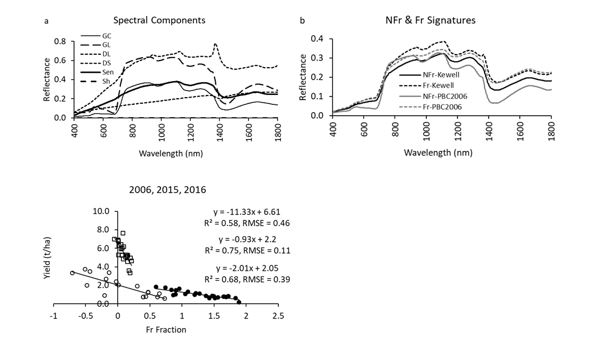
Figure 8. (a) Spectral signatures for canopy components, and (b) frost (Fr) and non-frost (NFr) canopies. (c) Frost (Fr) fraction values vs yield for three data sets using a spectral mixture analysis approach to determining frost severity and impacts to yield.
Discussion of a multispectral approach is presented in the companion paper in these proceedings, (Nuttall et al., 2020).
Fluorescence
Good correlations were found between some of the fluorescence indices tested and yield (Figure 9; Perry et al. 2017) or cold sums (Nuttall et al. 2018) across different experiments. The fluorescence values tracked yield across a transect in one experiment (Figure 9) and had high correlation to cold sums (r = -0.83) in another when measured on both flag leaves and heads. Advantages of this technology is that with its active light source, it can make measurements independently of sky conditions. However, the instrument is only effective when in direct contact with the plant component (leaves, heads), limiting its use to handheld measurements. Future applications may be use of fluorescence as a frost damage validation tool for crop heads or leaves.
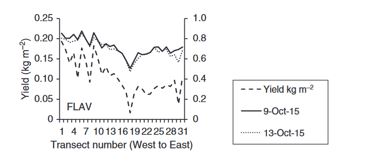
Figure 9. Corresponding grain yield and fluorometer measurements from a paddock near Kewell, Victoria in 2015 following the first observation of frost. The measurements were made along a transect of 31 rows on two dates, 9 October 2015 and 13 October 2015 (growth stages; Z61–69, Z71–75). Correlation coefficients were 0.91 and 0.90 for the two dates (Source: Figure revised from Perry et al. 2017).
Conclusions
Frost damage can be detected through sensing but cultivar, plant component, canopy structure and time after frost affect the spectral indices so that there are some approaches that look promising but currently no unique index that can consistently detect frost damage.
It appears likely that frost can be detected before onset of visual symptoms but whether this is a qualitative or quantitative assessment is still unclear.
Fluorescence seems a promising technology for frost detection but it requires direct contact with the canopy.
The most stable parts of the spectrum for a frost damage signal may be in spectral regions that cannot be currently detected by most commercially available sensors.
Non-frost damaged controls are required for research experiments.
Temperatures with frost research experiments may be more variable within experimental units than between, suggesting careful design of frost experiments is needed.
Currently there are too many technical challenges for accurate measures of crop temperature, and therefore, measuring frost damage with thermal imaging from UAVs is currently not feasible.
Mapping frost damage for the purpose of cutting hay may be feasible but these techniques still require field validation.
Acknowledgements
The research undertaken as part of this project is made possible by the significant contributions of growers through both trial cooperation and the support of the GRDC, the authors would like to thank them for their continued support. Other support was provided by Agriculture Victoria/ Department of Jobs, Precincts and Regions and co-author, Bonny M Stutsel, was supported by an Australia Government Research Training Program (RTP) award and a GRDC PhD top-up award.
References
Fitzgerald GJ, Perry EM, Flower KC, Callow JN, Boruff B, Delahunty A, Wallace A, Nuttall J (2019) Frost damage assessment in wheat using spectral mixture analysis. Remote Sensing, 11, 2476.
March, T., Knights, S., Biddulph, B., Ogbonnaya, F., Maccallum, R. and Belford, R.K., 2015: The GRDC National frost initiative, GRDC update papers.Murphy, ME, Flower, K, Callow, N, Boruff, B (2019) Detecting Frost Stress in Wheat: a hyperspectral approach to infer multispectral usefulness. Remote Sensing (submitted).
Murphy, ME, Flower, K, Callow, N, Boruff, B (2019) Detecting Frost Stress in Wheat: a hyperspectral approach to infer multispectral usefulness. Remote Sensing (submitted).
Nuttall, JG, Perry, EM, Delahunty, AJ, O'Leary, GJ, Barlow, KM, Wallace, AJ (2018) Frost response in wheat and early detection using proximal sensors. Journal of Agronomy and Crop Science 205, 220-234.
Perry, EM, Nuttall, JG, Wallace, AJ, Fitzgerald, GJ (2017) In-field methods for rapid detection of frost damage in Australian dryland wheat during the reproductive and grain-filling phase. Crop and Pasture Science 68, 516-526.
Perry, EM, Delahunty, AJ, Nuttall, JG, Clancy, A, Wallace, A (2019) Frost response in lentil. Part 2. detecting early frost damage using proximal sensing. 19th Australian Agronomy Conference, Wagga Wagga NSW 25-29th August 2019.
Rebbeck, M. A., Knell, G.R., Hayman, P.T., Lynch, C.W., Alexander, B.M., Faulkner, M., Gusta, L.V., Duffield, T.K., Curtin, S. and Falconer, D., 2007: Managing Frost Risk - A guide for southern Australian Grains. In: D. Reuter ed. South Australian Research and Development Institute and Grains Research and Development Corporation, Canberra, ACT.
Stutsel, B. Temperature Dynamics in Wheat (Triticum Aestivum) Canopies during Frost; The University of Western Australia: Perth, Australia, 2019a.
Stutsel, BM, Callow, JN, Flower, K, Ben Biddulph, T, Cohen, B, Leske, B (2019b) An automated plot heater for field frost research in cereals. Agronomy, 2019, 9, 96; An Automated Plot Heater for Field Frost Research in Cereals - MDPI
Contact details
Dr Glenn Fitzgerald
110 Natimuk Rd
Horsham, VIC 3400
03 4344 3145
glenn.fitzgerald@agriculture.vic.gov.au
GRDC Project Code: CSP00198,
Was this page helpful?
YOUR FEEDBACK