Rapid detection of frost damage in wheat using remote sensing
Take home messages
- Applying a single frost to wheat at flowering reduced yield by 7% for every degree below zero (up to -4°C), however, this increased to a reduction by 12% for every degree below zero when applied over two consecutive nights (up to -3°C).
- Remote sensing spectral indices including normalised difference vegetation index (NDVI), normalised difference red edge (NDRE) and photochemical response index (PRI) showed significant relationships with cold load applied to wheat, however, to date no universal index for frost damage using remote sensing has been identified.
- Similar utility of these three spectral indices were observed for a survey of six commercial wheat paddocks in 2018 near Murtoa, Victoria, suggesting an opportunity for spatial management of crops when considering hay versus grain production.
Background
Frost can significantly reduce production of field crops grown in Mediterranean-type environments, where economic losses for Australian wheat is estimated at up to $360 million per year in Australia (Rebbeck et al. 2007; Watt 2013; March et al. 2015). Frost risk is predominantly managed through avoidance measures, by manipulating flowering time to avoid periods of high frost risk. However, such tactics must be assessed against the potential for heat stress and drought associated with later flowering dates. If non-destructive proximal or remote sensing technologies could make rapid, spatial assessment of frost damage (Perry et al. 2017) this could limit economic losses through timely management decisions such as zoning for crops to be cut for hay, prioritising further crop inputs, altered grain marketing strategies and improved planning of harvest logistics. While the companion paper in these proceedings (Fitzgerald et al., 2020) presents methods for frost exclusion and fundamental spectral response to frost, this paper reports on: i) the response of wheat to imposed artificial frost treatments using purpose built mobile chambers, ii) the identification of remote sensing indices linked with frost affected wheat, and iii) the utility of these proposed indices for spatial mapping of frost damage in wheat at paddock scale. Overall, the objective of this work was to investigate the ability to utilise remote sensing technologies to manage in-season frost damage in wheat.
Method
i) Wheat response to frost
Mobile frost chambers were used to examine the impact of simulated frost applied at night on wheat yield, a detailed methodology is outlined in Nuttall et al. 2018. Briefly, temperatures below 0°C were applied to wheat at head emergence and flowering in a field experiment at Horsham, Victoria during 2016. Dry ice was applied to cool the chamber in a similar pattern to a natural frost with temperature monitored at canopy level in each chamber. For the treatments at flowering, minimum temperature ranged from ‑1 to -3°C with frost applied either as a single night or on two consecutive nights. For the head emergence treatments, these were more severe, with temperatures down to ‑9°C and were applied as either single, double or triple night series. Severity of frost was calculated based on a combination of both the temperature below 0°C and the time spent below 0°C, also known as ‘cold load’ and measured in ‘degree hours below zero’.
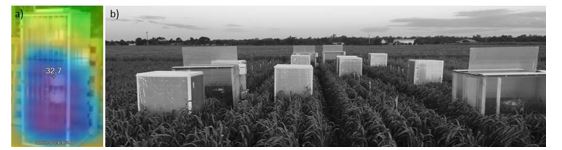
Figure 1. Frost chambers a) Performance testing using visual infrared thermometer, Fluke VT02 (temperature at 32.7°F (0°C)) and b) Simulated frost being applied to wheat to determine impact on yield and ultimately the link between frost induced sterility and proximal sensor response.
ii) Identifying remote sensing indices for frost damage
A range of electronic sensors were tested for their ability to identify frost affected wheat by capturing images of the crop on the day after and eight to ten days after frost application. The sensors work by measuring the light reflected off the crop canopy including; visible light (wavelengths from 400‑700nm) as well as ultra-violet and infra-red wavelengths that are not visible to the human eye. Images were captured at various heights above the canopy and in some cases focussed on different parts of the canopy (heads, leaves, etc.). The imagery was then used to calculate a range of ‘indices’ which compare the light reflected at different wavelengths to give an indication of various physical and chemical characteristics of the crop. Examples include the NDVI, as well as others such as the canopy chlorophyll concentration index (CCCI), cellulose absorption index (CAI), chlorophyll index red-edge (CI), enhanced vegetation index (EVI), modified chlorophyll absorption reflectance index (MCARI), NDRE, PRI, plant senescence reflectance index (PSRI), structure insensitive pigment index (SIPI), triangular greenness index and water index (WI). The aim was to test a wide range of indices and their correlation with canopy cold load and frost damage in wheat.
iii) Paddock application of remote sensing to detect frost damage in wheat
Commercial wheat paddocks situated in a frost prone region near Murtoa, Victoria (36.620°S, 142.471°E, 139m above sea level) were monitored for frost damage in 2018. Six survey points were established in each paddock at 150m intervals along a linear transect running through the centre of the paddock, picking up the maximum variation in intra-paddock relief and likely frost severity. For monitoring crop canopy temperature, thermistors were installed at canopy (crop head) height throughout the season with sensor height adjusted as the canopy grew taller. At each site, a Stevenson screen containing a temperature logger was also installed 1.2m above the ground level, consistent with the protocol used by the Australian Bureau of Meteorology for measuring air temperature.
A six-band multispectral camera (Airphen®, Hiphen, Avignon, France) capturing light at 450, 530, 675, 730 and 850nm wavelengths, was flown over the six survey paddocks on 1 Oct 2018 using a manned, fixed wing aircraft. The imagery was acquired at approximately 9000 feet above ground level (AGL) in order to capture each paddock entirely within a single image, resulting in a spatial resolution of approximately 1m. The light reflectance spectrum (six bands) for each of the survey points were extracted from the spatial paddock images. These reflectance values were then used to compute the subset of vegetation indices; NDRE, NDVI and PRI. At each survey point, biomass cuts (25m2 per point) were taken at harvest for yield and quality analysis. Collectively, vegetation indices were compared with measured crop canopy load and yield across the six intra-paddock survey points for the six paddocks.
Results and discussion
i) Wheat response to frost
Simulated frost treatments
The frost chambers effectively reduced canopy temperature of wheat to below zero degrees. The simulated frosts were characterised by a rate of cooling of 2°C per hour with a duration below zero degrees of around eight hours applied during the night. For flowering frost treatments, average minimum temperatures ranged from -2.2 to -3.4°C (when applied as a single frost at each growth stage) resulting in a cold sum of 8.6 to 11.8°C.hr (< 0°C). For the treatments where frost was applied over two consecutive nights, average minimum treatment temperatures ranged from -1.4 to -2.6°C the first night and from -1.0 to -1.6°C the second night. The corresponding range in cold sum, totals over the two nights was 5.0 to 12.9°C.hr (< 0°C). For the head emergence treatments, cold loads applied over three nights were up to 161°C.hr (< 0°C) and were severe enough to cause 100% yield loss.
Cold load and crop response
For wheat grown under open ambient temperature, in the absence of naturally occurring frost (or heat wave) events during the growing season, grain-set and yield was 15890 grains per m2 and 6.8t/ha respectively (Figure 2). Applying frost over a single night resulted in an 8.8 and 7.2% reduction in grain number and yield respectively, per degree Celsius below zero up to -4°C (Figure 2a). For those frost treatments applied over two nights, the reduction in grain number and yield increased to 15.7 and 11.8% respectively, per degree Celsius below zero up to -3°C, indicating a cumulative effect of multiple frosts. To account for both frost duration and severity, cold load was compared with yield. The response of wheat was a 2.2% reduction in grain number per °C.hr (below 0°C), which translated to a yield reduction of 1.9% per °C.hr (Figure 2b).
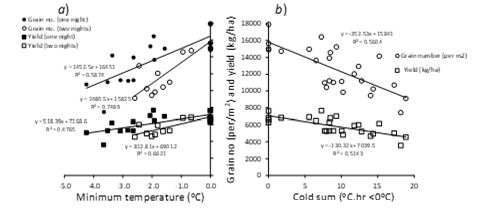
Figure 2. Relationship between wheat yield components and a) minimum temperature and b) cold sum (°C.hr < 0°C) for frost treatments.
ii) Identifying remote sensing indices for frost damage
For the 11 indices derived from reflectance of wheat (flag leaf, head and canopy), PRI, NDVI and NDRE demonstrated significant linear relationships with frost intensity for treatments (head emergence) that were in excess of 20°C.hr <0°C (or minimum temperatures of -6.6 to -9.6°C), although the relationship was poor following frosts treatments at flowering with intensities less than 20°C.hr (Nuttall et al. 2018). This was possibly related to the limited range in cold load for the flowering treatments and any subtle impacts to crops not being detectable. Importantly, PRI showed greatest utility in its consistent relationship across both the head emergence and flowering frost treatments (Figure 3). For NDVI, although a high correlation existed for frost applied at head emergence, the anthesis response fell below the regression line compared with the earlier heading measurements, highlighting the confounding effect of senescence associated with advancing crop growth stage, on NDVI.
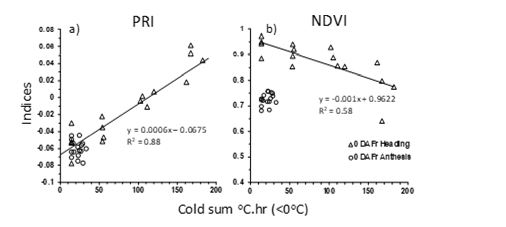
Figure 3. Reflectance derived spectral indices photochemical response index (PRI) and normalised difference vegetation index (NDVI) from wheat heads the day after frost (DAFr) treatments, applied at varying intensities and expressed as cold sums. Frost treatments were applied at the crop stages; head emergence and flowering.
iii) Paddock application of remote sensing to detect frost damage in wheat
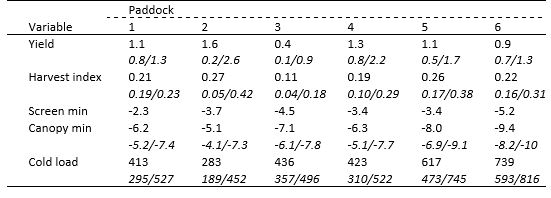
For the six wheat paddocks surveyed in 2018, which was a decile 2 growing season, paddock averages for yield ranged from 0.4 to 1.6t/ha and ranged up to 0.2 to 2.6t/ha within any single paddock (Table 1). For the period between 15 August and 30 September there were approximately 30 nights where canopy temperatures were below 0°C, this period typically coinciding with growth stages of early stem elongation to flowering. These rolling frost events culminated in total cold load (paddock average) for this period ranging from 283 to 739 °C.hr < 0°C. Within each paddock, cold load varied substantially; in some cases, varying from 189 to 452°C.hr < 0°C across the six survey points.
Table 1. Wheat yield (t/ha), minimum temperature (°C) (screen at 1.2m and crop canopy) and cold load (°C.hr < 0°C) for six commercial paddocks in 2018, Murtoa, Victoria. Intra-paddock range in values is defined in italics, which represent six points along a 750 metre transect. Minimum temperature and cold load are for the period between 15 August and 30 September.
Good agreement existed between intra-paddock cold load and yield, for four of the six paddocks surveyed, where there was a negative relationship for paddocks 2, 3, 4 and 5 (Figure 4). For paddock 2, the large yield range and strong negative correlation with cold load is likely linked with the substantial variation in topography across this paddock. In this case, changes in topography were associated with substantial changes in soil type; resulting in co-location of high cold loads with heavy soil types causing greater water stress in a year when growing season rainfall was decile 3. This co-location made it difficult to separate water stress from frost effects. Irrespective of this observation, a good agreement between yield and cold load was demonstrated in paddock 5, where the terrain was flat. For paddocks where there was no apparent link between yield and cold load, it would be expected that factors other than canopy temperature (and/or soil type variation associated with topography) are having an overriding effect on yield e.g. pest and disease.
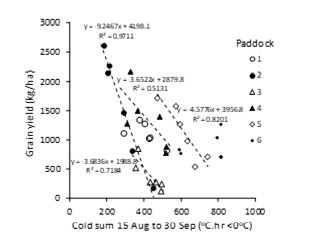
Figure 4. Intra-paddock relationship between wheat yield (kg/ha) and cold load (°C.hr <0°C) for six commercial paddocks in 2018, Murtoa, Victoria. Regression models describing intra-paddock fit between yield and cold load are for paddocks 2, 3, 4 and 5.
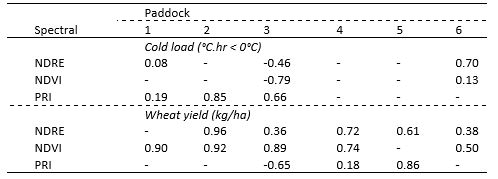
For paddocks 2, 3, 4 and 5, where yield and canopy cold load were correlated, there was also reasonable agreement with the reflectance indices NDRE, NDVI and PRI, these being correlated with both canopy cold load and crop yield (Table 2). For these paddocks, NDRE and NDVI were consistently negatively correlated with cold load and generally positively correlated with yield. For PRI, this relationship was less stable across paddocks when comparing cold load and yield. PRI has previously been shown to be positively correlated with cold load and negatively related to yield (Nuttall et al. 2018). The reverse pattern of PRI for paddock 5 may be due to artefact effects of previous seasons; canola stubble confounding reflectance in wave bands associated with PRI calculation, highlighting the need for ground truthing remotely sensed spatial information.
Table 2. Cold load, crop yield and crop spectral reflectance. Correlation (r) for reflectance-derived spectral indices taken from wheat canopies at around flowering and total cold load (°C.hr < 0°C) measured at the crop canopy between 15 August and 30 September, and wheat yield. Reflectance readings were taken on the 1 October using an Airphen® multispectral camera.
Using paddock 2 as a more detailed case study, since in this paddock there was the most consistent agreement between crop growth, cold load and indices. For this paddock, wheat yield was strongly correlated with NDRE (Figure 5a) and NDVI (Figure 5b) and negatively correlated with PRI (Figure 5c), which is consistent with the trend direction observed within controlled environment studies (Nuttall et al. 2018).
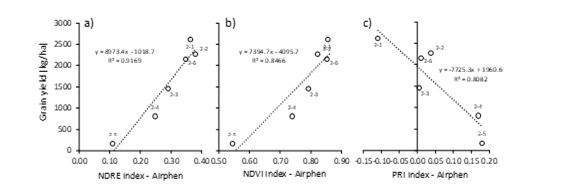
Figure 5. Relationship between wheat yield and Airphen® derived indices for a paddock (2) monitored near Murtoa, Victoria in 2018. Indices include a) normalised difference vegetation index (NDVI), b) normalised difference red edge (NDRE) and c) photochemical response index (PRI) derived from an Airphen® multispectral camera.
The spatial variation in PRI (or NDRE and NDVI) across paddock 2 can be used as a relative-surrogate to represent frost affected regions of crop and an opportunity for spatial management of crops for hay versus grain production (Figure 6). For 2018, the multiple heavy frosts up to crop flowering meant that this abiotic constraint is likely to have driven variation in yield across the landscape, where a single capture of remotely sensed data at flowering had utility for defining frost affected crops in four out of the six paddocks surveyed. For paddocks/regions/years where mild or discrete frost effects on crops are assessed with remote sensing tools, multiple sensor acquisitions may be required to isolate the change in crop reflectance signature associated with these short-term events. Common indices such as NDVI should also be used with caution, as their utility appears inconsistent across a range of frost related studies (Perry et al. 2017; Fitzgerald et al. 2019). This variable response may reflect the confounding effects of factors such as crop development and natural senescence, weeds and/or other constraints. The confluence of multiple indices (for example NDRE, NDVI and PRI) indicating frost affected crops, may provide one multispectral method of estimating frost damage more reliably, or alternatively using a spectral mixture analysis approach to define new indices specifically targeted to frost response (Fitzgerald et al. 2019).
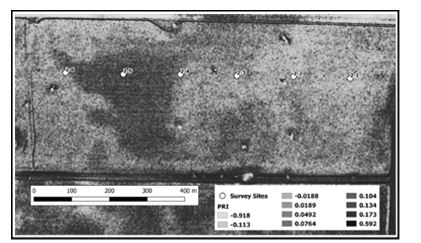
Figure 6. Spatial variation in the photochemical response index (PRI) across a wheat paddock (paddock 2) linked with crop frost damage. This represents an opportunity for spatial management of crops for hay versus grain production. Dark grey areas indicate low yielding zones and light grey areas are high yielding zones.
For remote sensing tools to have a practical application to industry, imagery needs to be captured at the paddock scale. For example, assessment of frost damage across whole-paddocks may be possible if several growers contract an aircraft equipped with a multi-spectral camera (e.g. Airphen®) to fly over multiple farms, making the process fast and affordable. Alternatively, spatial assessment using satellite (e.g. Sentinel 2) sensors may offer another approach, to support research and commercial opportunities (e.g. Flurosat Pty Ltd), although satellite obtained data may be limited by wave band and available indices. In both of these cases, the high-altitude platforms and large field-of-view takes away the complexity and error associated with ‘stitching’ overlapping images, which is required for sensors mounted on unmanned aerial vehicles (UAV) platforms. Ultimately, remote sensing tools may offer the opportunity to spatially manage frost affected crops. The next steps are to validate the proposed indices, identify other alternative indices (and determine their stability across different paddocks and seasons), quantify the economic benefit to growers and identify a commercial model that the industry may find attractive.
Conclusion
For wheat, where frost treatments were applied at flowering, grain number and yield were reduced by 8.8 and 7.2%, respectively, for every degree Celsius below zero (down to -4°C). This effect was additive over two consecutive nights. In terms of cold load, there was a 2.2 and 1.9% reduction in grain number and yield, respectively per °C.hr (below 0°C). The remote sensing spectral indices; PRI, NDVI and NDRE showed significant relationships with cold load and wheat yield over four of the six paddocks surveyed and represent an opportunity for spatial management of crops when considering hay versus grain production. Further investigation over multiple years, sites and crop growth stages is required to verify the stability and utility of these indices. Finally, the need for ground scouting to validate sensor derived information ahead of making a tactical management decision remains essential.
Acknowledgements
The research undertaken as part of this project is made possible by the significant contributions of growers through both trial cooperation and the support of the GRDC, the authors would like to thank them for their continued support.
This work is supported by investment in the ‘Improving practices and adoption through strengthening D&E capability & delivery in the southern region’, Regional Research Agronomists program – DAV00143 program as part of the Victorian Grains Innovation Partnership (VGIP) between the Grains Research and Development Corporation and Agriculture Victoria.
We also thank agronomist Matt Beddison (Crop Opti) and growers Leigh Bell, Craig Jordan and Wayne Adler for making the paddock frost survey possible. We are also grateful to Ashley Purdue and Russel Argall for their technical support.
References
Al‐Issawi, M., Rihan, H., El‐Sarkassy, N. and Fuller, M., 2013: Frost hardiness expression and characterisation in wheat at ear emergence. Journal of Agronomy and Crop Science 199, 66-74.
Cromey, M., Wright, D. and Boddington, H., 1998: Effects of frost during grain filling on wheat yield and grain structure. New Zealand Journal of Crop and Horticultural Science 26, 279-290.
Fitzgerald, G.J., Perry, E.M., Flower, K.C., Callow, J.N., Boruff, B., Delahunty, A., Wallace, A. and Nuttall, J., 2019. Frost Damage Assessment in Wheat Using Spectral Mixture Analysis. Remote Sensing, 11(21), p.2476.
Fuller, M.P., Fuller, A.M., Kaniouras, S., Christophers, J. and Fredericks, T., 2007: The freezing characteristics of wheat at ear emergence. European Journal of Agronomy 26, 435-441.
Marcellos, H. and Single, W., 1984: Frost injury in wheat ears after ear emergence. Functional Plant Biology 11, 7-15.
March, T., Knights, S., Biddulph, B., Ogbonnaya, F., Maccallum, R. and Belford, R.K., 2015: The GRDC National Frost Initiative, GRDC update paper - The GRDC National Frost Initiative
Nuttall, J.G., Perry, E.M., Delahunty, A.J., O'Leary, G.J., Barlow, K.M. and Wallace, A.J., 2019. Frost response in wheat and early detection using proximal sensors. Journal of Agronomy and Crop Science, 205(2), pp.220-234.
Perry, E.M., Nuttall, J.G., Wallace, A.J. and Fitzgerald, G.J., 2017. In-field methods for rapid detection of frost damage in Australian dryland wheat during the reproductive and grain-filling phase. Crop and Pasture Science, 68(6), pp.516-526.
Rebbeck, M. A., Knell, G.R., Hayman, P.T., Lynch, C.W., Alexander, B.M., Faulkner, M., Gusta, L.V., Duffield, T.K., Curtin, S. and Falconer, D., 2007: Managing Frost Risk - A guide for southern Australian Grains. In: D. Reuter ed. South Australian Research and Development Institute and Grains Research and Development Corporation, Canberra, ACT.
Watt, S., 2013: Frost research targets yield losses, Ground Cover, 103.
Contact details
Dr James Nuttall
Agriculture Victoria, 110 Natimuk Road, Horsham, Victoria, 3400
+61 3 5362 2111
james.nuttall@agriculture.vic.gov.au
@nuttall_grains
GRDC Project Code: DAV00143,
Was this page helpful?
YOUR FEEDBACK