Variable legacy effects of crop sequences
Take home messages
- Crop legacy effects outlined in this paper relate to two consecutive dry seasons (2018 and 2019).
- Earnings before interest and tax (EBIT) in 2019 was highly correlated with the conversion efficiency of water to product (kg/ha/mm) and this was affected by crop species, sowing time and nitrogen management over both the 2018 and 2019 growing seasons.
- Barley (grain only) following canola (Greenethorpe) or wheat (Wagga Wagga) had an excellent water use conversion efficiency and was more profitable when harvested for grain compared with hay production.
- Higher EBITs were often achieved with wheaten hay compared with wheat grain, especially with early sown crops.
- Negative EBIT for wheat grain production could be avoided by opting for hay production, however this was not always true for canola.
- The 2019 EBIT for wheat or canola hay production was often lowest where early sown canola or wheat was grown in 2018 and low nitrogen management was applied.
Background
Financial returns from a single crop ignore the potential impacts of longer-term financial performance of the crop sequence. Crop legacy effects include differences in nitrogen (N), water and disease carryover as well as weed management considerations. These effects are often impacted by crop choice, sowing time and in-season N management. Under drought conditions such as those in 2018 and 2019, most sequence effects will be driven by water availability. The profit of the current AND consecutive seasons can be influenced by crop choice, input costs, N management and management decisions to graze crops, cut hay or harvest grain.
In recent times optimising early sowing opportunities for establishing wheat and canola with potential increased rooting depths highlight how access to deep stored soil water can provide additional value that cannot be captured by other crop species or later sowing times. However, if previous crop history has dried the profile significantly then establishing early sown crops strategically after pulse crops may be one way to increase the probability of improved soil water status through the soil profile and facilitate deeper soil water replenishment.
In the 2018 and 2019 seasons, grain crop production was limited by drought conditions with many growers choosing to graze crops or cut crops for hay rather than harvesting for grain. The impact of hay cutting options on soil water are not always predictable. For example, early crop termination of canola will stop transpiration earlier in the growing season compared with canola left for grain production, provided complete and timely control of the canola regrowth is achieved. Conversely wheaten hay options often substantially decreased the residue cover to a greater extent than hay strategies applied to canola which may influence soil water storage. This may lead to different fallow efficiency and growing season transpiration efficiency, both of which have large impacts on subsequent crops. Based on this reasoning, one could speculate that there may be greater negative legacy effects on soil water from cutting wheaten hay (large residue loss) compared to canola hay (lower residue loss).
This paper considers the profitability of different options in the 2018 and 2019 seasons, and also the 2018 crop legacy effects that influenced the 2019 outcomes. The focus, in particular is on comparisons of crop choice and management impacts on grain or hay production as well as how these choices may impact on financial returns.
Experiment outline
Four contrasting locations were selected in 2017 that represented a range of soil types, environmental factors and encompassed a diverse range of grower and consultant groups. The main core experiment site is located at the Wagga Wagga Agricultural Institute with three regional node sites located at Condobolin Research and Advisory Station, Greenethorpe and Urana. There are six treatment sequences that are common to all sites with the Wagga Wagga site encompassing all treatments. The crop sequence treatments applied are provided in Table 1. All sites were sown to wheat in 2017 with the treatment sequences starting in 2018. Data from the Wagga Wagga, Greenethorpe and Urana sites are presented in this paper.
Methods used for determining hay production
Hay dry matter (t/ha) = total crop dry matter greater 15cm high x 0.7 (account for losses)
Table 1. Farming system sites with sowing, nitrogen and winter grazing strategies applied to different crop sequences.
Crop sequences | Urana | Wagga Wagga | Greenethorpe | |||
|---|---|---|---|---|---|---|
Sowing | Nitrogen | Sowing + grazing | Nitrogen | Sowing + grazing | Nitrogen | |
Canola-Wheat | E, T | Low, High | E+G, T | Low, High | E+G, T | Low, High |
Canola-Wheat-Barley | T | Low | T | Low, High | ||
Canola-Wheat-Wheat | T, L | High | ||||
Lentil-Canola-Wheat | E | Low, High | E, T | Low, High | E | Low, High |
Lupin-Canola-Wheat | T | Low | ||||
Faba bean-Canola-Wheat | T | Low | T | Low | ||
Chickpea-Wheat | T | Low | T | Low | ||
Biserrula-Wheat | T+G | High | ||||
*Legume-Canola-Wheat | T | Low | E+G, T | Low, High | E+G, T | Low |
Faba bean/Canola-Wheat | T | Low | T | Low | ||
Wheat-Wheat-Wheat | T | Low, High | T | Low | ||
Fallow-Canola-Wheat | E | High | E, T | High | ||
Canola-Wheat (12 t/ha) | T | Low | ||||
Canola-Wheat (6 t/ha) | T | Low | ||||
Flexible one | Flexible | Flexible | Flexible | Flexible | Flexible | Flexible |
Flexible two | Flexible | Flexible | Flexible | Flexible | ||
E = Sown early over late March to mid-April period, E+G = As above plus winter grazing, T = Sown timely over late April to mid-May period, Low = Low nitrogen budgeting based on decile 2 to 4 rainfall projections, High = High nitrogen budgeting based on decile 6 to 8 rainfall projections, *Legume = Vetch, balansa clover and arrowleaf clover, Flexibly = the local consultants’ choice (James Madden and John Stephenson (Urana), Greg Condon (Wagga Wagga) and Tim Condon and Peter Watt (Greenthorpe), Chris Baker (Condobolin)).
Results and discussion
Wagga Wagga farming systems site in 2019
The Wagga Wagga farming systems site received approximately 185mm of rainfall from April to October and an estimated summer fallow conservation of 20mm. Annual average rainfall from April to October at this site is 350mm and expected average summer fallow conservation is 42mm. Growing season soil evaporation is typically in the range of 70mm to 115mm. The crop sequence treatments applied are provided in Table 1.
Crop choice
The 2019 EBIT performance for grain production tended to be highest for barley and lowest for canola with wheat intermediate. Similar comparison for hay production was obtained; barley equal to wheat and both of these crop choices often performed better than canola (Table 2).
Sowing time
Un-grazed early sown crops of wheat or canola in 2019 with the same 2018 sowing time and cropping history (for example; wheat/canola or canola/wheat) produced lower grain yields in 2019 than timely sowing of these species. Hay production for these treatments reduced differences between sowing times (early verses timely) as measured by financial outcomes (Table 2).
Nitrogen
Nitrogen added to timely sown wheat where the crop sequence was canola/wheat increased wheat hay yield and EBIT, while N added to this sequence decreased wheat grain yield and EBIT. Nitrogen added to 2019 timely sown canola in a wheat/canola rotation increased both hay and grain yields and EBIT (Table 2).
Table 2. A subset of the Wagga Wagga farming systems cropping only treatments for production (grain or hay, t/ha), income ($/ha), costs ($/ha) and earnings before interest and tax (EBIT, $/ha).
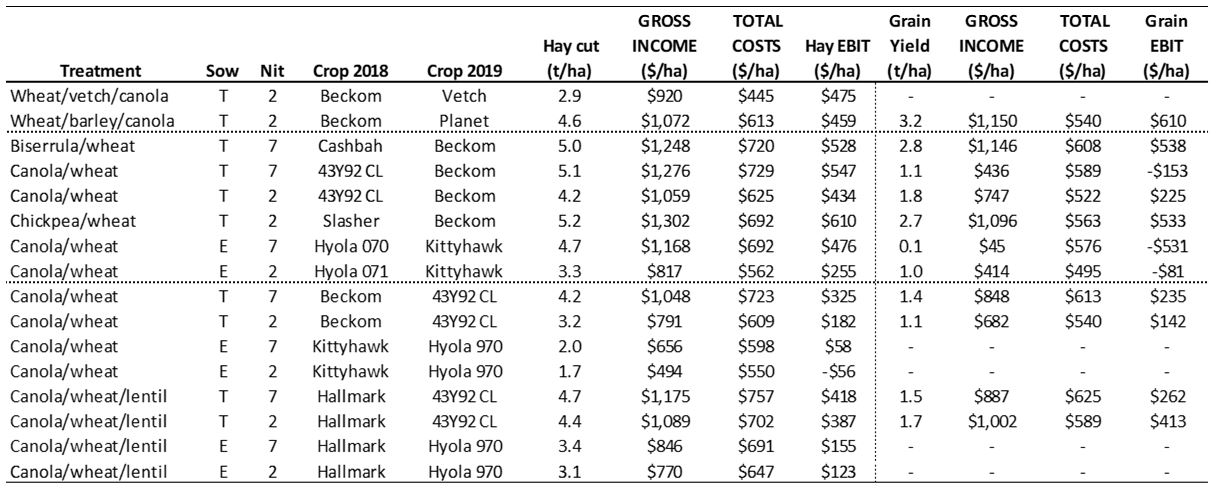
E = Sown early over early April period, T = Sown timely over late April to mid-May period, Nit 2 = Low nitrogen budgeting based on decile 2 rainfall projections July to October, Nit 7 = High nitrogen budgeting based on decile 7 rainfall projections July to October.
At the Wagga Wagga site, the 2018 crop choice and N management affected the hay production of the 2019 early sown canola (Hyola®970CL). Hay production was highest following lentils, and lowest following wheat (a difference of approximately 1.5t/ha) while the canola hay after the vetch-trifolium hay was intermediate. (Figure 1). The difference of approximately 1.5t/ha in hay production equated to a difference in EBIT of $169/ha. In this example the 2018 crop choice had a larger effect on hay production than N management. These results suggest multi-year returns need to be considered when making crop sequence decisions.
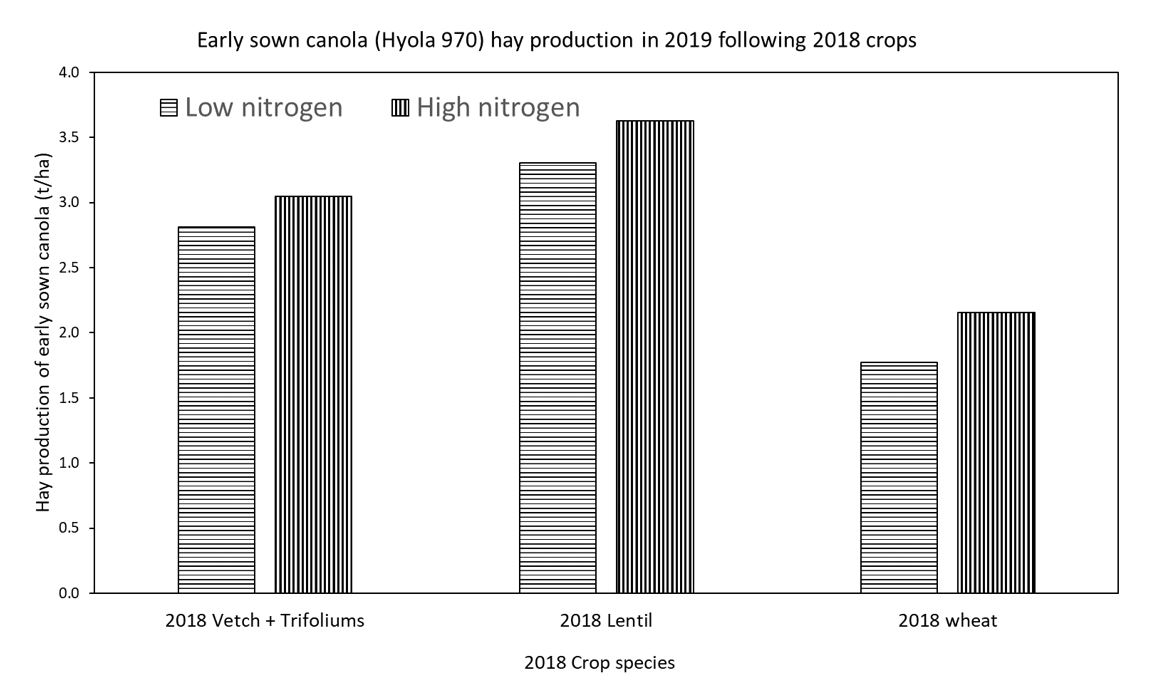
Figure 1. Early sown canola (var. Hyola®970) cut for hay in 2019 that was previously cropped in 2018 with either a vetch plus Trifolium mix cut for hay, lentils (var. Hallmark) or wheat (var. Kittyhawk) harvested for grain. Low nitrogen assumed July to October rainfall was decile 2 and high nitrogen management assumed July to October rainfall was decile 7.
2019 profits
Earnings before interest and tax are provided for the Wagga Wagga farming systems site (Table 2 and Figure 2). The cluster (Figure 2) that provided the best positive earnings for grain and hay production included PlanetA barley (closed circle), some treatments of timely (early May) sown BeckomA wheat with high N (open square) and all treatments of low N (open triangle) as well as some treatments of timely (late April) sown canola (var. Pioneer®43Y92 CL) with high (open diamond) and low N (open circle), (Figure 2).
The best financial results for 2019 timely canola occurred after the 2018 forage mix (vetch + Trifoliums) or lentil (var. Hallmark) while best financial results for timely wheat where achieved after chickpea (var. Slasher) or biserrula (var. Casbah). The poorest results for hay and grain production were obtained by early sown canola (var. Hyola®970, cross and dash symbols) which was grazed in winter. These treatments failed to respond to the rainfall and losses were greatest where the preceding crop (2018 crop) was early sown wheat (var. Kittyhawk).
Grain production for lentil (0.72t/ha), chickpea (0.54t/ha) and lupin (var. Batman (1.3t/ha)) in 2019 indicated that lupin was the most profitable under the conditions experienced (Figure 2). The same comparison for hay production indicates chickpea were the more profitable legume crop. In each case these grain legume crops were sown with Beckom wheat in 2018.
There was a tendency for high N fed crops of timely sown wheat (open square) and canola (open diamond) that had previously been cropped to canola and wheat to have better hay returns than grain returns (Figure 2). However, the opposite was true if the timely sown wheat followed biserrula or the canola followed the forage legume mix (vetch + Trifoliums). This indicates the 2018 crop influenced the preferred financial choice for either grain or hay production in 2019 (2018 crop history not shown in Figure 2).
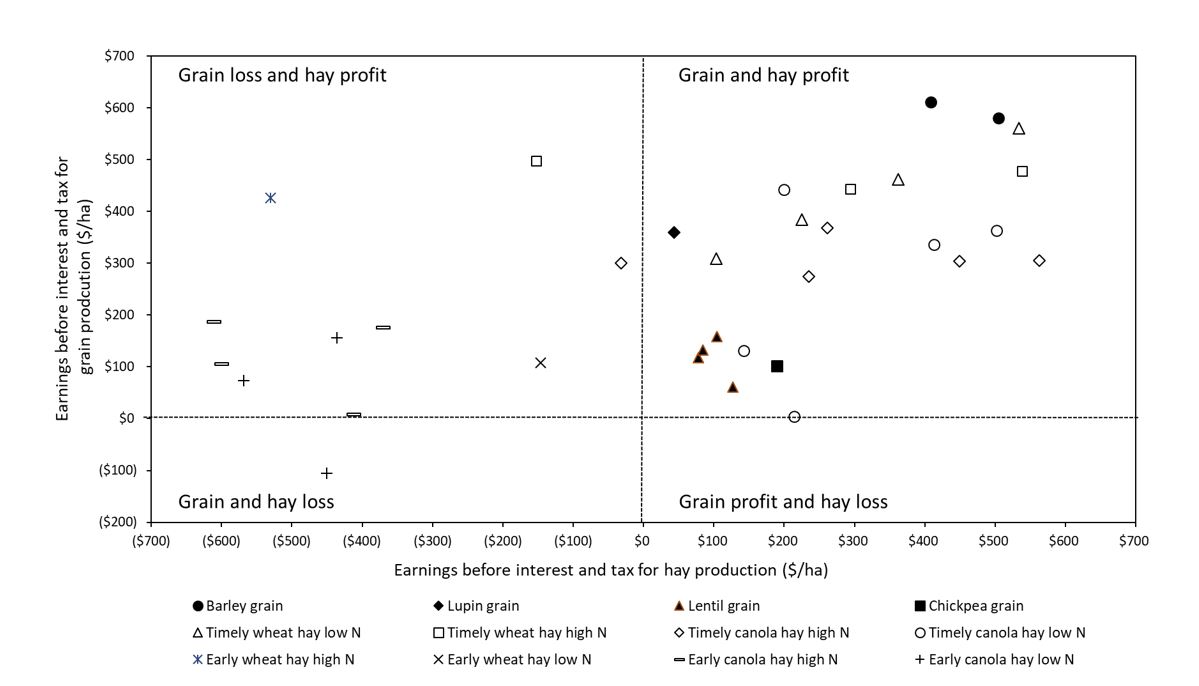
Figure 2. 2019 EBIT for grain or hay production for various crops and management practices at the Wagga Wagga farming systems site.
There was a strong positive correlation between EBIT and the amount of product produced per mm of water received. This emphasises the importance of crop legacy effects, summer fallow efficiency, and minimising in-crop evaporation. The best water use efficiency (WUE) of grain production in 2019 was achieved by barley (2019) following wheat (2018) while the best WUE for hay production was achieved by timely high N canola after vetch (open diamond) and timely wheat with high (open square) and low N (open triangle) after biserrula and chickpea, respectively (Figure 3).
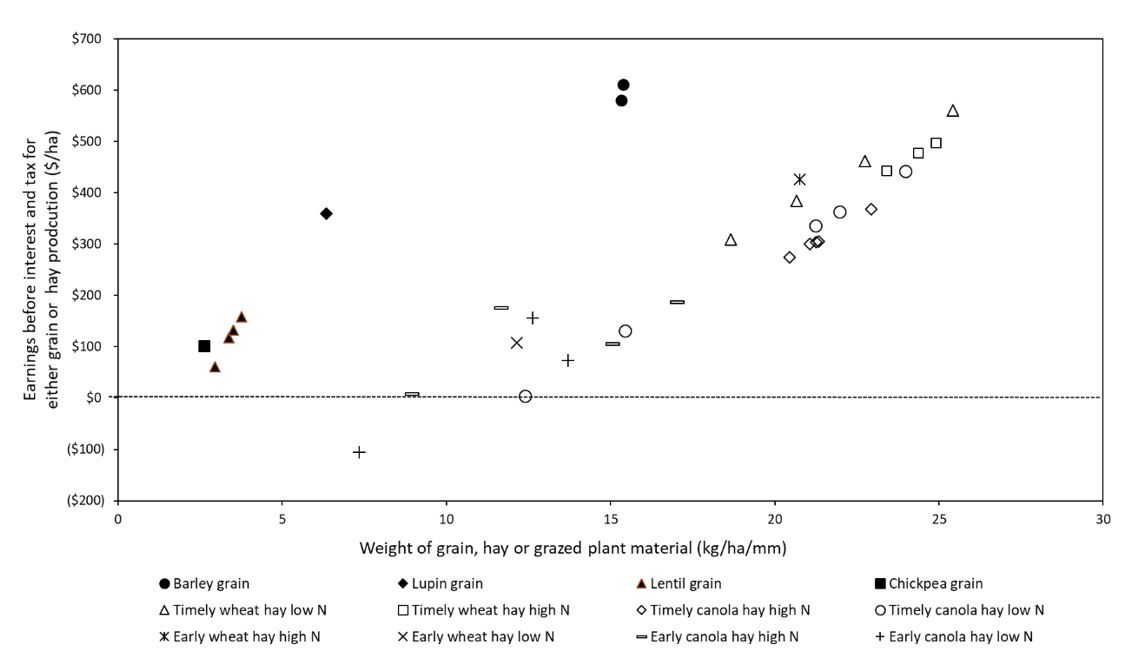
Figure 3. 2019 EBIT, for grain or hay production for various crops and management practises at the Wagga Wagga farming systems site.
Greenethorpe farming systems site
All treatments implemented at the Greenethorpe farming systems site are outlined in Table 1. In 2019, the Greenethorpe site received 98mm between the 23 and 31 March and 128mm of rainfall from April to October with the average estimated summer fallow water conservation of approximately 40mm (157mm December 2018 to February 2019). Early wheat and canola crops were sown between 23 and 27 March 2019, Planet barley sown on the 24 April with all other timely crops sown between 1 and 14 May 2019. The production, income, costs and EBIT for a subset of the treatments that relate to a cropping only enterprise is provided in Table 3. In the cropping ONLY treatments, the top three most profitable sequences included barley harvested for grain following timely canola (4.7t/ha), legume hay following timely wheat (3.7t/ha hay dry matter (DM)) and timely wheat hay/low N following timely triazine tolerant canola (canolaTT) (5.1t/ha hay DM) (Table 3).
The highest hay yields and EBITs were produced from timely wheat following timely canola (average 5t/ha hay with $562/ha EBIT), compared to early wheat following early canola producing 3.5t/ha hay DM with $297/ha EBIT. The timely wheat grain yield ranged between 2.3t/ha and 2.8t/ha (EBITs $262/ha to $496/ha, respectively), with higher grain yields in any second year of timely wheat (2.8t/ha compared with less than 2.6t/ha) due to increased soil moisture concentration with higher surface stubble load.
The faba bean and chickpea pulse crops following timely wheat produced higher EBITs than timely canola ($406/ha and $277/ha compared with less than $34/ha). The timely canola averaged 3t/ha hay DM or 0.8t/ha to 1.1t/ha grain indicating in this dry season, canola hay was more profitable than canola grain. All early sown crops had insufficient moisture to produce a grain yield, so they were either cut for hay or grazed, with the early canola following lentils only producing approximately 2.4t/ha hay DM (and a negative EBIT) (Table 3). These results indicate that under two years of dry conditions early sown crops are impacted the greatest, with timely canola being impacted more than timely wheat and timely wheat impacted more than timely barley.
Table 3. A subset of the Greenethorpe farming systems cropping only treatments for production (grain or hay, t/ha), income ($/ha), costs ($/ha) and earnings before interest and tax (EBIT, $/ha).
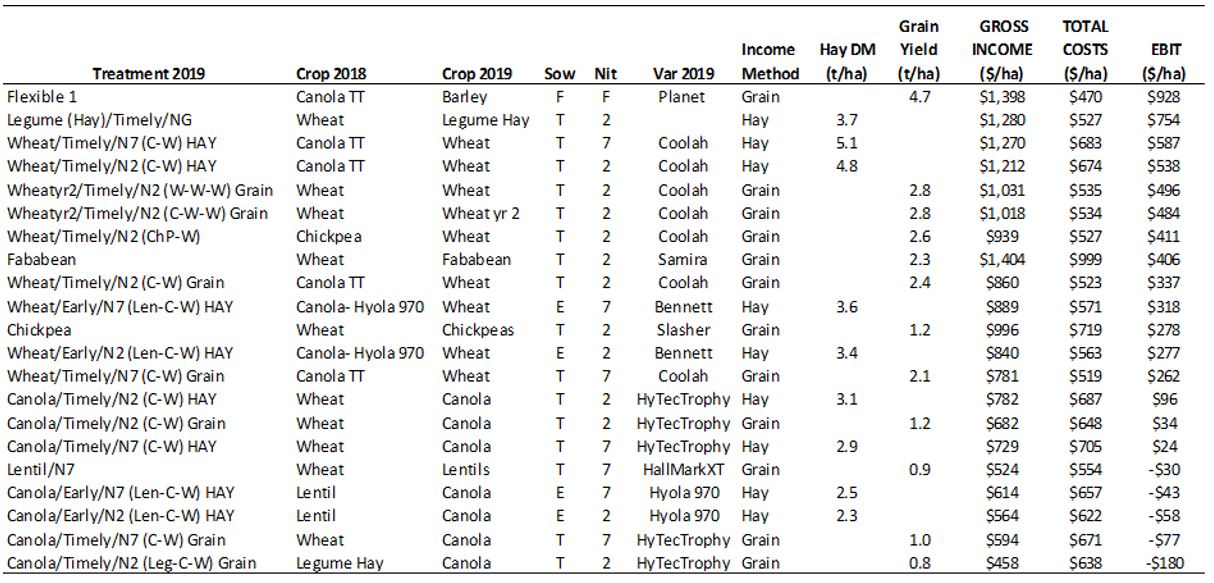
E = Sown early over late March to mid-April period, T = Sown timely over late April to mid-May period, Nit 2 = Low nitrogen budgeting based on decile 2 rainfall projections July to October, Nit 7 = High nitrogen budgeting based on decile 7 rainfall projections July to October, F = Flexibly = the local consultants’ choice, Tim Condon and Peter Watt.
At the Greenethorpe site the amount of product produced per mm of water was positively correlated with EBIT (Figure 4) and negatively correlated with cost of production (data not shown). High conversion efficiencies provided 20kg to 30kg of product per mm of water and low conversion efficiencies produced approximately 5kg of product per mm of water. Coolah wheat cut for hay and Planet barley harvested for grain produced the highest product weights per mm of water. HyTTec®Trophy canola and Hallmark lentils for grain production produced the lowest conversion efficiency of product per mm of water (Figure 4).
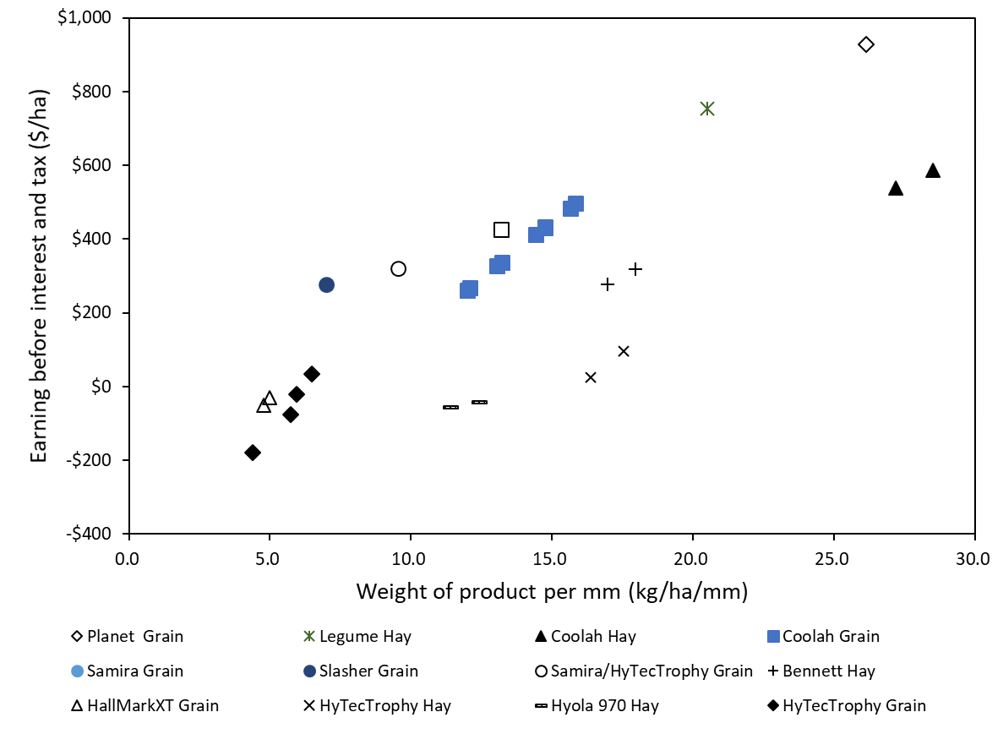
Figure 4. EBIT ($/ha) for grain, grazing and/or hay production of various crops and management practises and weight of product produced per mm of water (kg/ha/mm) for the Greenethorpe farming systems site.
Urana farming systems site
All hay production in 2019 at Urana produced negative EBIT while all grain production produced positive EBIT (Table 4). Wheat tended to produce higher returns than canola and higher N tended to produce high wheat returns but similar or lower canola returns. This N effect was in contrast to the Wagga Wagga site (Table 2 and 4). The highest 2019 canola EBIT was produced from timely sowing canola after lentils while the highest 2019 EBIT for wheat was produced from timely sown wheat grown after timely sown canola(Table 4).
Table 4. A subset of the Urana farming systems cropping only treatments for production (grain or hay, t/ha), income ($/ha), costs ($/ha) and earnings before interest and tax (EBIT, $/ha).
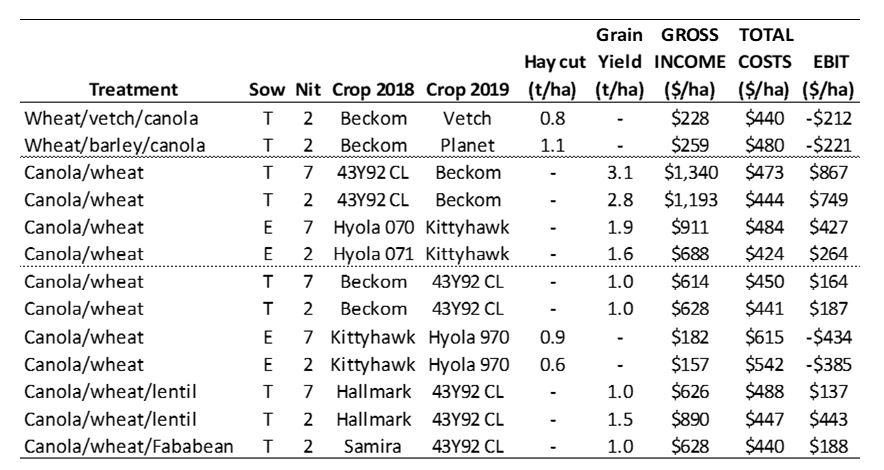
E = Sown early over early April period, T = Sown timely over late April to mid-May period, Nit 2 = Low nitrogen budgeting based on decile 2 rainfall projections July to October, Nit 7 = High nitrogen budgeting based on decile 7 rainfall projections July to October, Note: Emu damage on Planet barley reduced the amount that could be captured for hay production.
Conclusions
Crop choice, sowing time and N management in 2018 impacted on crop returns in 2019 and this challenges growers to think of the negative and positive effects of certain crops on the profitability of the crop sequence. While legume break crops provided consistent advantages for the subsequent crop this was not always the case with canola.
At the Greenethorpe and Wagga Wagga sites, hay options provided some advantages for specific 2018 and 2019 crop combinations. In some cases, this ensured losses from grain production were avoided but was not a guarantee for profitability. Grain production was still profitable at some sites (Urana) for certain crop combinations, particularly where timey sown cereal or canola followed legume forage or legume grain crops.
Crop species performance under drought conditions in southern NSW tended to be ranked as barley better than wheat, which is better than canola (barley > wheat > canola). Pulse crop performance under drought conditions in southern NSW tended to be ranked as faba bean which was equivalent to lupin which was better than chickpea which was equivalent to lentil (faba bean = lupin > chickpea = lentil).
The Vertisol soil at the Urana site provided better grain filling conditions and subsequently grain production was more profitable at this site than hay production.
Acknowledgements
The research undertaken as part of this project is made possible by the significant contributions of growers through both trial cooperation and the support of the GRDC, the authors would like to thank them for their continued support. This research was undertaken as part of GRDC project CFF00011 and with financial support from CSIRO and NSW Department of Primary Industry.
Contact details
Mr Graeme Sandral
NSW DPI, Wagga Wagga Agricultural Institute
0409 226 235
graeme.sandral@dpi.nsw.gov.au
@gsandral
GRDC Project Code: CFF00011,
Was this page helpful?
YOUR FEEDBACK