What N is in profile - 3 dry years with minimal mineralisation. What are the results showing? Also, insights from a long-term nutrition site running since 2007 in CNSW
Author: Jim Laycock (Incitec Pivot Fertilisers) | Date: 26 Feb 2020
Take home messages
- Segment deep N’s in 2020 at 0-30, 30-60cm depths to see where the nitrogen is in the profile
- Don’t plant wheat on wheat chasing 2018/19 fertiliser due to potential crown rot infection
- Sustainable continuous cropping systems should include a pulse crop at least twice in a 9-year rotation
Incitec Pivot Fertiliser’s long term nitrogen by phosphorus trial was established to describe the cumulative effect of 5 different rates of nitrogen fertiliser and 5 different rates of phosphorus fertiliser on grain yield and protein % in a controlled traffic cropping rotation.
This site was commenced in 2007 with soil N to 0-60cm of 160 kg/N/ha sampled pre plant in 2007 (field peas 2006) and a site Colwell phosphorus of 26 mg/kg. There are 25 fertiliser treatments replicated 4 times and the crop rotation is sown over the same plots annually.
One issue seen in 2019 as a result of accurately sowing row-on-row with sub 2cm Real-Time Kinematic (RTK) auto steer, was high levels of crown rot as a result of sowing on exactly the same plant line as last year’s Gregory wheat. One of the strategies to reduce the impact of carry over crown rot infection is avoiding contact with last season’s wheat stubble. When sowing row-on-row, contact with last season’s stubble was maximised and crown rot infection levels were high, and screenings were >15%.
Rotation
2007 – Wheat
2008 – Wheat
2009 – Wheat
2010 – Albus Lupins
2011 – Wheat
2012 – Canola
2013 – Wheat
2014 – Canola – resown
2015 – Wheat
2016 – Wheat
2017 – Canola
2018 – Wheat
2019 – Wheat
Seeding and harvest
A small plot cone seeder with 17.5cm row spacing was used in 2007 – 2009 and 25cm row spacing from 2010. From 2010 sowing, trial site management, harvest, data analysis and trial reports were conducted by Kalyx. From 2015 Kaylx plot seeder used sub 2cm RTK, 6 rows at 23cm row spacing, 1.38m wide plots and 10m plot lengths. Harvest grain yield per hectare was calculated on 2m plot centres.
In 2015 the original 20m long plots were cut in half. From 2015, the 2007 ‘A trial’ N and P rates were retained on the western half and the 2015 ‘B trial’ N and P rates were applied on the eastern half of the original plots. See table 1. The ‘A trial’ treatments continue to build soil P and N while ‘B trial’ treatments now run down and also build P and N.
Table 1. Treatment list
2007 – 2019 | 2015 – 2019 |
|---|---|
40P 0N | 0P 0N |
40P 120N | 0P 30N |
40P 90N | 0P 60N |
40P 60N | 0P 90N |
40P 30N | 0P 120N |
30P 0N | 10P 0N |
30P 120N | 10P 30N |
30P 90N | 10P 60N |
30P 60N | 10P 90N |
30P 30N | 10P 120N |
20P 0N | 20P 0N |
20P 120N | 20P 30N |
20P 90N | 20P 60N |
20P 60N | 20P 90N |
20P 30N | 20P 120N |
10P 0N | 30P 0N |
10P 120N | 30P 30N |
10P 90N | 30P 60N |
10P 60N | 30P 90N |
10P 30N | 30P 120N |
0P 0N | 40P 0N |
0P 120N | 40P 30N |
0P 90N | 40P 60N |
0P 60N | 40P 90N |
0P 30N | 40P 120N |
Nutrient placement
Triple Super (20% P) was banded with the seed, 50% of the urea (46% N) rate applied at planting banded below and to the side of the seed up until 2014. From 2015 urea is now placed 5cm directly below the seed with the Kaylx plot seeder.
The balance of urea is applied as urea broadcast in wheat at GS31 and at the pre rosette stage in canola. Urea was not applied in 2010 (Albus lupins) and urea was not top-dressed in 2007, 2014 (low yield potential due to replant) and 2018 (dry conditions).
Sulphur has been applied 4 times during the life of the trial as broadcast gypsum (2), banded potassium sulphate (1) and broadcast Gran-Am® (2017). A total of 5kgs/ha of zinc and 2kgs of boron have also been applied.
Urea nitrogen balance at the Grenfell long term NxP trial site
In the absence of deep N testing results for the 2020 season due to the difficulties coring dry soil profiles the annual application of urea nitrogen (kgs/N/ha) and the annual export of grain nitrogen as kgs/N/ha over the current life of the trial from selected treatments is presented in table 2. The method used to balance nitrogen at this site does not consider gains from mineralisation, losses from denitrification, leaching or volatilisation.
Nitrogen mineralised from the soil organic matter and crop residues makes a substantial contribution (~50%) to crop N uptake (Angus and Grace, 2017; Gupta, 2016).
The supply of N from mineralisation is driven by soil moisture, soil temperature and soil organic matter levels. Soil pH also has an effect with slower mineralisation rates on acid soils. Mineralised nitrogen is available throughout the year. Generally, there is more N mineralised and available in autumn and spring and lower availability in winter when soils are at lower temperatures. Whenever there is a rainfall event and surface soil is moist, there is potential for a mineralisation event to occur. Although rainfall events have been few and far between in the past three seasons some nitrogen would still have come into the system.
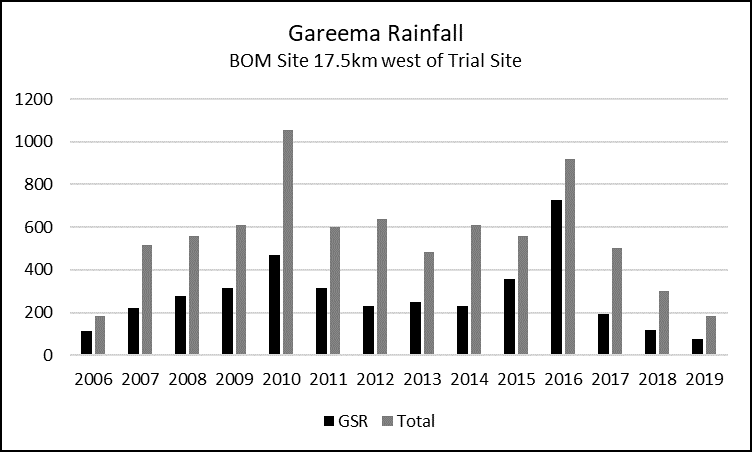
Potential loss of soil nitrogen through denitrification has been minimal as a result of low rainfall and no waterlogging events. The last potential denitrification events at the Grenfell trial site occurred in 2010 and 2016 (see rainfall figure 1). Nitrate leaching isn’t a significant pathway for loss on these soils. (Smith, 2000).
Although volatilisation losses are low on these acid soils during winter, the top dress urea is managed to avoid any loss by topdressing in front of a rainfall event.
Immobilisation of N may occur when plant residues of low N content are decomposing in the soil. Immobilisation represents a temporary unavailability of mineral N in the soil for growing plants to access. Immobilisation was first seen on site in 2015 when wheat on low nitrogen treatments exhibited nitrogen deficiency symptoms where canola residue lay on the soil surface. The residue was concentrated as a chaff pile where the small plot harvester had stopped at the end of each plot.
Grenfell long term NxP trial results
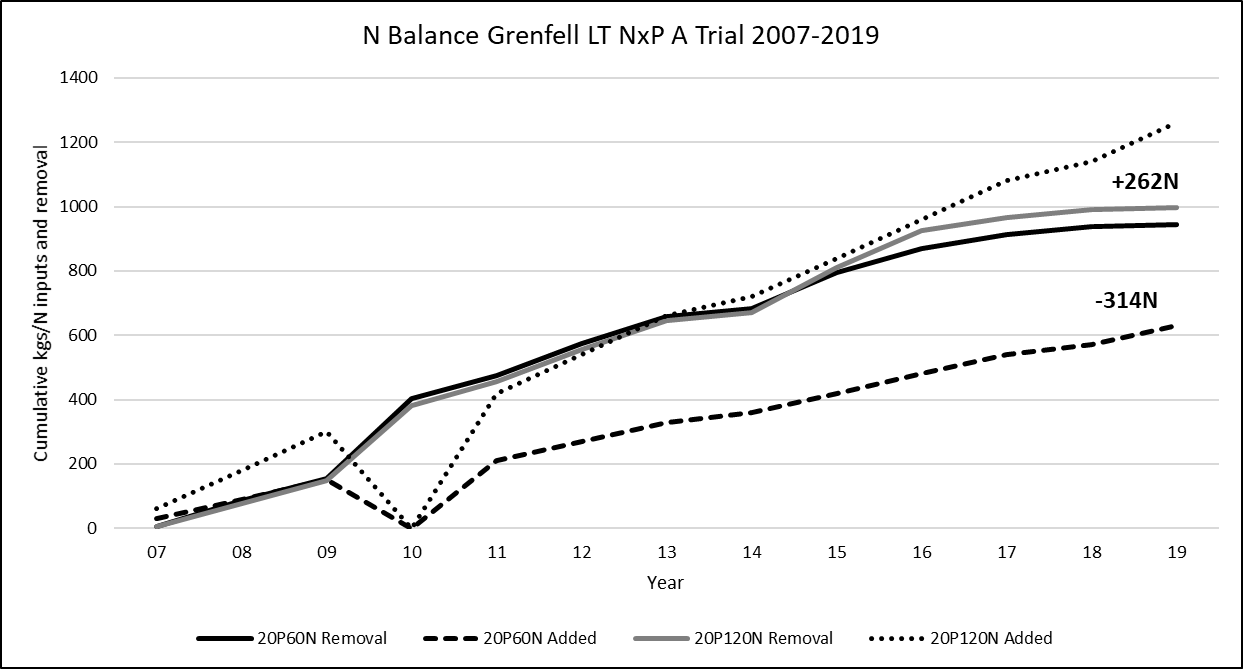
Trial treatments include four rates of nitrogen to supply a total of 30, 60, 90, or 120 kg of nitrogen per hectare annually (unless otherwise indicated). Displayed in figure 2 and table 2 is the total nitrogen supplied as urea for treatments 20P 60N and 20P 120N from the first planting in 2007 and the grain nitrogen removal
 Figure 1. Gareema rainfall 2006 – 2019
Over the 13 years of the trial with treatment 20P 60N there has been 944 kg/grain yield/N removed and 630 kg/urea/N applied for a negative nitrogen balance of -314 kg/N (see table 2 and figure 2).
The 20P 120N treatment has seen 998 kg/grain yield/N removed and 1260 kg/urea/N applied for a positive nitrogen balance of +262 kg/N.
Table 2. A trial grain nitrogen N/kg/ha removal and nitrogen kg/ha applied 2007-2019
Applied N/kgs/ha | 07 | 08 | 09 | 10° | 11 | 12 | 13 | 14 | 15 | 16° | 17 | 18 | 19 | Total N/kgs/ha Removal |
|---|---|---|---|---|---|---|---|---|---|---|---|---|---|---|
20P60N | 5* | 80 | 70 | 247# | 73 | 100 | 84 | 25* | 110 | 77 | 41 | 26* | 6 | 944N |
20P120N | 6* | 70 | 72 | 234# | 74 | 100 | 91 | 25* | 138 | 115 | 40 | 26* | 7 | 998N (+262N) |
40P120N | 6 | 94 | 80 | 255 | 88 | 90 | 91 | 27 | 122 | 111 | 52 | 25 | 9 | 1047N |
20P | 4 | 65 | 69 | 238 | 75 | 95 | 68 | 20 | 62 | 52 | 33 | 19 | 7 | -807N |
0P0N | 3 | 65 | 51 | 240 | 40 | 66 | 48 | 5 | 37 | 49 | 12 | 20 | 9 | -645N |
* No top dressed urea
# Albus lupins no urea applied, N removal grain % x grain yield
° Significant waterlogging event (see figure 1)
 Figure 2. N balance at Grenfell trial 2007 – 2019
The grain yield nitrogen removal for the 20P0N treatment over the current life of the trial has a negative balance of -807 kg/N. Up until 2013 starting profile nitrogen from the field pea crop in 2007 and the albus lupin crop in 2010 have supplied sufficient nitrogen to achieve comparable grain nitrogen yield to the 20P60N and 20P120N treatments.

The total soil nitrogen pool is being drawn down to an unsustainable level in the 20P60N treatment by removing more N than what is coming into the system (See Figure 4) through mineralisation. In a 500 mm average annual rainfall zone 2-3% of soil total N is mineralised during an average year in southern Australia. This represents 28-42 kg N/ha from a topsoil containing 1% OC (Angus 2016).
 Figure 4. 0-60cm soil N at Grenfell long term NxP A trial 2017
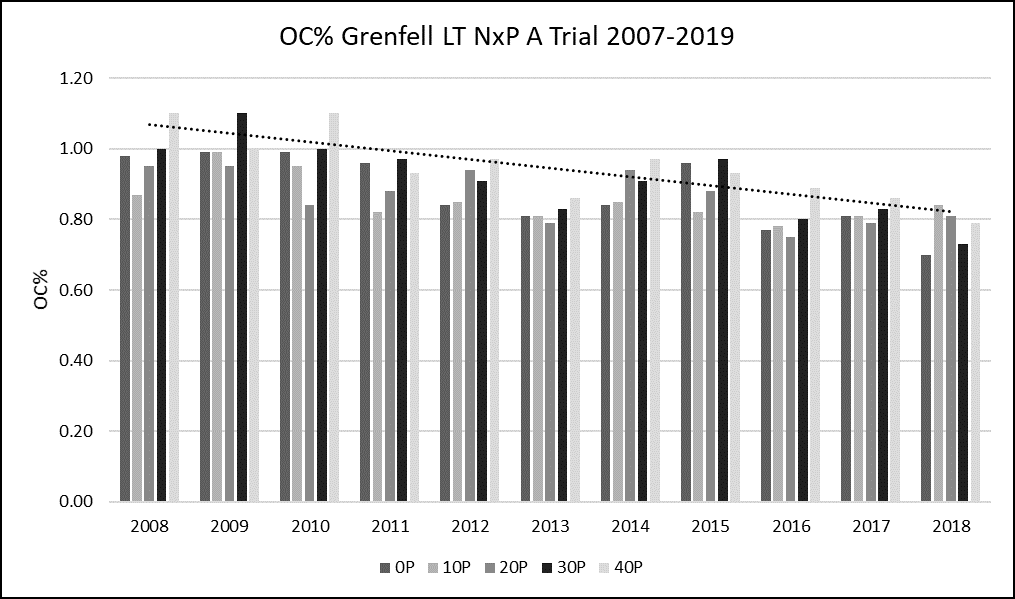
As soil organic carbon levels continue to decline at this site (see Figure 5) and if a pulse crop isn’t included in the rotation, total soil nitrogen is likely to decline further.
 Figure 5. Organic carbon % at Grenfell long term NxP A trial 2007-2019
After 14 years of continuous cropping in an experiment at Harden, NSW, the daily rate of mineralisation, as a percentage of the total nitrogen present, was 30% less than the rate measured after 3-6 years of cropping. This decrease was in addition to the decrease present due to a fall in total organic matter and suggests the quality of organic matter has also decreased. (Angus 2006)
The N balance (Figure 2) also shows the effect of the ongoing drought with the grain yield nitrogen removal declining and continued application of urea nitrogen increasing the cumulative urea nitrogen.
When conditions allow, segmented deep nitrogen sampling will identify where that nitrogen is lying in the soil profile.
Additional research at the Grenfell site, completed, ongoing and proposed includes inquiry on the following issues: 10-30cm BSES P/Colwell P/PBI, 0-10cm DGT P/Colwell P, Mehlich-3, sulphur deficiency in canola, random sampling vs “kitchen method”, pH of fertiliser band and surrounding soil, sub-soil acidity, soil boron, diffusion of phosphorus in fertiliser bands, crop response to residual phosphorus, crop response to residual urea nitrogen, urea use efficiency.
Acknowledgements
Thanks to trial site co-operators, Duncan Lander 2007-2015, David Partridge 2016-2019 and Kaylx for managing the site.
Reference
Angus J and Grace P (2017). Nitrogen balance in Australia and nitrogen use efficiency on Australian farms. Soil Research 55,435-450.
Angus J (2006). Budgeting crop nitrogen supply better estimation better decisions. GRDC Grains Research Update paper.
Angus J (2006). Targeted inputs makes sense. Farming Ahead No 173 June 2006.
Gupta VVSR (2016). Factors affecting N supply from soils and stubbles. GRDC Grains Research Update paper.
Simpfendorfer S (2015). Crown Rot an update on latest research. GRDC Grains Research Update Paper.
Smith, CJ, Dunin FX, Poss R, and Angus JF (2000). Nitrogen budget of wheat growing on a Riverine clay soil. Aust. J. Agric. Research 51, 867–76.
Contact details
Jim Laycock
Incitec Pivot Fertilisers
Ph: 0427 006 047
Email: jim.laycock@incitecpivot.com.au
Varieties displaying this symbol beside them are protected under the Plant Breeders Rights Act 1994.
® Registered trademark
Was this page helpful?
YOUR FEEDBACK
