Using plant available water (PAW) to inform decision-making and crop resourcing: What to do when you do not have a PAWC characterisation on-site
Take home messages
- Plant available water (PAW) is a key determinant of potential yield in dryland agriculture. Obtaining a measurement or estimate of PAW can, therefore, inform crop management decisions relating to time of sowing, crop type or the level of fertiliser inputs
- Estimating PAW, whether through soil coring, use of a soil water monitoring device or a push probe, requires knowledge of the plant available water capacity (PAWC) of a soil. PAWC characterisations for 26 soils in the Liverpool Plains are publicly available in the APSoil database, which can be viewed in Google Earth and in the ‘SoilMapp’ application for iPad and Android
- Variation in the observed PAWC is linked to parent material, texture and subsoil constraints. Similarity in soil properties is therefore key, when choosing an appropriate PAWC data for your soil
- Recognising how soils are distributed across the landscape, helped by understanding how the soils have been formed, assists with assessing similarity in soil properties. The nearest characterisation is not necessarily the most appropriate one
- Relationships between soil properties, parent material and position in the landscape are reflected in soil-landscape, soil and land resources and land resource area mapping and described in accompanying reports available online through eSPADE (NSW)
- Digital soil maps (DSMs) provide predictions of soil properties at 90 or 100 m resolution and are available through eSPADE for NSW, and the Soil and Landscape Grid of Australia (SLGA), for all of Australia
- The project is currently testing a 5-step PAWC estimation approach at sites across the Liverpool Plains involving: 1) identification of soil-landscape unit., 2) observations on position within the soil-landscape units, 3) comparison with APSoil PAWC characterisations in the same or similar soil-landscape unit, 4) use of digital soil mapping products to compare properties and identify risk of salinity subsoil constraints, 5) adjustment of PAWC based on local conditions.
The Authors stipulate that the examples below are from currently successfully cropped sites, and any constraints mentioned are just constraints to PAWC and do not necessarily reflect the overall productivity of a paddock.
Plant available water and crop management decisions
A key determinant of potential yield in dryland agriculture is the amount of water available to the crop, either from rainfall or stored soil water. In the GRDC Northern Region the contribution of stored soil water to crop productivity for both winter and summer cropping has long been recognised. The amount of stored soil water influences decisions to plant or wait (for the next opportunity or long fallow), to sow earlier or later (and associated variety choice) and the input level of resources such as nitrogen fertiliser.
The amount of stored soil water available to a crop - Plant Available Water (PAW) – is affected by pre-season and in-season rainfall, infiltration, evaporation and transpiration. It also strongly depends on a soil’s Plant Available Water Capacity (PAWC; Figure 1), which is the total amount of water a soil can store and release to different crops. The PAWC, or ‘bucket size’, depends on the soil’s physical and chemical properties as well as the crop being grown.
Over the past 20 years, CSIRO in collaboration with state agencies, catchment management organisations, consultants and farmers has characterised PAWCs for more than 1000 sites around Australia. This data is publicly available in the APSoil database, including via Google Earth and in the ‘SoilMapp’ application (see Resources section).
But what should be done when you are not in the position to have a local field PAWC characterisation and there is no APSoil PAWC characterisation on-site?
The APSoil database provides geo-referenced data (i.e. data linked with locations on a map). The nearest APSoil PAWC characterisation may, however, not be the most appropriate as its surface and subsoil properties could be quite different. The challenge is, therefore, to find a PAWC characterisation for a soil with similar properties to the one on your site.
The soil properties that affect PAWC (texture, stones and gravel, chemical constraints) change within the landscape as a function of parent material and how the soil formed, or how soil material got there. These aspects are reflected in soil-landscape models that underpin soil survey maps produced by state government departments and other research organisations.
This paper uses examples from the Liverpool Plains to illustrate how you can use the available PAWC data, along with soil-landscape information and local observations to inform estimation of PAWC on your farm.
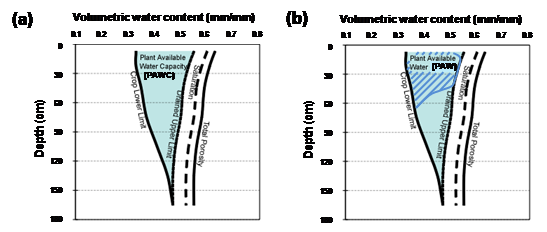
Figure 1. (a) The Plant Available Water Capacity (PAWC) is the total amount of water that each soil type can store and release to different crops and is defined by its Drained Upper Limit (DUL) and its crop specific Crop Lower Limit (CLL); (b) Plant Available Water (PAW) represents the volume of water stored within the soil available to the plant at a point in time. It is defined by the difference between the current volumetric soil water content and the CLL.
Plant Available Water (PAW)
Plant available water is the difference between the CLL and the volumetric soil water content (mm water / mm of soil) (Figure 1b). The latter can be assessed by soil coring (gravimetric moisture which is converted into a volumetric water content using the bulk density of the soil) or the use of soil water monitoring devices (requiring calibration in order to quantitatively report soil water content).
An approximate estimate of PAW can be obtained from knowledge of the PAWC (mm of available water/cm of soil depth down the profile) and the depth of wet soil (push probe or based on a feel of wet and dry limits using an uncalibrated soil water monitoring device).
Field measurement of PAWC
The PAWC can be determined in the field following procedures described in the GRDC PAWC Booklet ‘Estimating plant available water capacity’ (Burk and Dalgliesh, 2013). This method will usually provide the best estimate for a location of interest, although there are some pitfalls and common mis-characterisation issues that need to be avoided (Verburg et al., 2017).
Where to find existing information on PAWC for Liverpool Plains soils
Characterisations of PAWC for 26 soils within the Liverpool Plains are among more than 1100 soils across Australia available in the APSoil database. The database software and data can be downloaded from http://www.apsim.info/Products/APSoil.aspx. The characterisations can also be accessed via Google Earth (KML file from APSoil website) and in SoilMapp, an application for iPad and Android devices. The yield forecasting tool Yield Prophet® also draws on this database. See our Update paper from two years ago (Verburg et al. 2018) for instructions how to find the APSoil sites.
Most cropping in the Liverpool Plains is practiced on heavy (high clay content) shrink-swell soils (Vertosols) of the plains and foot slopes. These soils are of basaltic origin, with many having relatively large PAWCs of 200-350mm. There are, however, some subtle differences in response to clay mineralogy (related to parent material composition) and texture (e.g. inclusion of sand or fine gravel), which explain the variation within that range. Larger variation in PAWC within the Liverpool Plains is, however, caused by subsoil constraints, in particular subsoil salinity. Where present, these constraints can limit root water uptake quite dramatically and reduce PAWC by as much as 50%.
How to find an APSoil that has similar soil properties
Extrapolating from the APSoil PAWC characterisations to predict PAWC at a location of interest is not an easy task. The nearest APSoil PAWC characterisation may not be the most appropriate as its soil properties could be quite different. The presence or level of subsoil constraints may also vary. The challenge is, therefore, to find an APSoil PAWC characterisation for a soil with similar properties.
In many landscapes, including the Liverpool Plains, soil properties are tightly linked to a soil's parent material, development and position in the landscape. These same aspects underpin the many soil and land resource surveys that have been carried out over the years and that are increasingly becoming available on-line. The NSW government manages eSpade, an online portal for soil resource information. The mapping on eSpade divides the landscape into Soil Landscape Units (SLUs) https://www.environment.nsw.gov.au/eSpade2. We can draw on this information to assist with PAWC prediction.
Current evaluation of a five-step PAWC estimation method
Our current GRDC Project ‘Methods to predict plant available water capacity (PAWC)’ has developed a 5-step approach to estimate PAWC using the available information and is currently testing this for sites within the Liverpool Plains (Table 1). The methodology is currently at proof-of-concept stage, but below we will illustrate its application for selected sites within the Liverpool Plains. We hope this will provide insights into how soil properties change within the landscape and what consequences this has for PAWC.
Soils and landscapes of the Liverpool Plains
The Liverpool Plains are characterised by extensive plains with quaternary alluvial deposits originating from the surrounding hills of different age, origin and composition. All the SLUs considered in this paper are alluvial soil landscapes. These are formed by deposition along rivers and streams. The term ‘alluvium’ refers to deposits resulting from the action of rivers and streams and an ‘alluvial plain’ refers to the landform pattern that includes the stream channel (stream bed and bank) and plain. A flood plain is an alluvial plain which is ‘frequently active’ (meaning that it floods with an interval of 50 years or less). Almost all the cropped soils on The Liverpool Plains are Vertosols characterised by a clay-size-particle content of 30 percent or more. Salinity constraints are the main source of variation in PAWC in the alluvial plains and can have a large effect on PAWC. While Electrical Conductivity (EC) can have confounding effects from carbonates or gypsum, the chemical analyses in this case study and that of the earlier work documented in Verburg et al. (2017) all indicated good correlation between EC and chloride.
Table 1. 5 Step extrapolation process (based on findings from Output 4 of project CSP00210).
Step | Description | Process/Resource |
|---|---|---|
1 | Identify the Soil Landscape Unit (SLU) your site of interest belongs to. | Soil and land resource mapping available through eSPADE. |
2 | Consider the descriptions of your SLU and landscape position to assess whether they match the local situation. Consider slope position in footslope SLUs. Draw on local landscape and soil observations to help with this assessment. | Soil and land resource mapping available through eSPADE. |
3 | Identify possible APSoil PAWC profiles that fall within the SLU identified. This will give you a starting estimate for PAWC and possible PAWC profiles. Compare site location and local soil information with that available for the APSoil profiles. Future Digital Soil Map (DSM) of PAWC for the whole profile may provide a direct ballpark estimate. | APSoils and SLU rules of thumb in Verburg et al. (2017) (and Stockmann et al.) (unpublished report) APSoil database including via SoilMapp app Future DSM-based PAWC product for the whole profile |
4 | Use DSM products to assess
| Evaluate the soil and Landscape Grid of Australia (SLGA) soil attributes for topsoil and subsoil clay% and sand% and NSW Office of Environment and Heritage (OEH) eSpade for subsoil EC. The SLGA pedotransfer function (PTF) derived PAWC, CLL and DUL predictions overlaid with the SLU linework from Step 1. |
5 | Adjust the PAWC or APSoil PAWC profile for local conditions based on the assessment in Step 4 and any available local information on soil texture, soil depth or subsoil constraints. Paddock yield history may also provide guidance. Consult local soil measurements e.g. from soil sampling at sowing or obtain informal observations e.g. during the digging of posts. Chloride values exceeding 600 mg/kg are likely to increase CLL and reduce PAWC. Compare the shape of unconstrained and constrained APSoil PAWC profiles. | Based on available data the grower or advisor may have. Seek guidance on likely reductions from subsoil constraints for different size PAWC. If no particle size data is available, consider determining soil texture by hand when conducting soil chloride tests. Compare the PAWC profiles of unconstrained and constrained APSoils or by viewing in APSoil database, Google Earth or SoilMapp. |
Table 2. APSoil characterisations by soil landscape unit (SLU) in the Liverpool Plains with PAWC
(to 180 cm or rooting depth).
APSoil | SLU | PAWC (mm)* | Soil | Soil constraints to PAWC |
|---|---|---|---|---|
119 | Conadilly | 204S, 207Co, 282W | Black Vertosol | |
123 | Conadilly | 165M, 210Ch, 273S, 237Co, 264W | Grey-Black Vertosol | |
866 | Conadilly | 249W | Black Vertosol | Salinity constraints from 90 cm |
869 | Conadilly | 245W | Black Vertosol | Salinity constraints from 120 cm |
1165 | Conadilly | 135Co-178Co | Grey Vertosol | Constrained, cause unknown |
1305 | Conadilly | 305S | Black Vertosol | (to 150 cm depth, DUL may be overestimated) |
1309 | Conadilly | 288S | Vertosol | (to 150 cm depth) |
912 | Yarraman | 183W | Vertosol | Constrained, cause unknown |
1306 | Yarraman | 145Ch, 205C, 261W | Vertosol | Salinity constraints from 110 cm |
1307 | Yarraman | 64Ch, 116C, 129W | Vertosol | Salinity constraints from 50 cm |
1308 | Yarraman | 243W | Vertosol | Salinity constraints from 130 cm |
1166 | Quirindi Creek | 215Co-216S | Grey Vertosol | Coarser material at depth |
1169 | Upper Coxs | 221S | Black Vertosol | Constrained below 150cm |
1170 | Bando | 116W-131M | Grey Vertosol | Salinity constraints (variable levels of salinity near site) |
1171 | Bando/Lesley Rd | 245W-253W | Grey Vertosol | |
122 | Lower Coxs | 149M, 200Ch, 248W, 257S, 278Co | Grey-Black Vertosol | |
1172 | Lower Coxs | 246S | Brown Vertosol | Salinity constraints below 150 cm |
1173 | Burburgate | 183W | Brown Vertosol | (may be underestimated) |
867 | Lever Gully | 292W | Vertosol | |
1167 | Lever Gully | 252S | Black Vertosol | |
1168 | Lever Gully | 283W | Black Vertosol | |
868 | Windy Creek | 292W | Vertosol | |
94 | Noojee | 254S, 272W, 302Co | Black Vertosol | |
127 | Noojee | 188M, 221Ch, 302W, 329S, 356Co | Grey-Black Vertosol | |
128 | Noojee | 186M, 225Ch, 300W, 324S, 351Co | Grey-Black Vertosol | |
1174 | Gunnebene | 149Ch, 177S, 211W | Grey Vertosol | (to 150 cm depth) |
*W=wheat, C=canola, Co=cotton, S=sorghum, Ch = chickpea, M=mungbean
The Authors stipulate that the examples below are from currently successfully cropped sites, and any constraints mentioned are just constraints to PAWC and do not necessarily reflect the overall productivity of a paddock.
Example 1. Determining the effects of subsoil constraints on PAWC
Step 1. Identify your site located within the Yarraman SLU (Figure 2)
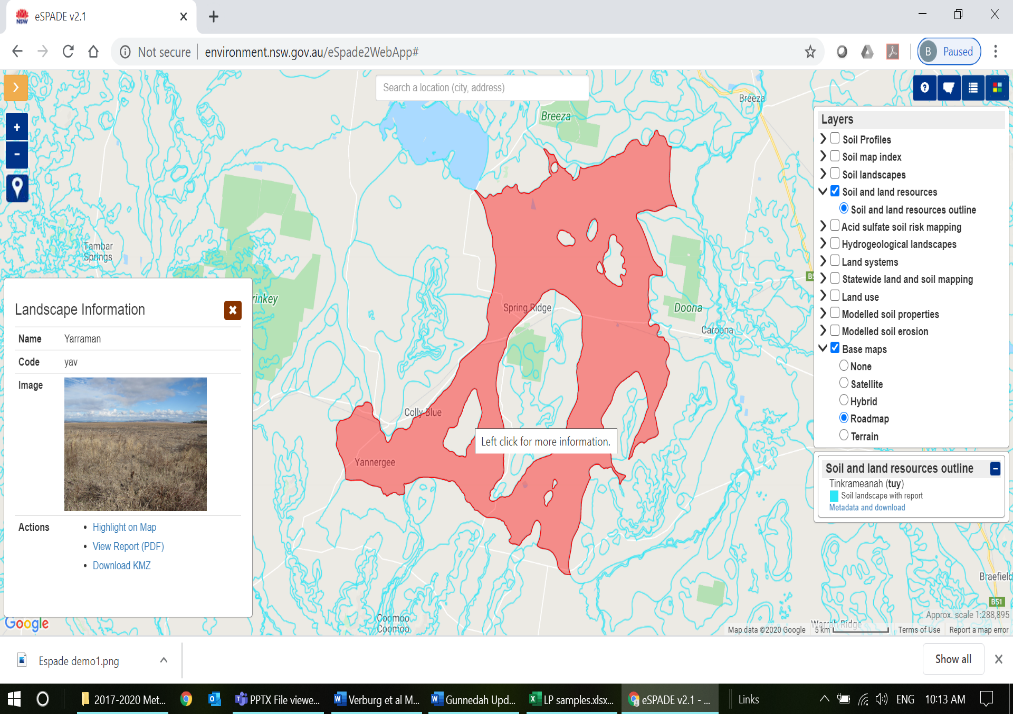
Figure 2. The landscape unit “Yarraman” surrounding Spring Ridge NSW, NSW OEH (2011)
Step 2. Consider the description of your SLU (SLU Report) and the landscape position
The Yarraman LSU report (NSW OEH,2011) describes the soil landscape as follows:
Landscape— Level to gently inclined extensive drainage plains and floodplains on basaltic alluvium in the Goran Basin Plains. Slopes <1%, local relief <9 m, elevation 290-360 m. Closed grassland mostly cleared for agriculture.
Soils— Very deep, poorly drained self-mulching grey vertosols (grey clays) with very deep, poorly drained black vertosols (black earths) in less waterlogged areas.
Qualities and limitations— High soil fertility, widespread foundation hazard, widespread productive arable land, widespread recharge zone, localised discharge zone, widespread salinity hazard, localised wind erosion hazard, localised gully erosion hazard, localised streambank erosion hazard, widespread high run-on, localised poor drainage, localised permanently high watertables, widespread seasonal waterlogging, widespread flood hazard. NSW OEH (2011)
Step 3. Identify possible APSoil sites that fall within you SLU
Overlay the “Yarraman” SLU with the APSoil KMZ file in Google Earth, (Figure 3). This shows the distribution of APSoil sites in the area and in within the Yarraman SLU. Note, that whilst most APSoil sites are geo-referenced, some as in this case are not. APSoil sites 1306, 1307 and 912 are centred on the town of Spring Ridge, however the descriptions state that they belong in the Yarraman SLU (Figure 4).
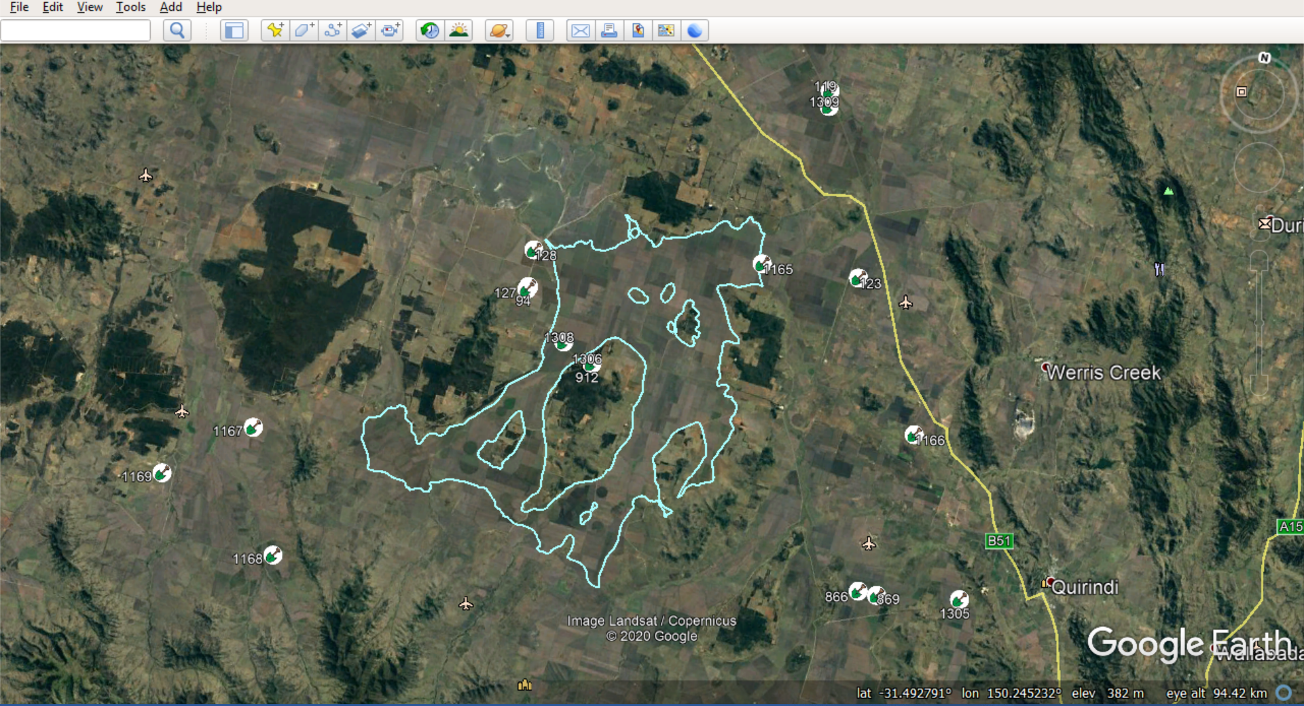
Figure 3. APSoil sites distribution in relation to the Yarraman SLU
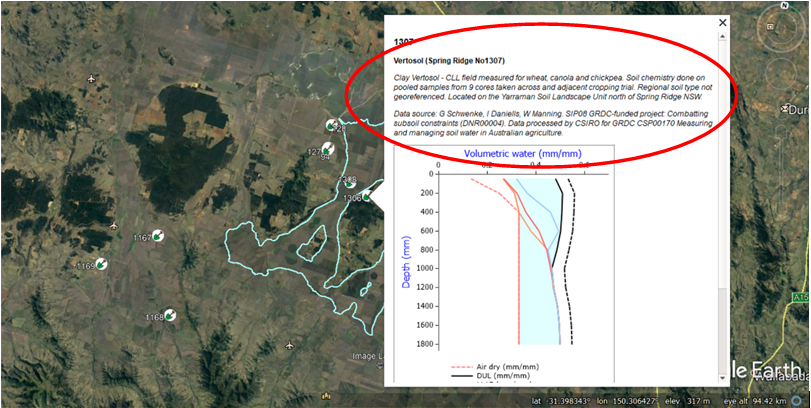
Figure 4. APSoil site 1307 description, which belongs to the Yarraman SLU. However, its location is centred on the town of Spring Ridge.
Step 4. Use soil texture and salinity properties provided for the Yarraman APSoil site as well as DSM products to assess whether your site has similar %clay contents and whether soil salinity constraints need to be considered.
As previously mentioned, salinity constraints are the main source of variation in PAWC in the alluvial plains and can have a large effect on PAWC. Water soluble salts can accumulate in soils. In most cases, these are mainly of sodium, but also of potassium, calcium and magnesium, which then may be chlorides, sulfates or carbonates (Hazelton and Murphy, 2007). While EC can have confounding effects from carbonates or gypsum, the chemical analyses in this case study and that of the earlier APSoil characterisations documented in Verburg et al. (2017) all indicated good correlation between EC and chloride content. To estimate the contribution of chloride to EC1:5 in a 1:5 soil:water suspension, where EC is measured as dS/m, use the following conversion ‘EC = 6.64 x %Cl (per weight of soil)’. This assumes that chloride is the dominant ion.
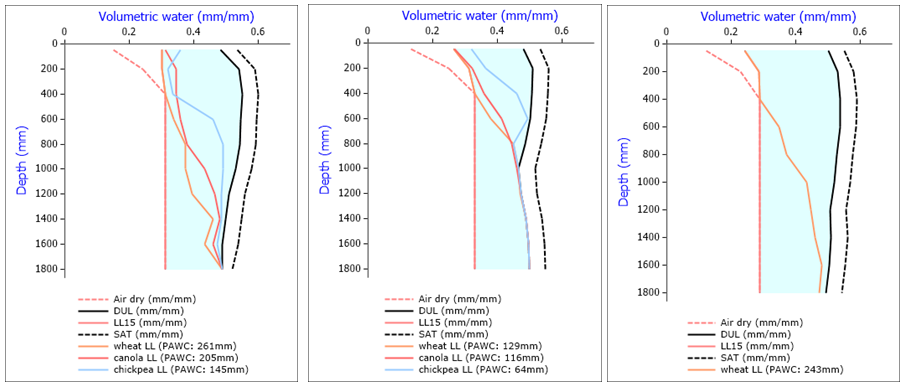
APSoil shows three APSoil sites all of them Grey Vertosol soil types belonging to the Yarraman SLU. These are shown in Figure 5 in a graphical representation of the PAWC. Figure 6 shows the distribution of chloride and clay down the profile.
Figure 5. APSoil 1306, APSoil 1307, APSoil 1308 (left to right respectively)
Figure 6. Chloride content (mg/kg) and clay content (%) distribution for APSoil sites 1306, 1307 and 1308
| APSoil 1306 | APSoil 1307 | APSoil 1308 |
|---|---|---|---|
Soil depth (cm) | Cl (mg/kg) | Cl (mg/kg) | Cl (mg/kg) |
0-15 | 49 | 65 | 21 |
15-30 | 104 | 202 | 3 |
30-60 | 187 | 589 | 11 |
60-90 | 336 | 1537 | 30 |
90-120 | 482 | 2555 | 110 |
120-150 | 1108 | 2797 | 304 |
150-180 | 1206 | 2919 | 562 |
Soil depth (cm) | Clay (%) | Clay (%) | Clay (%) |
0-15 | 69 | 65 | 71 |
15-30 | 81 | 74 | 69 |
30-60 | 81 | 72 | 73 |
60-90 | 77 | 73 | 74 |
90-120 | 71 | 78 | 74 |
APSoil 1307 shows Cl beginning to inhibit growth at about 60cm and completely inhibiting PAWC at 100cm, resulting in a wheat PAWC of 129mm. APSoil 1306 is showing a Cl inhibition of PAWC at 120cm becoming severe at 140cm resulting in a wheat PAWC of 261mm. APSoil 1308 is essentially unconstrained, however Cl may become an issue for very deep-rooted crops. The wheat PAWC is 243mm.
APSoil 1306 has a higher PAW despite having a subsoil constraint compared to APSoil 1308. This is because of the higher clay content giving a slightly higher total water holding capacity and is most likely due to its position in the landscape. PAWC in footslope positions (upslope) with higher elevations could be considerably reduced due to soil depth restrictions. However, some of the in-situ basalt soils found on the footslopes (Noojee SLU adjacent to the Yarraman SLU) are particularly high in clay content which results in a higher PAWC. These are not alluvials soils; but are basalt soils that have developed insitu.
Using a combination of these measured soils, your known position and some local knowledge like understanding where water accumulates (suggesting possible chloride hotspots), we can choose an APSoil characterisation based on EC and clay content.
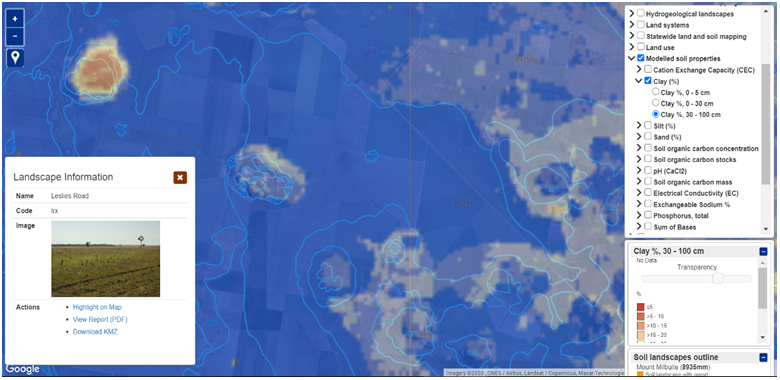
Figures 7, 8 and 9 below show the predicted EC (Figure 9) and clay layers (Figure 7) from eSpade. It should be noted that the predictions are for large depth intervals in the topsoil (0-30cm) and subsoil (30-100cm), so any extra data from soil tests etc would be useful to help better inform your decision.
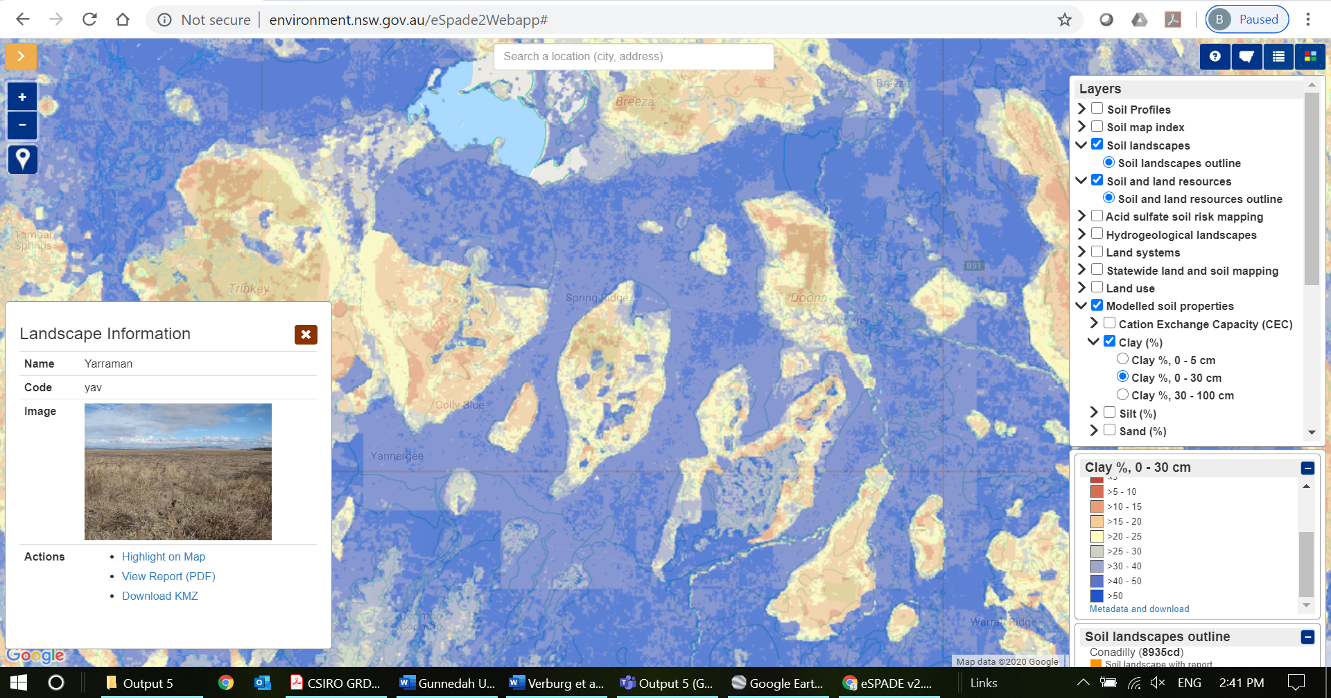
Figure 7. Predicted topsoil clay content at 0-30cm (NSW OEH 2011)
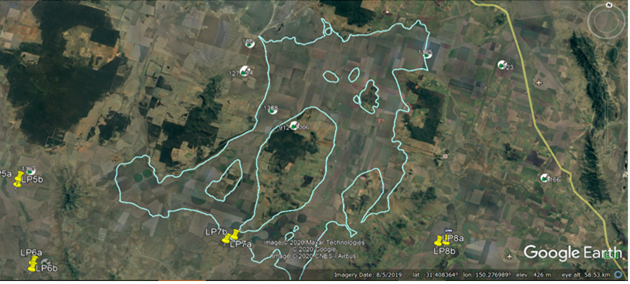
Figure 8. Yarraman SLU distribution (NSW OEH, 2011)
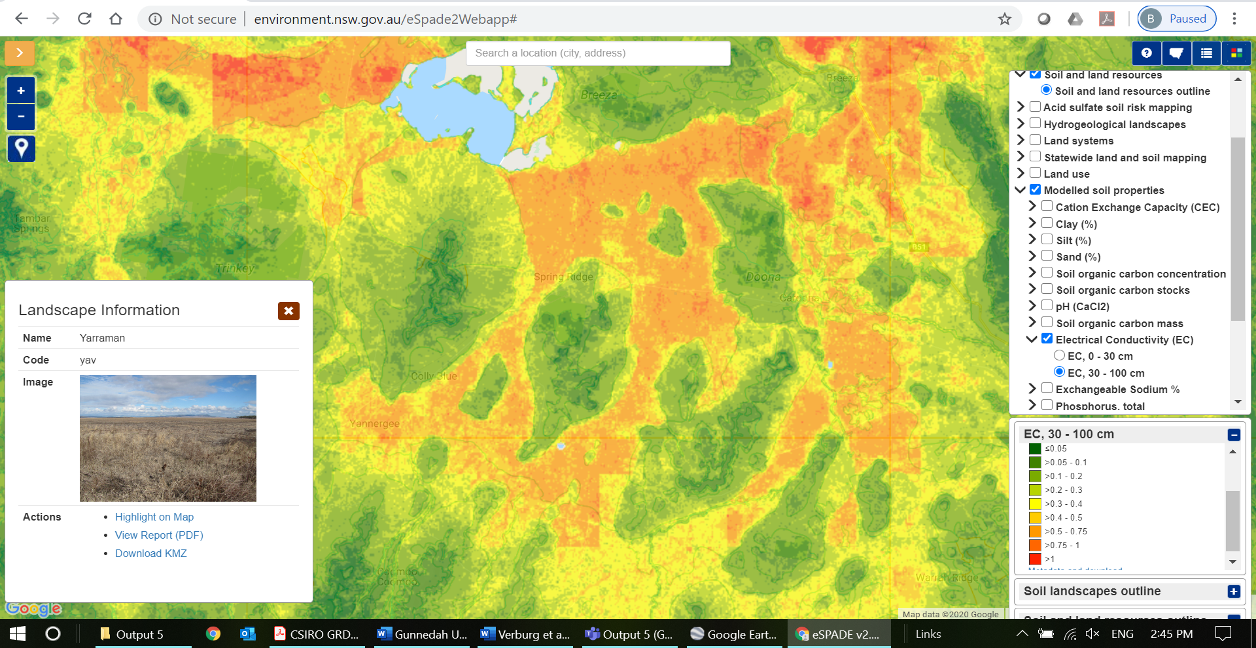
Figure 9. Predicted subsoil EC1:5 (dS/m) at 30-100cm (NSW OEH, 2011)
Example 2 What to do when there is no APSoil characterisations in your SLU?
The following example uses the Leslies Road SLU that does not have an APSoil site characterisation.
Step 1. and 2. Identify your site and consider the description of your SLU (SLU report) and landscape position.
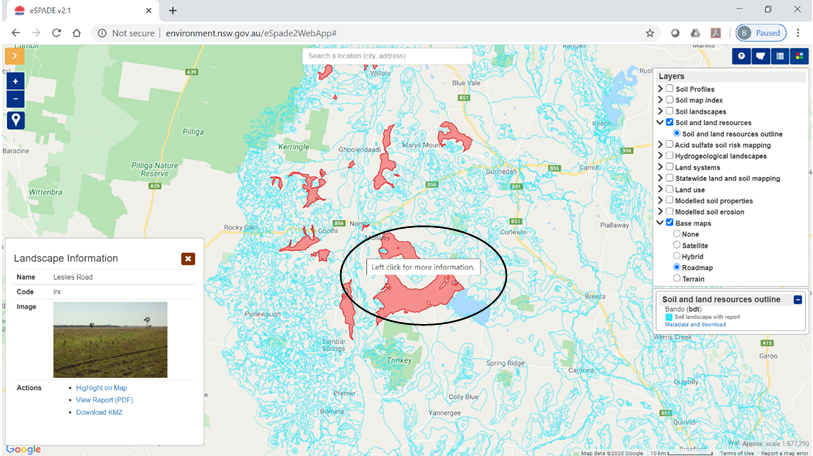
The Leslies Road SLU (Figure 10) is a large and widely dispersed SLU within the Liverpool Plains.
The Leslies Road SLU report describes the soil landscape as follows (NSW OEH, 2011):
Landscape— Level to gently inclined lower footslopes, drainage plains, and alluvial fans on Quaternary alluvium derived from Jurassic and minor Tertiary basalts of the Mullaley Hills and Liverpool Plains. Slopes 0 - 2%, local relief <3m, elevation 260 - 380 m. Open woodland and closed grassland, mostly cleared for agriculture.
Soils— Giant, imperfectly drained calcareous self-mulching black vertosols (black earths), with deep, rapidly drained red and brown ferrosols and dermosols (euchrozems) and brown and red vertosols (brown and red clays) on lower footslopes and upper drainage plains and giant, moderately well drained self-mulching brown and black vertosols (brown clays and black earths) on lower drainage plains. Giant, imperfectly drained self-mulching grey vertosols (grey clays) in poorly drained areas, such as lower margins.
Qualities and limitations— high soil fertility, widespread foundation hazard, widespread productive arable land, widespread dieback, localised recharge zone, localised discharge zone, localised salinity hazard, localised streambank erosion hazard, widespread high run-on, localised poor drainage, localised permanently high water tables, localised seasonal waterlogging, localised flood hazard. NSW OEH (2011))
Comparison also shows a good correlation between measured chloride and eSpade predicted EC as demonstrated below.
Figure 10. Distribution of the Leslies Road SLU within the Liverpool Plains (NSW OEH, 2011)
Step 3. Identify potential APSoil sites that fall within your SLU
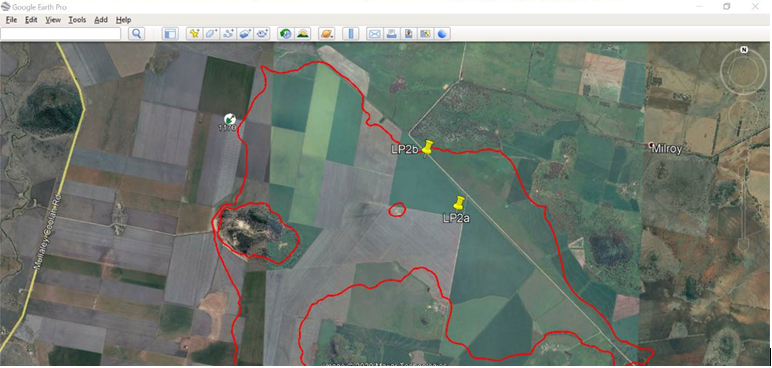
There are APSoil characterisations nearby but none that fall within the Leslies Road SLU boundaries. As suggested in Table 1 Step 3, gather as much local information as you can. In the following, we will demonstrate this for 8 sites that fall within the Leslie Road SLU. Figure 11 shows the SLU boundary overlayed onto Google Earth and the spatial distribution of these sites within one fragment of the Leslie Road SLU. These sites belong to four currently successfully cropped paddocks, with two sites each (a and b) in each paddock. The ‘b’ site is historically a better yielding area of the paddock and the ‘a’ site is anecdotally lower yielding.
Table 3 shows the distribution of particle size (sand, silt and clay) and the ECEC and chloride levels for these sites. (ECEC (cation exchange capacity) is an indication of the cation exchange capacity).
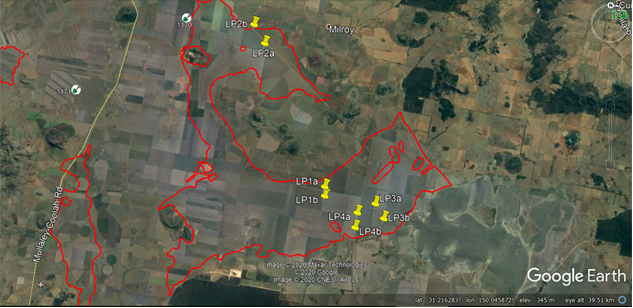
Figure 11. Location of sites (a and b) for four paddocks belonging to the Leslie Road SLU
Table 3. Distribution of soil texture and salinity down the profile for 4 successfully cropped paddocks (1 to 4), and 2 soil profile sites (a and b) within these paddocks
LP_No | Soil Depth | ECEC | Clay (%) | MIR 2-20µm Silt (%) | Sand (%) | Australian Soil Texture Classification | Cl |
|---|---|---|---|---|---|---|---|
1a | 0-15 | 88.89 | 35 | ||||
1a | 15-30 | 70.76 | 70.6 | 20.1 | 9.3 | CLAY | 79 |
1a | 30-60 | 74.6 | 17.9 | 7.5 | CLAY | 269 | |
1a | 60-90 | 75.6 | 18.1 | 6.3 | CLAY | 879 | |
1b | 0-15 |
|
|
|
|
| 32 |
1b | 15-30 | 74.83 | 60.6 | 27.0 | 12.4 | SILTY CLAY | 31 |
1b | 30-60 | 78.6 | 16.5 | 4.9 | CLAY | 34 | |
1b | 60-90 | 151 | |||||
2a | 0-15 | 41.02 |
|
|
|
| 10 |
2a | 15-30 | 45.07 | 65.6 | 23.7 | 10.7 | CLAY | 13 |
2a | 30-60 | 76.6 | 16.5 | 6.9 | CLAY | 13 | |
2a | 60-90 | 74.6 | 18.1 | 7.3 | CLAY | 35 | |
2b | 0-15 |
|
|
|
|
| 16 |
2b | 15-30 | 54.51 | 63.6 | 19.9 | 16.5 | CLAY | 27 |
2b | 30-60 | 71.6 | 16.1 | 12.3 | CLAY | 42 | |
2b | 60-90 | 80.6 | 10.6 | 8.8 | CLAY | 125 | |
3a | 0-15 | 46.60 |
|
|
| 27 | |
3a | 15-30 | 51.97 | 62.8 | 18.0 | 19.2 | CLAY | 137 |
3a | 30-60 | 77.6 | 9.1 | 13.3 | CLAY | 542 | |
3a | 60-90 | - | 1303 | ||||
3b | 0-15 |
|
|
|
|
| 48 |
3b | 15-30 | 76.48 | 72.6 | 15.1 | 12.3 | CLAY | 60 |
3b | 30-60 | 71.6 | 16.7 | 11.7 | CLAY | 218 | |
3b | 60-90 | 75.6 | 15.1 | 9.3 | CLAY | 619 | |
4a | 0-15 |
|
|
|
|
| 21 |
4a | 15-30 | 55.51 | 63.6 | 17.8 | 18.6 | CLAY | 22 |
4a | 30-60 | 77.6 | 12.2 | 10.2 | CLAY | 135 | |
4a | 60-90 | 77.6 | 13.6 | 8.8 | CLAY | 572 | |
4b | 0-15 |
|
|
|
|
| 26 |
4b | 15-30 | 62.41 | 74.6 | 16.7 | 8.7 | CLAY | 18 |
4b | 30-60 | 71.6 | 18.1 | 10.3 | CLAY | 19 | |
4b | 60-90 | 77.6 | 16.3 | 6.1 | CLAY | 105 |
Step 4. Use DSM products to assess whether your site has similar %clay contents and whether soil salinity constraints need to be considered
Figure 12 below shows the spatial distribution, the predicted EC and clay contents for the subsoil at 30 to 100cm for the northern most sites LP2a and LP2b. These soils are similar in clay content in the 30 to 100cm layer and so the expectation is that they will hold similar amounts of water if unconstrained. The chloride levels are where the differences in these soils become apparent. This is typical for soils on the Liverpool Plains. LP2b is showing signs of increasing salinity in the deeper layers. Further investigation of chloride at depth is warranted and may result in the PAWC being lower at depth than that of LP2a. This is counter to the evidence that site LP2b is a higher yielding site.
This may be explained by further investigation of the PSA which shows that LP2b has a significantly higher sand content in the top layers, this increases the hydraulic conductivity of the soil, (the rate that water infiltrates the soil), this will allow better infiltration of rain and hence a wetter soil not necessarily a bigger PAWC. Table 1 step 5 addresses this buy suggesting paddock yield history and measurement of soil water at sowing be considered.
In terms of selecting an APSoil PAWC for this site, APSoil 1170 is very close but just outside the boundaries of the Leslies Road SLU in the Bando SLU. This may not be a problem as the SLU boundaries may not be perfect. However as can be seen on the eSpade EC layer prediction (figure 12), it is in an area of potentially high chloride. An adjustment to the crop lower limit to suit a more unconstrained environment could suffice. But, the nearest APSoil may not be the best one, APSoil 1171 further to the west and also in the Bando SLU has a less constrained PAWC of 253mm for wheat as compared to 1170 which has a PAWC for wheat of 116mm and looks to be a more appropriate PAWC characterisation. Refer to Figure 18.
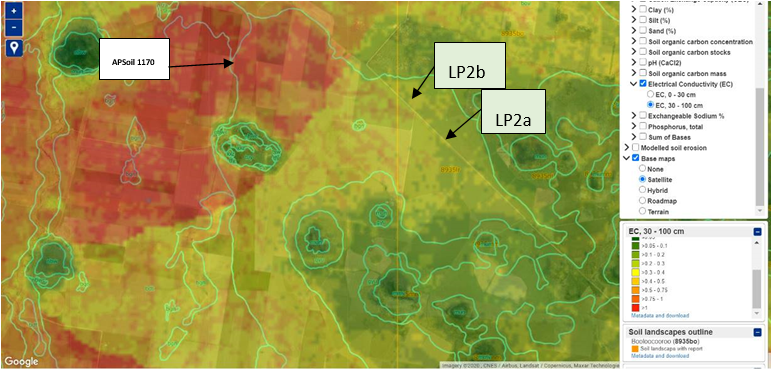
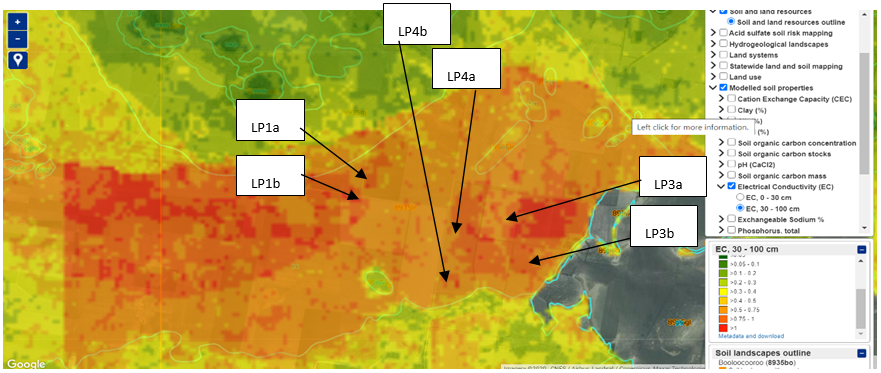
Figure 12. (Predicted EC1:5 (dS/m) (top), and clay content (%) (bottom) for the subsoil at 30-100cm depth for site ‘a’ and ‘b’ of Paddock 2 (LP2a and LP2b) whose locations are also shown (middle) (NSW OEH, 2011).)
The sites LP 1,3 and 4 are in the southern part of the SLU, Figures 13,14 and 15 show the spatial distribution of the sites and the predicted EC and clay contents for the subsoil at 30 to 100 cm. These soils are similar in clay content in the 30 to 100cm layer and so the expectation is that unconstrained they will hold similar amounts of water. Some of the sites have lighter textured clays in the surface which will lower the surface PAWC but will not have a great impact on the total profile PAWC. The chloride levels are where the differences in these soils become apparent. This is typical for soils on the Liverpool Plains.
LP1a and LP1b (Figure 15) are comparable to LP2a and LP2b in the north of the SLU fragment. They are similar in clay content and the only difference seems to be chloride at depth (Figure 13), LP1a is showing increasing chloride below 60cm which points to a restriction in PAWC. LP1b also has a lighter textured surface with a higher sand and silt percentage. As discussed previously, this will increase the hydraulic conductivity of the soil allowing better water capture. This coupled with the fact that LP1a may have a PAWC restriction at depth could lead to a better performance of this area of the paddock.
LP3a and LP3b (Figure 14) are similar to the above examples with LP3a showing a chloride constraint to PAWC at depth which is offset by a lighter textured surface. LP3a is a small portion of the paddock showing a restraint to PAWC beginning in the 60 to 90cm layer.
LP4a and LP4b (Figure 14) illustrates one of the issues that can come from this process. Both sites look to be unconstrained and of the same clay content according to the modelling on eSpade (Figure 13, Figure 14). The modelled soil property predictions sourced from eSpade are based on previously collected soil legacy data which is extrapolated to landscape scale and as such will not be able to show some isolated areas of soil constraints. There are some differences in soil properties and chemistry that may affect PAWC evident in the chemistry (Table 3). LP4a has an increasing chloride constraint below one meter as the chemistry though incomplete, shows an upward trend. However, the PSA in the surface shows a lower clay content and hence a higher percentage of silt and sand. This gives this soil a better infiltration rate and it may be more effective in capturing rainfall and can thus fill the bucket more effectively offsetting the increasing chloride levels at depth.
This demonstrates the importance of some corroborating data as outlined in Table 1 Step 5.
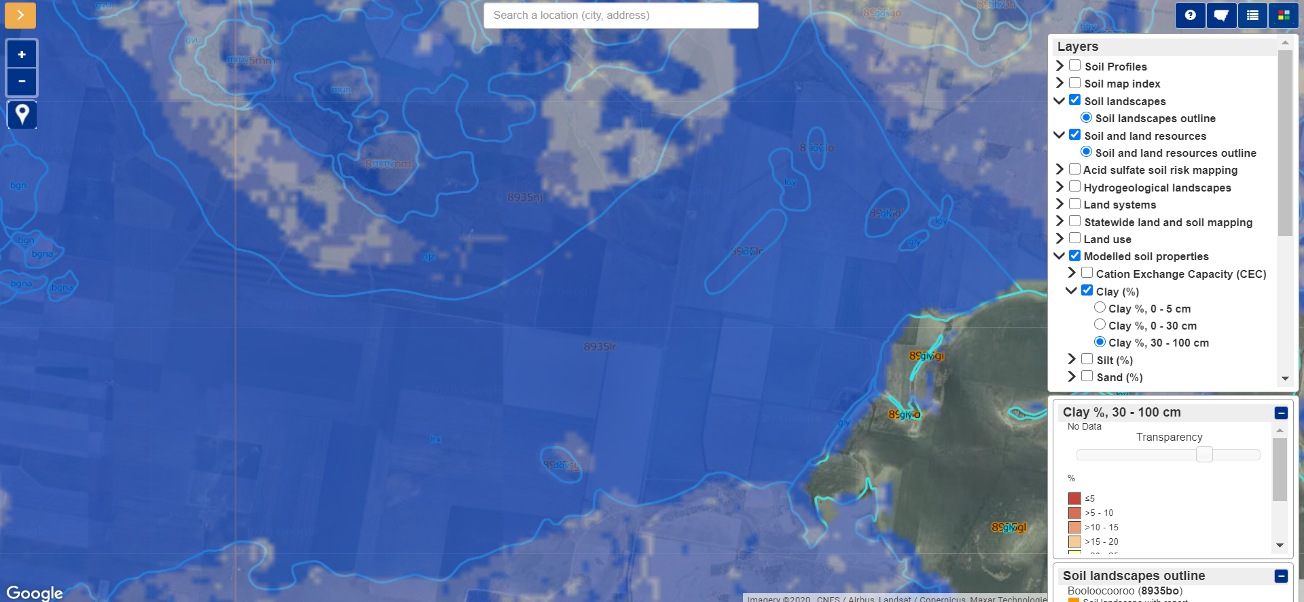
Figure 13. Predicted clay content for the subsoil at 30-100 cm, for paddock site LP1 a and b, LP3 a and b, and LP4 a and b (NSW OEH, 2011)
Figure 14. Predicted EC1:5 for the subsoil at 30-100 cm, for paddock site LP1 a and b, LP3 a and b, and LP4 a and b (NSW OEH, 2011)
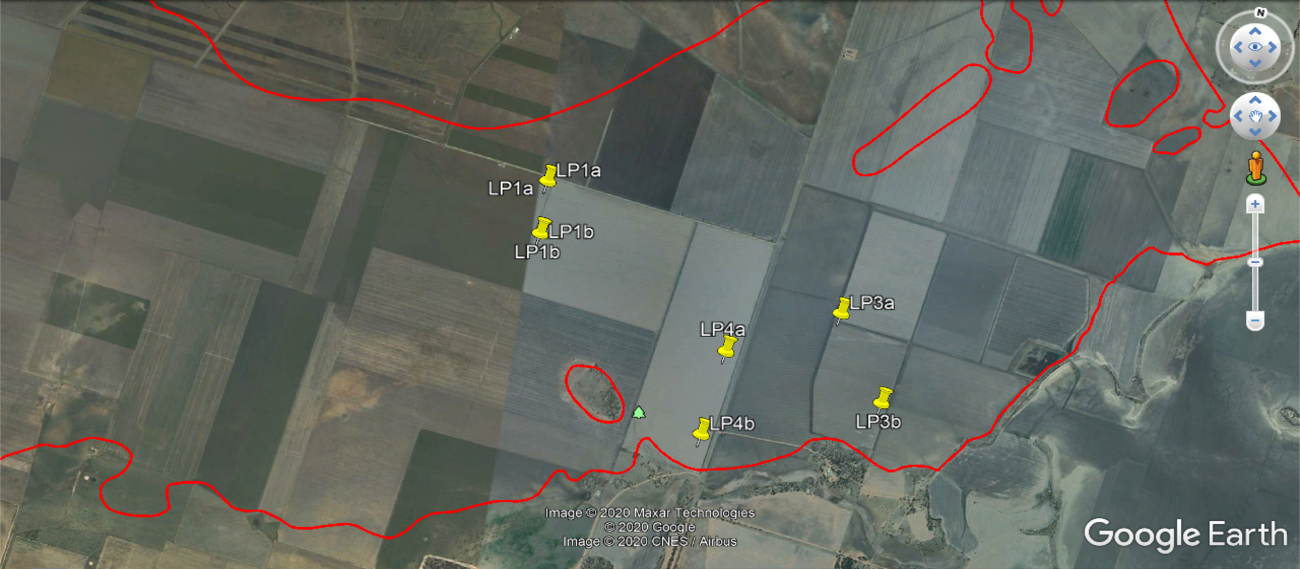
Figure 15. Location of paddock sites LP1 a and b, LP3 a and b, and LP4 a and b within the Leslies Road SLU (NSW OEH, 2011)
Step 5. Selecting APSoil characterisations for the Leslies road SLU
Look for APSoil characterisations firstly close to the site, notably for Leslies Road SLU the Bando SLU, check that they are within the expected PAWC range. Investigate soil elements that effect PAWC like clay content, EC and chloride levels. Consider preplant soil testing for water, and sub-soil constraints.
Look to the SLU report in eSpade and evaluate the ‘Soils, Landscape, Qualities and Limitations’, headings to help inform your knowledge of the soil provenance and landscape variations (Figure 17).
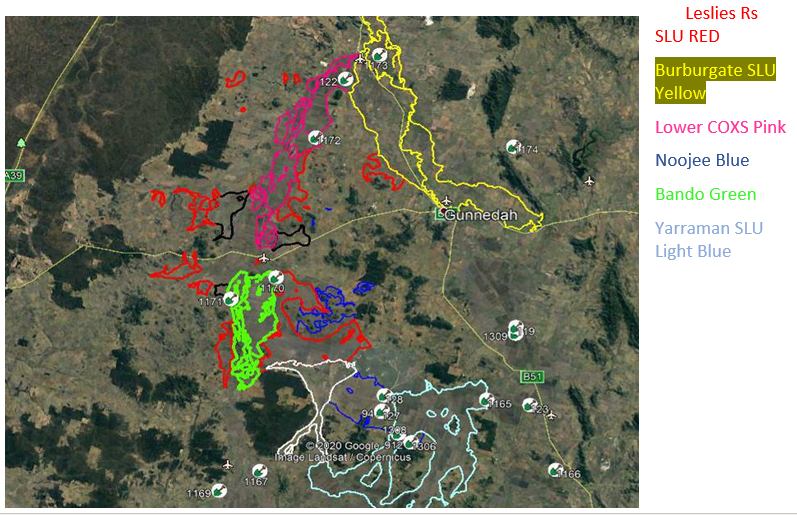
Because the Leslies Road SLU is fragmented, you could also look for adjacent SLUs of other fragments such as Burburgate, Lower Coxs and Noojee. These SLUs have APSoil characterisations that may be relevant and may only require minor modification. Look for similarities in chloride and clay content (Figure 16).
Figure 16. Distribution of different SLUs around Leslies Road fragments and possible APSoil characterisations.
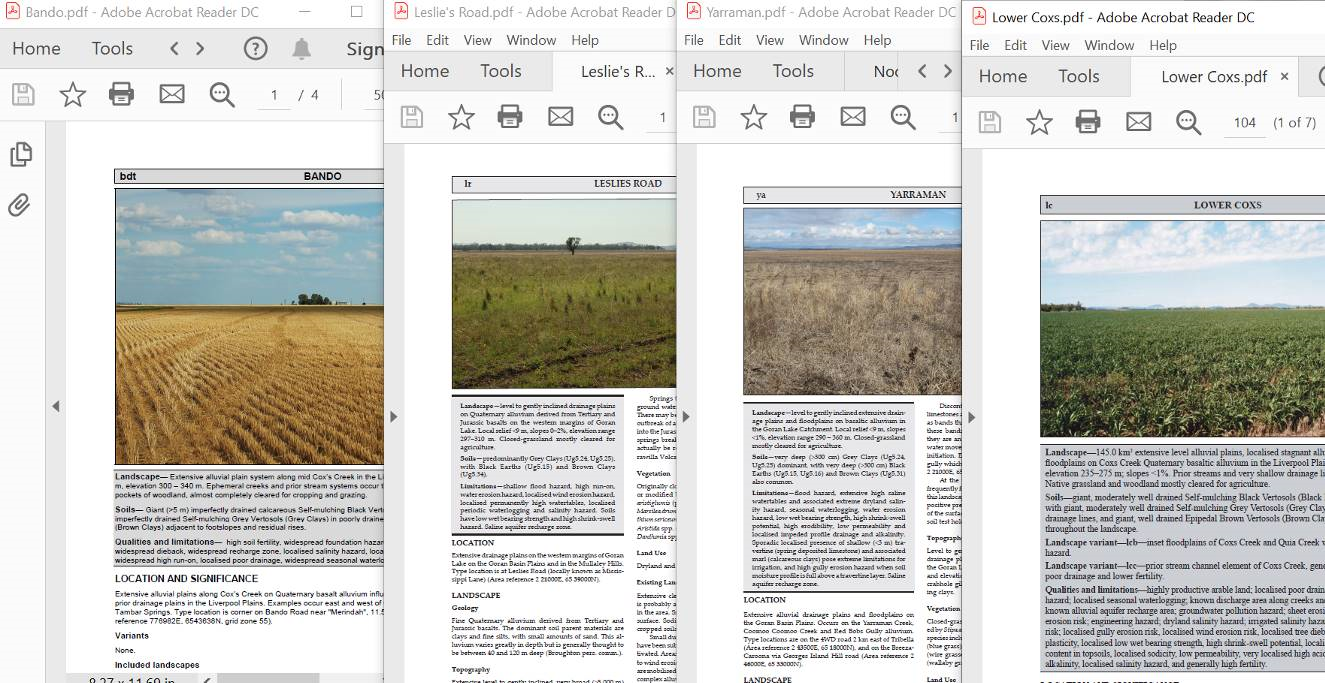
Figure 17. Examples of SLU reports
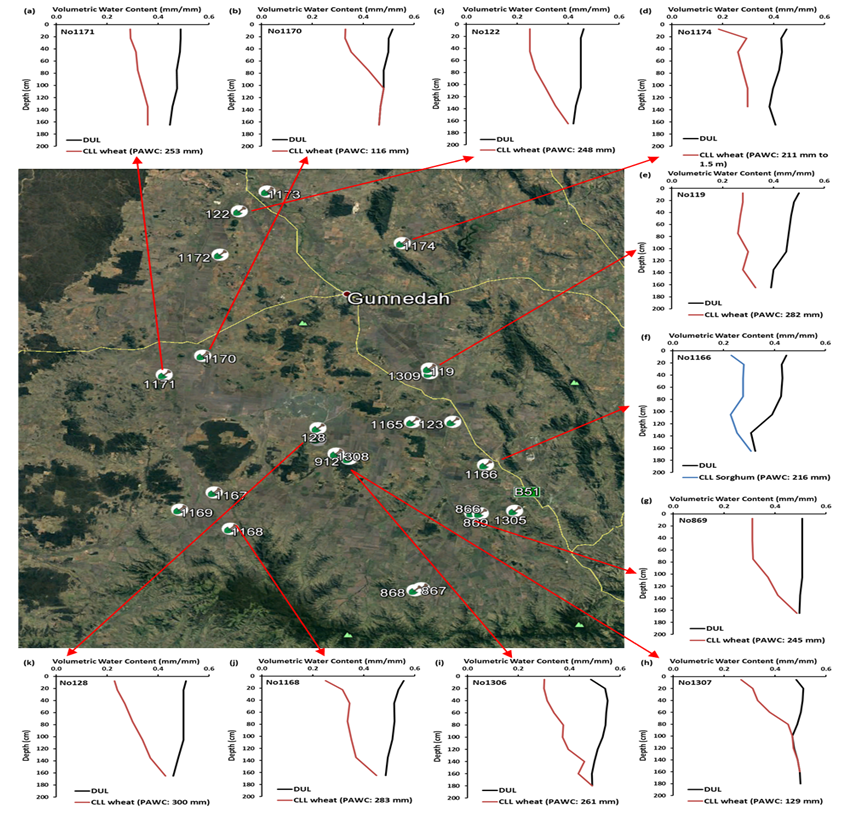
Figure 18. The different PAWCs for APSoil sites found on The Liverpool Plains. (Verburg et al. 2018)
Care must be taken when deciding which nearby PAWC to select, as these can change considerably in relation to constraints which can be seen in Figure 17.
Conclusions
From the preceding examples we can see that it is possible to estimate PAWC with some certainty, provided we use a consistent approach and understand some of the properties and provenance of our soils.
The importance of monitoring soil water over time with coring or water monitoring devices cannot be understated, as it informs a better understanding of PAWC. Soil testing for subsoil constraints is also important to understand the availability of soil water to plants. Testing of subsoil constraints can be done over time and in conjunction with nutrient testing. Gaining an understanding of how soil parent material and landscape position can affect PAWC will assist in choosing a soil characterisation where there are none close by. Digital Soil Maps (DSMs) such as available in eSpade and through the Soil and Landscape Grid of Australia are not generally high resolution, but they are an important tool when trying to understand landscape processes. eSpade also provides access to specific soil landscape reports and modelled soil properties and is an excellent tool for the Liverpool Plains.
Acknowledgements
The research undertaken as part of this project is made possible by the significant contributions of growers through both trial cooperation and the support of the GRDC, the authors would like to thank them for their continued support. We also gratefully acknowledge the contributions of CSIRO colleagues and many collaborators and farmers to the field PAWC characterisations. In the Liverpool Plains these included Dirk Richards and Michael Bange (CSIRO, Narrabri), George Trumann (LLS). The verification of stepwise prediction used information from sites of the National Paddock Survey project (Harm van Rees, Jeremy Whish, Roger Lawes and Matt Gardiner) and benefited from discussions with consultants Pete McKenzie and Jim Hunt. The Authors especially thank Rob Davidson and Hugh Simpson for their input and assistance in the preparation of this paper. The information on PAWC presented in this paper heavily draws on the work over many years by Neal Dalgliesh (CSIRO). Discussions with him and others, including with those involved with soil-landscape mapping in NSW (Neil McKenzie, Rob Banks, Brian Murphy and Neroli Brennan) were invaluable for the development of concepts and ideas presented in this paper.
Resources
APSoil database (includes link to Google Earth file)
eSPADE v2.1 (soil-landscape and land systems mapping and reports, reports on soil characterisation sites from various surveys)
Soil and Landscape Grid of Australia
SoilMapp (soil maps, soil characterisation, archive and APSoil sites): Apple iPad and Android app; documentation
SoilWaterApp: Apple iPad app for estimating soil water during fallow and crops
References
Burk, L. and Dalgliesh, N. (2013) Estimating plant available water capacity.
Dalgliesh, N. (2014) Practical processes for better soil water management. GRDC Update paper.
Fritsch, S. and Wylie, P. (2015) Managing the yield gap to achieve your yield potential on the western Downs. GRDC Update paper.
Hazelton, P. and Murphy, B. (2007). Interpreting soil test results: What do all the numbers mean? CSIRO Publishing, Collingwood, Australia.
NSW OEH (Office of Environment and Heritage) (2011) SLAM Soil Landscape Report for Liverpool Plains v 1.0.0. Reports for SLUs available through eSPADE.
Routley, R. (2010) Water use efficiency – Optimizing farming systems performance and balancing fallow length and sowing decisions. GRDC Update paper.
Verburg, K., Cocks, B., Manning, B., Truman, G. and Schwenke, G.D. (2017) APSoil plant available water capacity (PAWC) characterisation of select Liverpool Plain soils and their landscape context, CSIRO, Canberra.
Verburg, K., Stockmann, U., Cocks, B., Manning, B., Austin, J., Glover, M., Thomas, M. and Gallant, .J (2018). Soil water – methods to predict plant available water capacity (PAWC) using soil-landscape associations. GRDC Update paper.
Contact details
Mr Brett Cocks
CSIRO Agriculture and Food
GPO Box 102, Toowoomba QLD 4350
Ph: 07 45713280
Mob. 0427583756
Email: brett.cocks@csiro.au
Dr Kirsten Verburg
CSIRO Agriculture and Food
GPO Box 1700, Canberra ACT 2601
Ph: 02 6246 5954
Email: kirsten.verburg@csiro.au
® Registered trademark
GRDC Project Code: CSP00210,
Was this page helpful?
YOUR FEEDBACK

