Applications of three-dimensional measurement of soil water properties using Electromagnetic Induction
Author: Brendan Griffiths (PCT Agservices), Sally Poole (PCT Agservices), Patrick Filippi (University of Sydney), Leigh Norton (Delta Agribusiness) | Date: 10 Nov 2020
Take home messages
A large percentage of our work in the PCT Agservices businesses involves the collection and management of spatial GIS data, and applications for the use of that data via management and analytics. Our challenge has been to develop methods of measuring soil physical characteristics that are repeatable and reliable, and accurate to a reasonable degree of confidence, largely revolving around spatial estimation of soil water and subsoil constraints.
Our methodology, whilst still a work-in-progress, is improving as we develop methods that can be utilised in day to day farming operations as diagnostic, risk management, and predictive tools, at field scale.
Introduction
For most, working in the area of applied spatial soil science, the ‘holy grail’ is to be able to calibrate an instrument such as an EM sensor to soil water and when we drive across the field the output of the sensor is reflecting the soil water status at any point below it. Unfortunately, this is not possible using our current methodology. However, there are methods and applications that are currently possible that allow us to determine relative spatial variability across a field or farm in terms of soil water holding capacity.
Our most recent work has been about investigating and developing a range of methods utilising spatial survey information combined with other conventional methods of measuring soil chemical and physical properties, soil water, and crop water use. We are moving away from the more subjective methods of determining soil moisture status, such as a push probe, to more objective methods where we correlate/ground truth, soil sensor survey data to measured soil water characteristics by either measurement of soil water volumetrically or by utilising pedotransfer functions which model soil water properties based on soil textural analysis and structure.
Where are we are at?
A key challenge has been determining when to conduct spatial surveys. Variability in soil water status provides challenges in establishing meaningful relationships between the spatial survey datasets and point-sourced soil chemical, physical and soil-water properties.
When spatially surveying dry soil profiles it becomes more difficult and less relevant to assess soil water properties volumetrically. In these instances, we have been utilising soil textural analysis and pedotransfer functions to model soil water holding properties, and then looking for correlations to other potential soil constraints at depth such as salinity or sodicity.
On soil profiles that are closer to field capacity, we have the ability to do more detailed and accurate investigation of actual soil water properties. Our most recent case study has been a collaboration between PCT Agservices, Delta Agribusiness, and the University of Sydney. In this project we conducted a spatial soil survey using a dual EM instrument, collecting four layers of EM information to a depth of 1.6 m. Based on the EM survey, soil test points were geolocated to represent the full distribution of the EM dataset and were analysed for gravimetric soil water content. At the same time a neutron soil moisture meter access tube was installed in the area of the field that represented the mean area of the EM distribution. In later work we have installed multiple neutron moisture meter access tubes in areas representing both the high and low end of the EM distribution, as well as the mean.
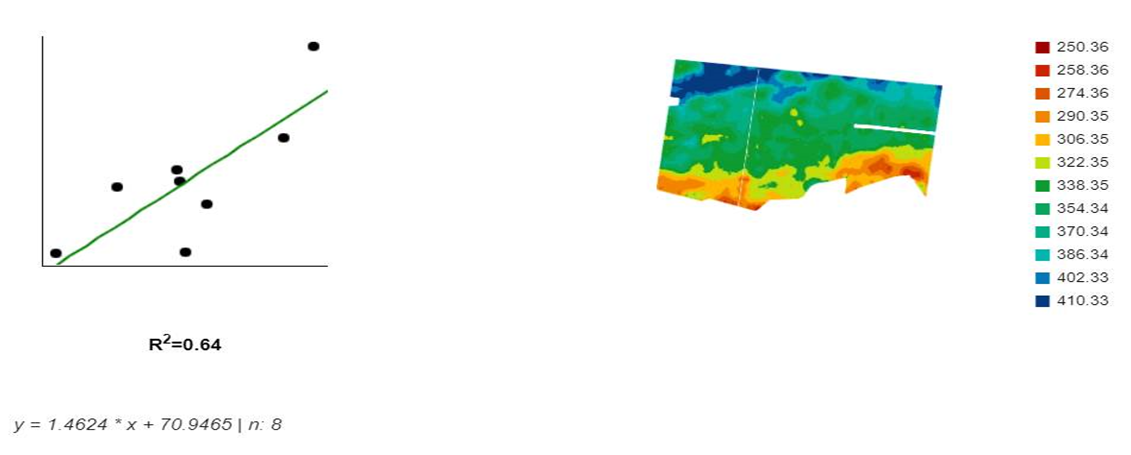
 Figure 1. Volumetric soil water estimated 0-120 cm
Figure 1 illustrates the methodology of utilising regression analysis to establish the relationship between the spatially collected EM survey and point-sourced soil test information. This method is used for creating continuous surfaces of a range of soil properties, including subsoil constraints such as exchangeable sodium percentage, soil chloride levels or soil EC. In this instance outlined in Figure 1, the relationship is being determined between the EM dataset and soil volumetric soil water, collected to a depth of 120 cm.

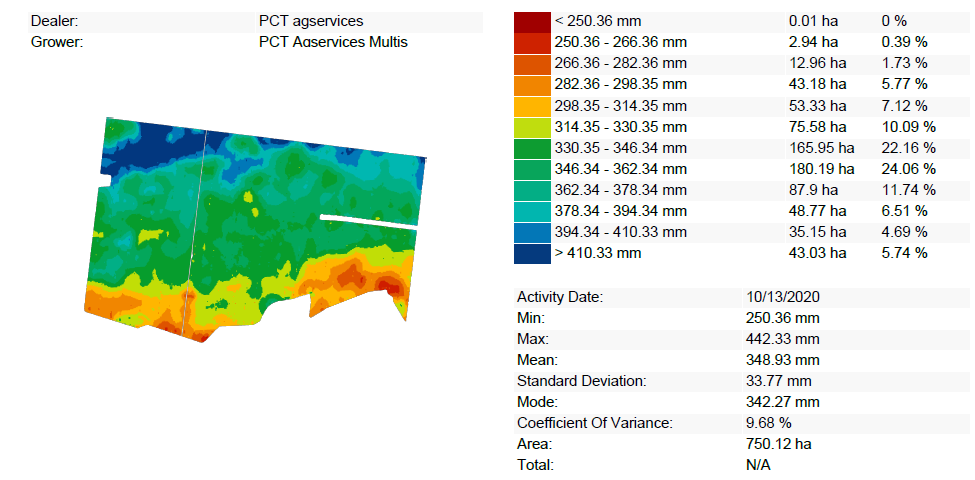
Figure 2. Spatial surface showing distribution of volumetric soil water
Figure 2 shows the surface created, outlining the spatial distribution of volumetric soil water across the case study area to a depth of 120 cm. This was created from soil test information collected immediately prior to sowing of barley 2020. At the same time the neutron moisture meter access tube was installed in the mean area of the soil water distribution, and readings were recorded on a fortnightly basis through the growing period. The purpose of having both the spatial survey and the neutron moisture meter was to illustrate the spatial distribution of volumetric soil water at sowing, and then to utilise the information of the neutron moisture meter to determine actual crop water use during the growing period. Apart from the obvious reason, being to understand starting soil moisture in this study area, this methodology may be used for a risk management point of view. The combined spatial soil water information and the ability to measure actual crop water use may be used in conjunction with predictive tools to determine likely crop yield, and to also determine areas in the field that are above and below the mean area of soil water holding capacity. This information may then also be utilised to outline areas that may be at risk of significantly lower yield or are likely to create grain quality issues.
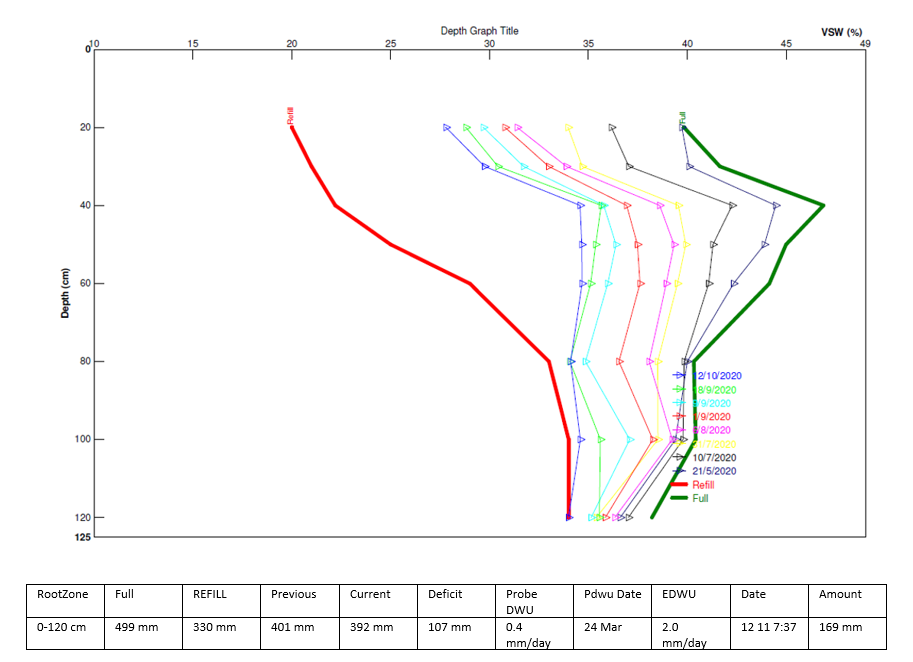
 Figure 3. Neutron moisture meter data collected during winter 2020.
Figure 3 is showing the neutron moisture meter readings taken during the winter growing period of 2020. The site has been characterised to determine both drained upper limit (DUL) and crop lower limit (CLL – wheat) for the site, with all work being conducted by Delta Agribusiness. As can be seen in figure 3, the site was not completely full in terms of soil water at sowing. Despite the season, the CLL for the crop was not reached and, soil moisture was being drawn from much deeper in the profile than the depth of the access tube, being 1.2 m.
Conclusion
The application of spatial survey instruments such as EM is becoming more relevant as we utilise the technology to move towards a more objective measurement of agronomic factors, at field level, such as soil water holding capacity and soil moisture status. A better spatial understanding of the distribution of soil water holding capacity in conjunction with existing technologies such as neutron probes, is allowing for the development of tools to assist in the day to day diagnostic, risk management, and predictive tools at field scale. This allows for vast improvements in the more subjective assessment methods of soil water characteristics historically utilised in field agronomy.
Contact details
Brendan Griffiths
PCT Agservices
‘Shannon’, Kentucky Rd
Boggabilla
Ph: 0427 715 990
Email: brendan@pct-ag.com
Was this page helpful?
YOUR FEEDBACK
