Optimising wheat maturity x sowing date - Sweet spots for flowering in CQ
Author: Darren Aisthorpe, DAF Queensland | Date: 17 Nov 2020
Take home messages
- Match optimal flowering period to local growing environment to maximise grain yield potential
- Timing of sowing opportunities based on varietal selection/availability
Background
Wheat phenology research was conducted in Emerald, Central Queensland (CQ) from 2015 to 2019. The 2015-16, data was collected as part of the final two years of the New South Wales Department of Primary Industries (NSW DPI) led Varietal Specific Agronomy Package project (VSAP). These trials had three components: Varietal response to sowing date, row spacing and nutrition. Data discussed in this paper focuses on only the sowing date response work.
The 2017–19 data was collected as part of a detailed phenology project (DAN00213) led by Dr Felicity Harris, funded as part of the bi-lateral agreement between NSW DPI and the Grains Agronomy and Pathology Partnership (GAPP). A number of “core” and “non-core” sites were established across the northern grains region, two of which were in Queensland split between southern Queensland (non–core site) and Emerald (core site) as the CQ location. Core sites had four sowing dates and took additional biomass cuts at GS30, whereas the non-core sites had three sowing dates and a reduced observation schedule compared to the core sites.
The 2017-2019 sowing dates were synchronised (within 2 or 3 days) across all sites, allowing for cross site and cross year analysis of the indices measured during the trial period. Target sowing dates were April 5 (core sites only), April 20, May 5, and May 20. Varietal selections were based on genetic difference, so while the variety list is not exhaustive of all commercially available genotypes on the market, it was hoped to have a representative spread across the spring and winter wheats on the market at the time.
This paper is not a final report on the two GRDC research projects mentioned, rather a summary of key observations, particularly in CQ and how understanding the relationship between genetics, management and environment can provide significant upside to wheat production in the CQ region.
Frost risk and heat stress
Management of frost risk always ranks highly in a grower’s decision-making process. Most will use tools like the NVT sowing guides to identify suggested windows for when varieties should be grown for certain regions, with the primary aim for most to have the chosen variety flowering post the worst of any potential frost risk period. Theoretically, damage to anthers at their most sensitive can occur at temperatures up to 2oC at head height, however factors such as duration of the cold period, humidity and crop stress can all influence the extent of damage sustained at a given minimum temperature. For the majority of the CQ region, the highest risk period would typically be from late June to early-August (Figure 1).
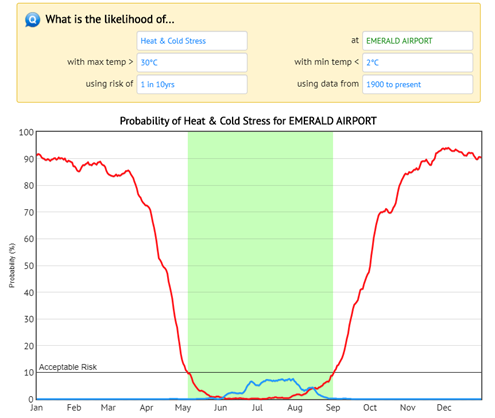
Figure 1. Chart generated in the CliMate app, assessing the likelihood of experiencing minimum temperatures below 2oC or above 30oC based on Emerald weather data dating back to 1900. The highlighted period in green shows that during that period for that location, the probability of experiencing outside the defined limits is less than 10%.
Crop stress due to extreme heat and dry conditions can have just as much, if not a more significant effect on a crop yield and grain quality than frost. The risk of heat stress inducing conditions (temperatures above 30oC) historically spikes rapidly in CQ (Figure 1) after the end of August. However, as recent experiences have shown, August can be just as susceptible to either stress event, with sub 2 oC degree events on August 18 and 22 in 2018 & 19, where 2020 saw temperatures exceed 32 oC as early as August 14.
Flowering x yield
Sowing date (and by inference flowering date) has always been an important agronomic tool to optimise yield and grain quality. However, as new genotypes enter the market and as the impacts of climate change take effect, there is a need to understand regional variation in time to flowering, particularly across a range of sowing dates and genetics.
By the end of the ‘VSAP’ and ‘Optimising winter cereals’ projects in Emerald, the combined yield response to flowering dates revealed not only a clear yield response to flowering date, but more importantly, a change to long held beliefs as to when the optimum flowering period (OFP) occurred.
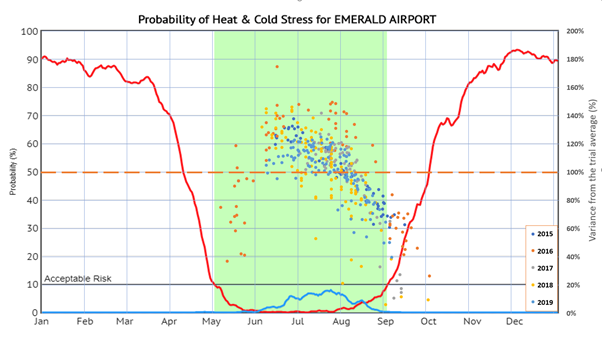 Figure 2. Yield response variance from each year’s trial mean yield ploted realative to flowering date. This chart has then been super imposed over the frost and heat stress risk chart for the region. Each dot represent the average yield of a particuar variety at a particular sowing date. The orange dotted line represents the each years average trial yeild, Table 1 lists the value of the orange line for each year of data.
Figure 2 shows yield response to flowering date for all the genotypes planted across the 5 years of trials. In this graph, the important thing to focus on is the effect of flowering date, rather than the variety and sowing date used to achieve this outcome The 2015 and 2016 variety list differed from the varieties used in 2017–2019. However all varieties used were spring wheats with a maturity spanning from the very quick spring wheats, like Dart, Sunprime or Longreach Mustang with days to flowering (DFT) in the early to mid-60s, right through to long spring wheats like Eaglehawk, Strzelecki and Sunmax with flowering DTF figures up to 120 days in CQ conditions.
Table 1. Trial average yields (kg/ha) for each year of data
| Year | Trial avg. yield (kg/ha) |
|---|---|
| 2015 | 3330 |
| 2016 | 3983 |
| 2017 | 3412 |
| 2018 | 2130 |
| 2019 | 4367 |
May to September is typically a dry period for CQ with rainfall totals of only 40-70 mm common. Significant rainfall events, particularly in June/July can assist in widening the optimum flowering window for this region. 2016 received such events across June – August, where the rest of the years received little to no rain in crop during the flowering period of May to October. This difference in in-crop rainfall helps to explain the yield response difference for late July and August in 2016, relative to other years.
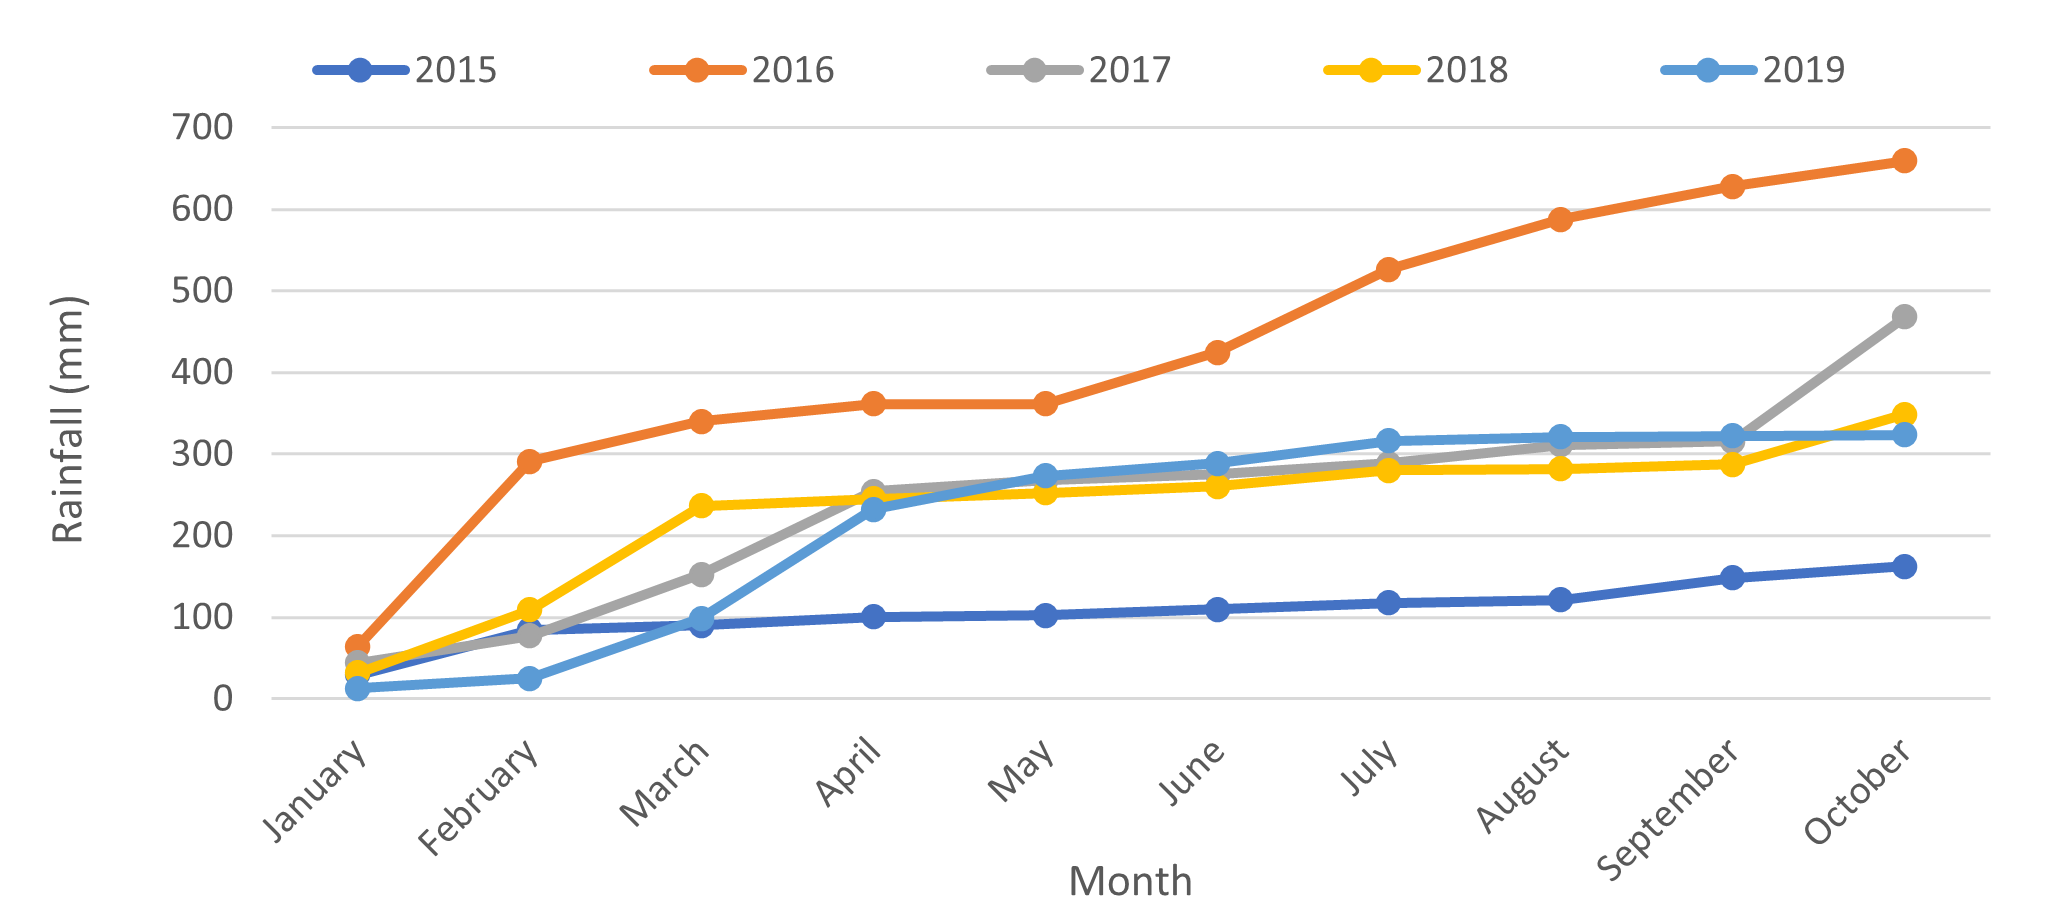 Figure 3. Cumulative rainfall on site at the Emerald research facility 2015 to 2019 from January to October. It is important to note the significant uptick in rainfall experienced in 2016 from June – August, relative to all other years which typically only had 30 – 60 mm in crop rainfall over the full growing season.
Analysis
Figure 2 presents pertinent messages for growers and consultants in CQ. First and foremost is that yield decline, relative to flowering date, can occur as early as mid-July in typical conditions for CQ. The penalty of a wrong flowering date could be as much as a 40%. Even in a tough year like 2018, with trial average yields around 2.2 tonnes, the yield could range from 120% of the trial average (2.6 t/ha) for a late June flowering date, down to 80% of average yield or 1.7 t/ha for a mid-August flowering date, or almost 1 t/ha yield loss compared with the best outcome. In a higher yielding year like 2017, this difference only increased, where the trial average was 3.4 t/ha; 120% of average yield was achieved in mid-June (equates to 4.1 t/ha), with the same variety flowering in mid-August yielding 80% of trial average or 2.7 t/ha, equating to a loss of 1.4 t/ha when compared to the best outcome.
The second point is that even though nearly all the flowering occurred in the ‘low temperature stress risk period’ marked in green, we still see such a decline in yields, typically when the crop flowers from mid-July onwards. While each point on the graph represents when a variety had achieved 50% flowering (GS65) for a given sowing date, the crop still must fill the grain after flowering. As maximum daily temperatures increase, moisture profiles begin to run down and evaporative pressure increases on the plant, the grain fill process for the plant becomes increasingly more difficult.
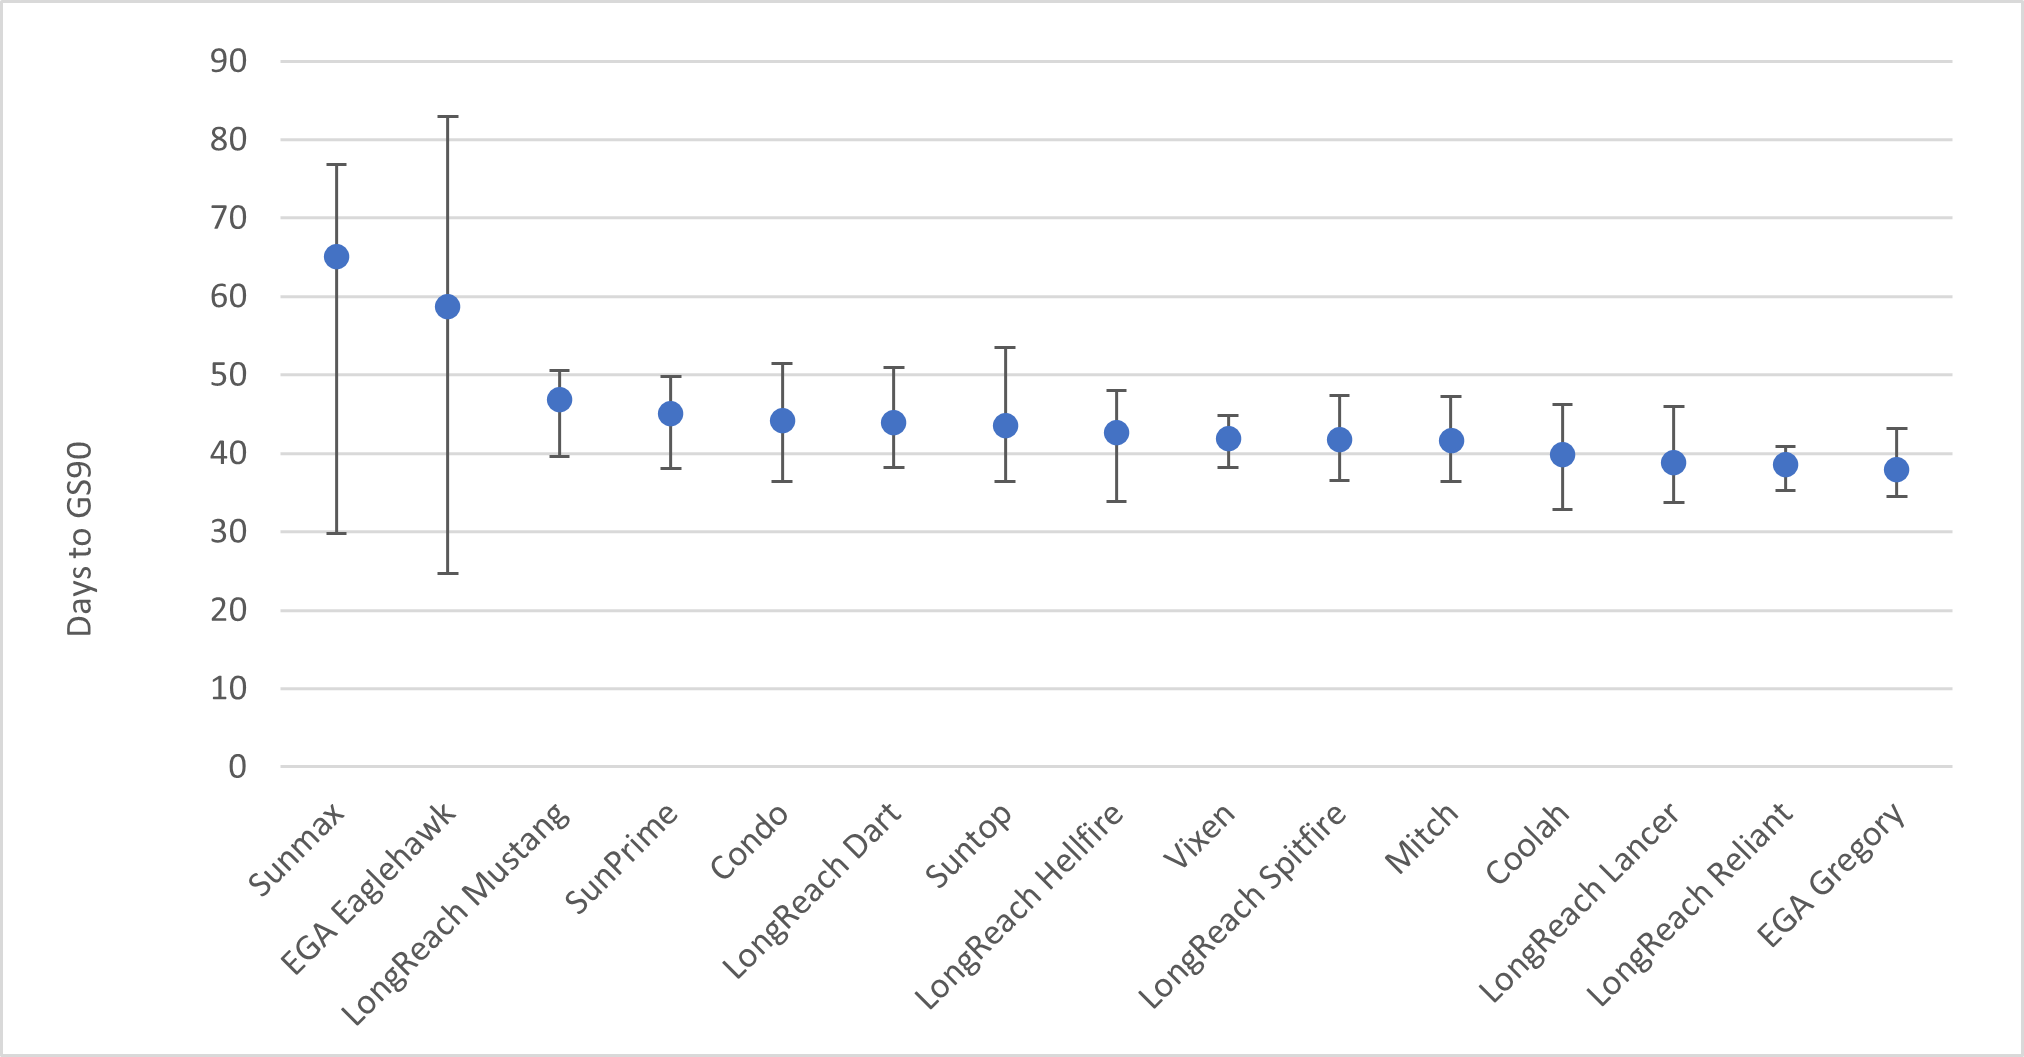 Figure 4. Average duration (days) from 50% flowering (GS65) to maturity (GS90) for a spread of spring wheat maturities. Error bars indicate average, longest and quickest periods across the four sowing dates over the 3-year period of the trial.
(All varieties in this figure are protected under the Plant Breeders Rights Act 1994)
The period from 50% flowering (GS65) to maturity (GS90) typically averaged around 40 days (Figure 4). However, a variation of around 10 days was typically observed in the Emerald trial for most varieties, with earlier sowing dates generally taking longer and later sowing dates speeding up as temperatures rose and plant stress increased during grain fill. Interestingly the time taken from GS65 to GS90 bears no correlation with time from sowing to GS65, with fast spring varieties like LongReach Mustang, SunPrime and Suntop averaging in the mid 40 day mark, while longer season spring wheats like LongReach Lancer, LongReach Reliant and EGA Gregory averaging sub 40 days dipping close to 30 depending on sowing date.
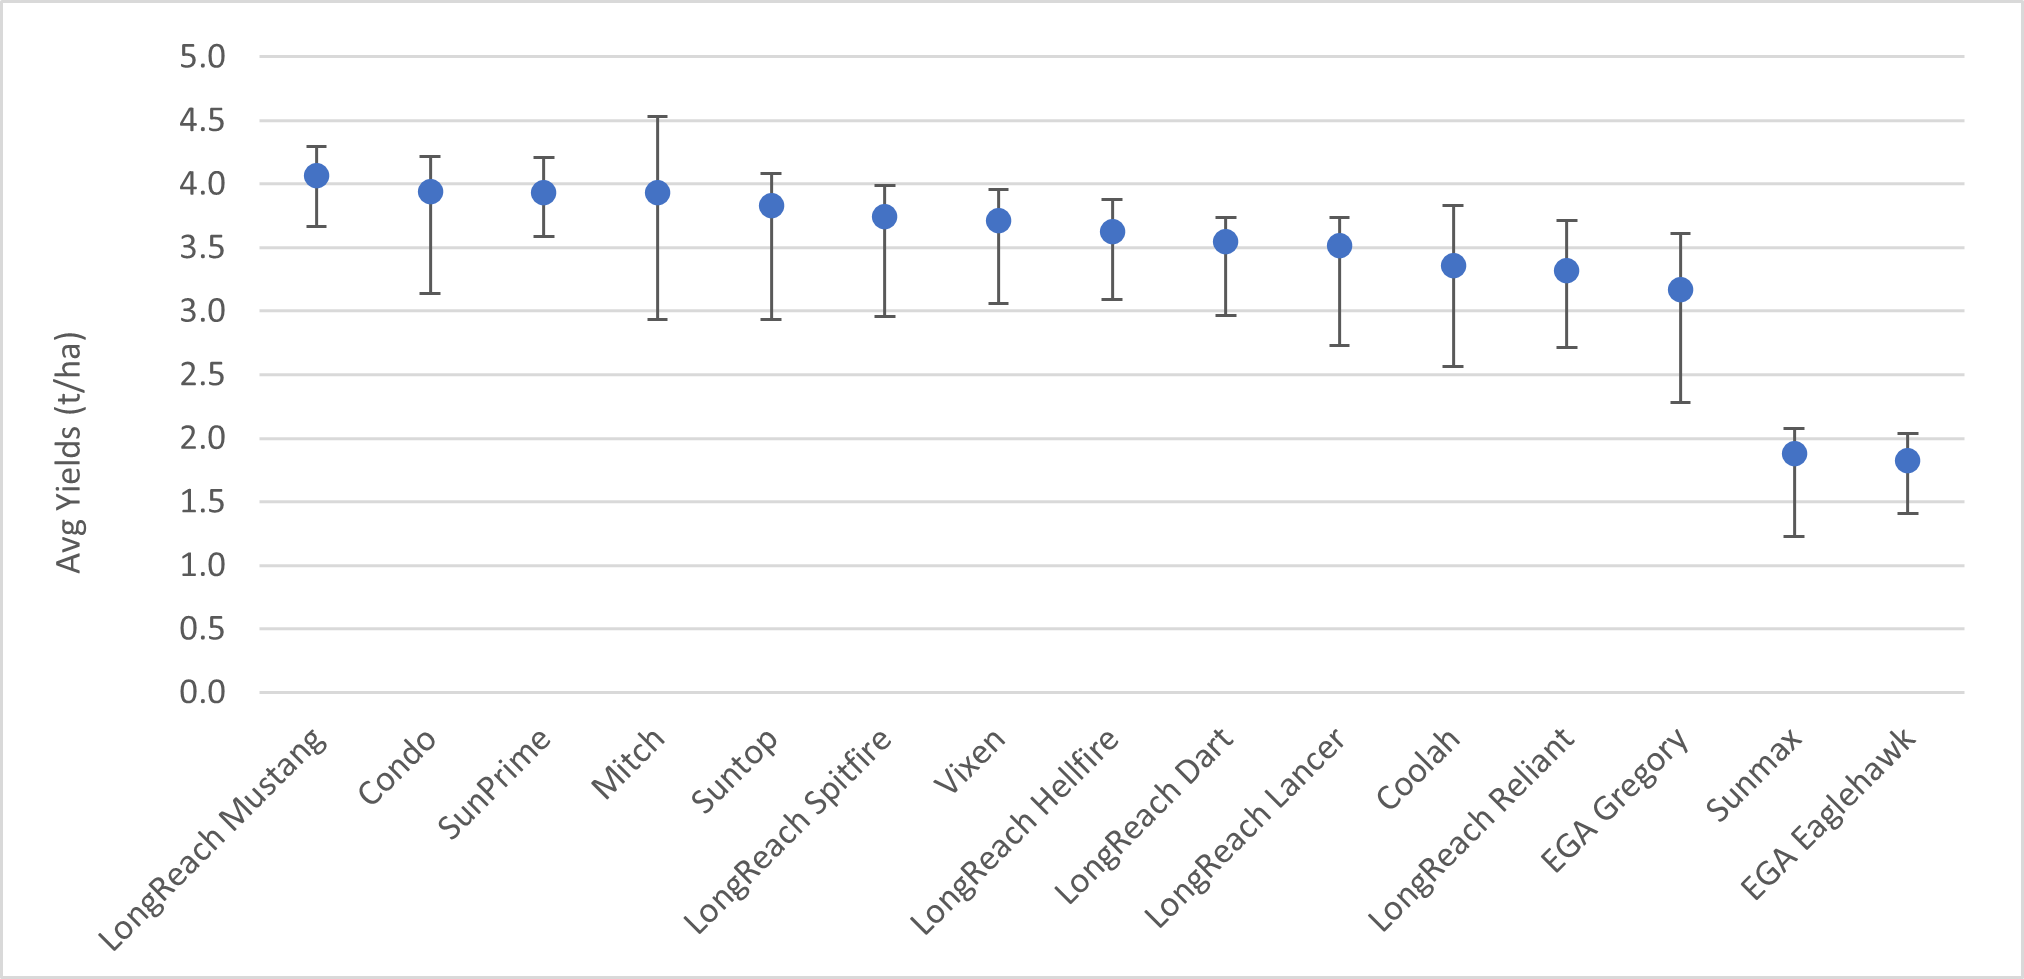 Figure 5. Average yields (t/ha) for the maturity spread of varieties used in Figure 4. Spring wheats with a longer period from GS65 to GS90 tended to perform better, however the very long season spring wheats such as Sunmax and Eaglehawk were simply just too long to GS65 to make real use of the optimum flowering/grain fill period.
(All the varieties in this figure are protected under the Plant Breeders Rights Act 1994)
Figure 6 shows that there is a very nice reverse correlation with average evaporative pressure or ETo (mm/day) for the past five years and yield response to flowering date over that period. Optimum yields were consistently achieved when flowering occurred when evaporative pressure was at its lowest or at least at levels below 3mm/day.
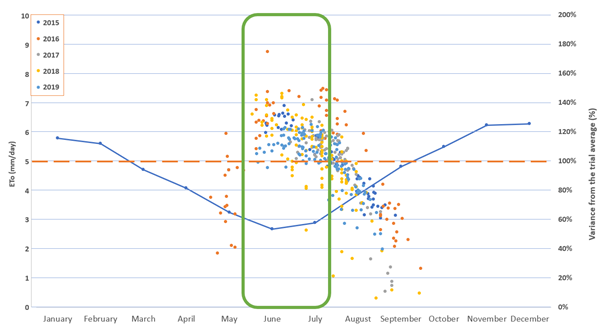 Figure 6. Yield response to ETo (mm/day) levels. The blue line shows average monthly evaporative pressure ETo (mm/day) experienced by the plants across the past five years. When presented over the same period of the yield response to flowering dates, it becomes apparent that timing flowering and more so grain fill for a period when ETo (mm/day) is as low as possible is beneficial for yield response.
Sowing dates which allowed the wheat to flower and more importantly fill grain in the conditions best suited the plant; low ETo (mm), which usually also means higher relative humidity and typically higher PAW; consistently out yielded flowering dates outside of the sub 3mm/day ETo. Having identified this period, the challenge is matching a sowing date for a particular variety.
Days to 50% flowering
Nominating a fixed period for a cereal crop genotype to flower for any given sowing date at any individual location is problematic at best. With so many variables at play including genetics, climate and agronomic management, even when efforts are made to minimises variables, such planting date, population and starting PAW, a year to year variance of as much as 10 days is still possible.
Figure 7 pulls together the flowering data (GS65) from the 2017 to 2019 data set and provides an average days to flowering for the 3 years of data across all four sowing dates. The graph has been sorted on stability and variance rather than just average time to GS65. The varieties have been sorted into three important groups. Those marked in blue are varieties which tend to slow or extend the time from sowing to 50% flowering. How much average time to flowering slows is shown by the error bars, early sowing dates are faster, later sowing dates are slower, with a variety like Sunprime being as quick as 65 days planted early, to as long as 85 days planted in late May.
Moving from left to right, the further to the right of the list of blue varieties you move, the more stable they are across sowing dates (at least in these trials). The green dots show the three most stable varieties across all sowing dates, with LongReach Lancer showing up as on average the most stable of them all with only 1-day average variance across the 4 sowing dates.
The varieties marked in orange are ones which speed up, the later you plant them within a sowing window in CQ. They are generally longer season varieties and time to flowering variation increases, the further to the right you look across the list. Varieties like EGA Eaglehawk, Sunmax, RTG Zanzibar or Longreach Nighthawk are varieties which are performing poorly in CQ conditions as they are simply too long (in excess of 100 days) to GS65, even for early sowing dates, to take advantage of the optimum sowing window.
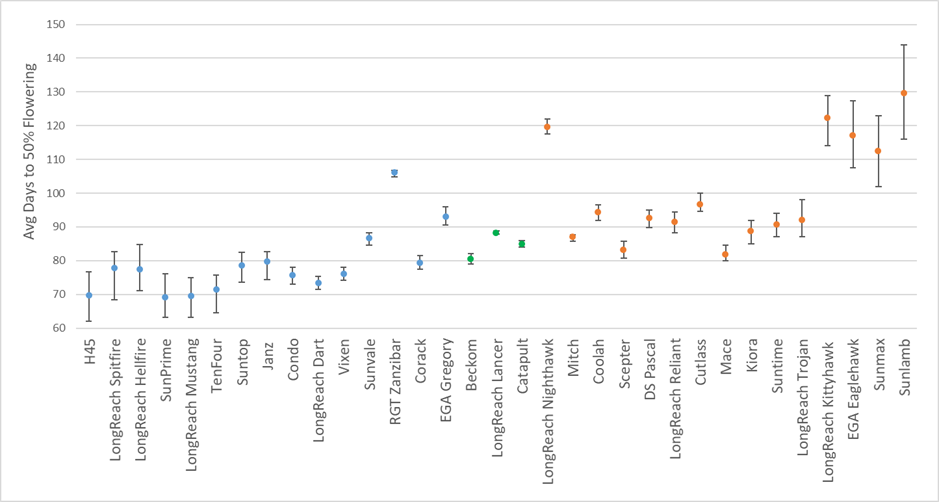 Figure 7. Average days to 50% flowering across all four sowing dates 5 April, 20 April, 5 May and 20 May at the Emerald site from 2017 to 2019. Blue dots indicate flowering date lengthened the later it was sown, green dots were with 2 days across all sowing dates and orange dots shortened days to flowering, the later the sowing date. Error bars indicate min and max average days to flowering for all varieties across the 4 sowing dates.
(All the varieties in this figure (except H45, RGT Zanzibar, Janz are protected under the Plant Breeders Rights Act 1994)
Call to action
The biggest gains growers can make in maximising wheat production in CQ is simply ensuring that flowering and grain fill take place during the lowest stress period possible for the conditions experienced in that growing year. By bringing your flowering date back into the optimum flowering period (OFP) for your region, it has the potential to lift yields between 20 – 40%, all other variables being equal. Flowering in this period will not only maximise yield potential, but also improve grain size and reduce screenings. It is also within the OFP that genetic advantages/differences between varieties are most able to express themselves, allowing growers to take full advantage of any improvement in yield one variety may have over the competition.
From a practical standpoint, changing flowering dates can be done one of two ways - adjust sowing date of your current varieties to target the optimum flowering period or change variety if you are reluctant to plant any earlier than you do currently. From a systems standpoint, early sown wheat tends to have a better chance of getting follow up rain to get secondary roots down and will compensate much better if establishment is sub optimal (especially if deep sown), particularly mid to longer season varieties like Mitch, LongReach Lancer or Coolah.
It is important to note that while our data clearly indicates for the Central Highlands, in lower frost risk regions, the OFP is in that June-July period. This may not be the case for all regions and as such, growers must assess frost risk on a paddock by paddock basis. If you believe the chance of getting a frost in late June is 1 in 2 or 3 years instead of 1 in 10, then do not target a flowering date that will put you at that high risk of frost damage.
The data in Figure 7 all comes from the Emerald research facility just east of Emerald. While it acts as a solid guide as to what to expect within the Emerald area, as you begin to move further east or south, and as lower lying topography increases frost risk, I would expect some of the values to increase, equally as you move further north some may reduce, particularly the early sown days to flowering. Unfortunately, accumulating rigorous, days to flowering data across multiple sowing dates is expensive and time consuming work and as such there are some very big gaps in current datasets, particularly in Queensland, which will make the task of hitting optimum flowering periods all the more difficult as new varieties come onto the market.
Acknowledgements
The research undertaken as part of this project is made possible by the significant contributions of growers through both trial cooperation and the support of the GRDC, the author would like to thank them for their continued support.
I would like to acknowledge Dr. Felicity Harris from NSW DPI as led of the “Optimising Grain Yield Potential in the Northern Grains Region” project: 2017 – 2019 (DAN00213) (Grains Agronomy and Pathology Partnership, GRDC and NSW DPI).
I would also like to recognise Ellie McCosker, Jane Auer and the rest of the DAF Regional Research Agronomy team based in Emerald for their contribution to this work.
Contact details
Darren Aisthorpe
Department of Agriculture and Fisheries, QLD
99 Hospital Rd, Emerald QLD
Ph: 07 4991 0808
Email: darren.aisthorpe@daf.qld.gov.au
Varieties displaying this symbol beside them are protected under the Plant Breeders Rights Act 1994
GRDC Project Code: DAN00213,
Was this page helpful?
YOUR FEEDBACK
