Soil sampling and variability – what does this mean for your nutrient decision?
Author: Yvette Oliver, Phil Ward, Karen Treble | Date: 11 May 2020
Key Messages
- Nutrients such as Nitrogen (N), Phosphorous (O), Potassium (K) and Sulphur (S) can vary within even a small transect on the same soil type. This variability is measured using the coefficient of variation (CV%). In soil sampling, the CV% can range from 10-80%.
- The more samples bulked before lab analysis, the lower the CV% and the more accurate the soil test value.
- At low nutrient variability (CV of 20% or less) the optimal number of cores that should be taken are around 8-10 while at higher variability (CV of 50% or higher) the optimal number required rises to 20-30.
- The degree to which nutrient variation and sampling strategy affect fertiliser decisions will depend on the risk profile of the farmer or consultant.
- Using the tool ‘NPK’ decide we demonstrate the economic impact of applying an average fertiliser rate to a paddock when the soil test values are either higher or lower than the average. We then use this economic impact to determine an optimal sampling strategy for the paddock.
Aims
- The aims are to determine the variation of nutrients (%CV) in the soil which are affected by management options such as sowing and amelioration strategies. To show the impact of sampling intensity and variation (%CV) on the range of likely nutrient values the soil test represents.
- To create a tool to determine the optimal sampling intensity based on the economic impact of applying an average fertiliser rate across the range of values that a soil test represents.
Introduction
A soil test is not a single absolute value but a composite average of many individual samples with a range of uncertainty caused by variations within the field. These variations can be influenced by inter-row sowing, soil amelioration strategies and management history. The number of samples taken influences the certainty of the measured value.
Using measured variability and different sampling densities, we estimated the spread of soil test values away from the average value. The average value is commonly used to estimate the fertiliser to supply (along with crop demand). In this paper we determined the impact of applying nutrients based on the average soil test value, when the actual value could be much higher or lower.
Method
1. Determining nutrient variation in the field
Nutrient variability was measured in the field and supplemented with data from the literature. Individual cores were sent for analysis and the average and coefficient of variation (CV%: standard deviation/mean x 100) calculated from the surveyed data. The measurements included:
1) ‘on-row off-row’ (12 sites) where 8-16 soil samples were taken in a transect at depths of 0-5, 5-10,10-20 and 20-30cm and then analysed for N, P, K and S.
2) ‘amelioration trials’ - three trials with 16 samples taken from each control plot (16) and each deep-ripped plot (16) to compare N, P, K and S levels and;
3) ‘literature values’ where P had been assessed in surface samples (0-10cm) at six locations with very intense sampling (80 cores) in close proximity (Ripper 1989), and where P and pK had been assessed at 0-10cm via intense sampling at three locations across an entire paddock (141-516 samples per paddock).
2. Estimating the effect of variation and sampling strategy on the soil test value
The variation from the mean soil test value (as a percentage difference) was estimated for:
1) the sampling intensity (number of cores per bulked sample) and;
2) the variation within a sampling area (expressed as CV%) (see Table 1).
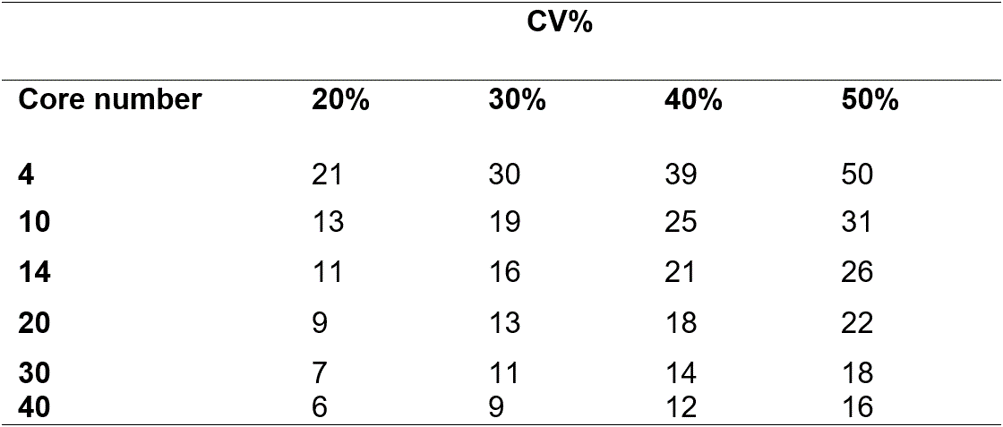
Table 1. Difference (%) from the mean soil test value in relation to the number of cores taken and the variability (CV%) of the site. Adapted from Fig. 10 in Gourley and Weaver (2019).
3. What does this mean for a 10mg/kg P soil test?
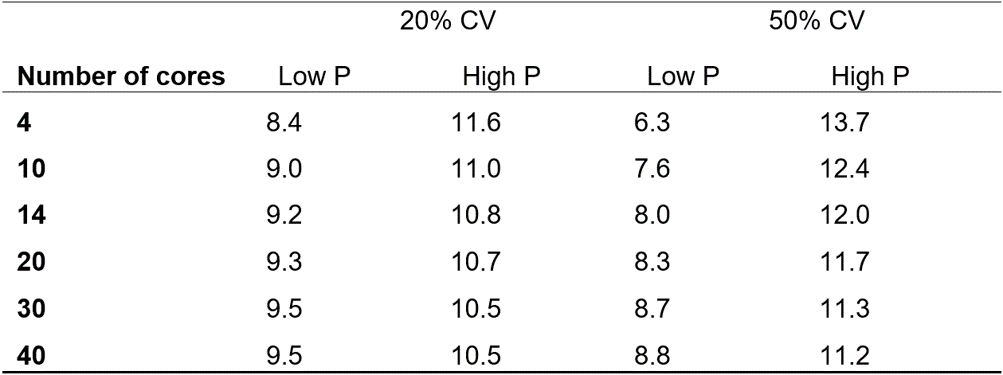
Table 2 outlines the range of soil P levels (mg/kg) resulting from a soil P test of 10mg/kg in the 0-10cm layer when sampling intensity was either 4, 10, 14, 20, 30 or 40 bulked cores and coefficient of variation was either 20 or 50%. Rather than use the maximum range away from the mean, we used 0.75 of the percentage difference from mean values (from Table 1) and then calculated the lowest and highest P values possible from each sampling/variation combination.
Table 2. The lowest and highest Phosphorus (P) (mg/kg) values that could reflect the true P value in a 10mg/kg P soil test with a range of sampling densities and a CV of either 20% or 50%.
4. Estimating the P requirement for average soil test
Using the ‘NPK decide’ equations (Burgess et al 1991) we estimated the P requirement for a 2500kg/ha crop when the ‘average’ P soil test value was used (Eq 1). A similar approach is used by CSBP and Summit, however they sometimes also consider phosphorus buffering index (PBI), pH and other factors not included in ‘NPK decide’.
The optimal rate of P (Pf) to apply is determined by the potential yield (A), crop yield price (Yield$), the P price (P$), the soil test value (Pst) and includes parameters that account for soil test to yield relationships (Cstp), and the effectiveness of applied fertiliser (Kp):
Pf =(-1/Kp) * Ln(P$ / (Yield$ * Kp * A)) - (Cstp * Pst/Kp) (eq1)
Where Kp = 0.06 and Cstp = 0.12
Another approach uses the Better Crop Fertiliser Decision (BCFD) for WA (Anderson et al 2015) which uses an optimal P soil test value required to achieve 90% yield potential, which is 22mg/kg for P but has a large scatter in the data.
5. Estimating yield
The fertiliser rate calculated with the average soil test value was used to estimate the economic optimal yield (Eq 2). The achievable yield was estimated when the soil test was low P, and the fertiliser rate was from the average soil test P.
The achievable yield is calculated in ‘NPK decide’ using scalars (Psc) to adjust the potential yield (A) depending on the optimal rate of P (Pf) and the effectiveness of applied fertiliser (Kp), the soil test values (Pst) and the factor that relates soil test values to yield (Cstp)
Achievable yield = A x Psc = A * (1-exp (-Pf * Kp - Pst * Cstp)) (Eq 2)
We did not use BCFD data to estimate yield as it was designed to determine optimal soil test values rather than a fertiliser recommendation.
6. Determining the $ loss from applying the average fertiliser rate when the actual soil nutrient supply is below or above the soil test average
For ‘low’ soil test values the $ loss ($/ha) = difference in yield x $grain price
For ‘high’ soil test values the $ loss ($/ha) = difference in soil test P x $P price
In this example we used a yield potential of 2.5t/ha, a yield price of $250/t and P price of $3.5/kg. This method assumes there is little yield gain above the optimal P amount (which may not be true in trial situations).
Results
Nutrient variability across a small area and paddock
The variability between samples taken in close proximity (about 10-30m) for P, K and nitrate ranged between 20 and 50% CV (Figure 1). The on-row samples were as variable as the off-row samples, whereas the unmixed controls were often less variable than the mixed sites in the three amelioration trials. There was often more K on-row than off-row, but there was not a strong enough pattern to justify making any recommendation regarding the number of samples to bulk on or off the row.
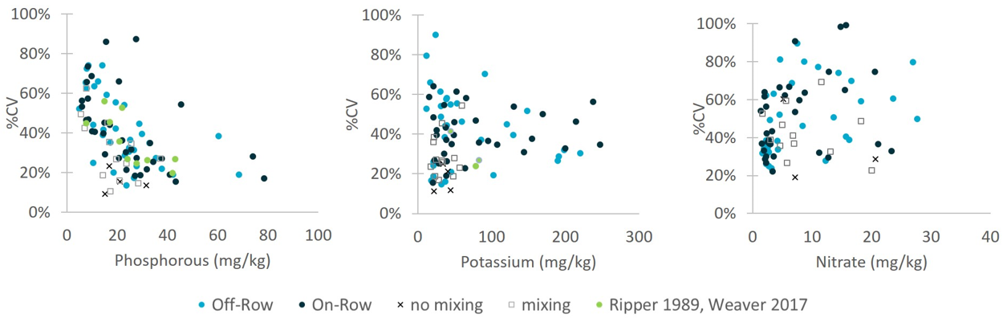
Figure 1. Average soil test values (mg/kg) (from 10-16 adjacent cores) and the coefficient of variation (%) for phosphorous, potassium and nitrate.
What does this mean for fertiliser recommendation?
Variability increases the range of soil test values and the chance of either over-fertilising or under-fertilising based on the average soil test value. Almost $20/ha can be lost from applying the average test level amount when CV% is close to 50% and 10 cores are bulked to obtain the soil test values (Figure 2).
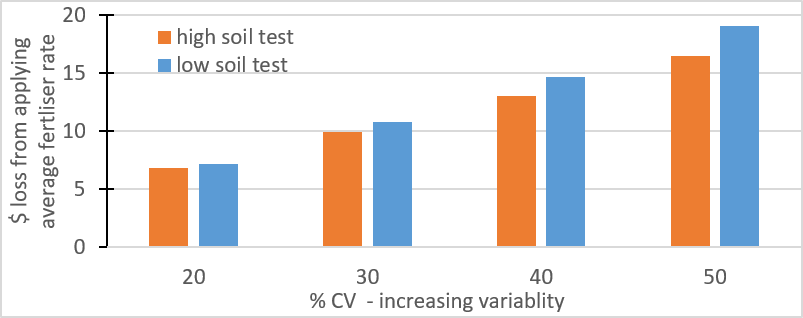
Figure 2. Loss ($/ha) from applying an average P fertiliser rate of (10mg/kg) across soils with P values either lower or higher than the average test value. Calculations based on a CV of 20% or 50% and bulked samples of 10 cores.
If a site is highly variable, then more samples are required to improve confidence in the soil test value and reduce the $ loss from over- or under-fertilising. While more than 40 cores have often been recommended (Gourley and Weaver, 2019), this may be cost prohibitive. At a CV of 50% fertiliser decisions can be made more accurate by taking 20-30 cores. Such an approach improved the accuracy of fertiliser application and reduced the cost to less than $10/ha for a soil test value of 10mg/kg (Figure 3a). At a CV of 20% and soil P of 10mg/kg taking 10 cores was near optimal for soil sampling (Figure 3b).
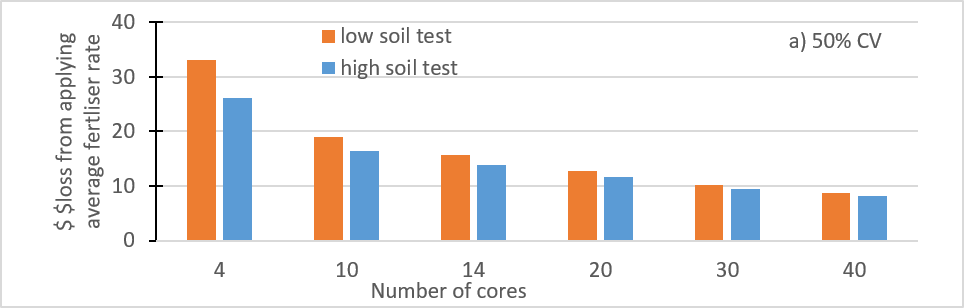
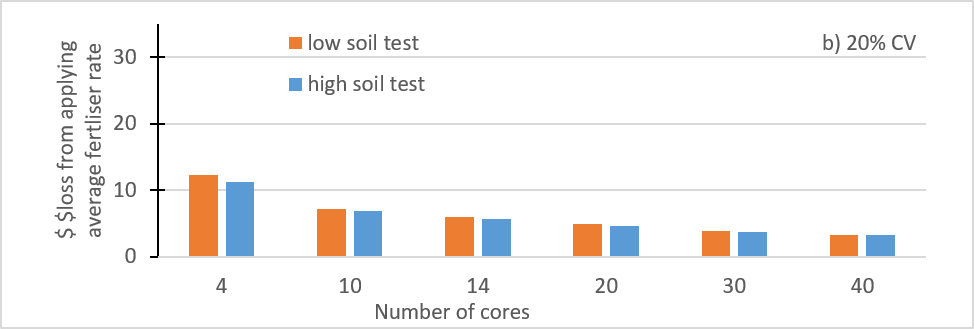
Figure 3. Loss ($/ha) from applying an average P fertiliser rate of (10mg/kg) across soils with P values either lower or higher than the average test value. Calculations based on a CV of 50% (a) or 20% (b) across a range of bulked sample cores.
As the soil test value of P increases, the $ loss from applying the average increases. The higher the grain yield price the greater the economic loss from under-fertilising. While the economic loss is greater when P price is higher, the P can remain in the system for subsequent years and could be recovered by future crops.
Conclusion
Soil nutrient levels varied by as much as 20-50% (CV) across a paddock even without large soil disturbing processes like amelioration.
The level of nutrient variation coupled with the number of sample cores taken will affect how closely soil test values represent the actual nutrient level of a soil. By using an approach that calculates the economic impact of under- or over-fertilising, the optimal soil sampling strategy can be determined.
At low nutrient variability (CV of 20% or less) the optimal number of cores that should be taken is about 8-10 while at higher variability (CV of 50% or higher) the optimal number required rises to 20-30.
References
Anderson G, Brennan R, Bell R, Chen Wet (2015) Making better fertiliser decisions for cropping systems in Western Australia. Soil test-crop response function and critical soil test values and ranges. Department of Agriculture and Food Perth, Bulletin 4865.
Burgess SJ, Bowden JW, Diggle AJ (1991) NPDecide Users guide: A computer program to help with nitrogen and phosphorous decisions for cereals. Department of Agriculture Western Australia.
Gourley CJP and Weaver DM (2019) A guide for fit for purpose soil sampling, Fertilizer Australia, Canberra, Australia.
Ripper FH (1989) Soil Analysis – The impact of sampling. CSBP Productivity Focus (Vol7 No2).
Weaver D, Summers R, Rogers D, Richards P (2016) Whole Farm Nutrient Mapping - assessment of soil sampling methods, Resource management technical report, Department of Agriculture and Food, Western Australia, Perth.
Acknowledgments
The research undertaken as part of this project is made possible by the significant contributions of growers through both trial cooperation and the support of the GRDC, the author would like to thank them for their continued support. We thank the many growers who allowed us access to their paddocks and thank CSBP and Summit for access to their trials and their support.
Contact details
Yvette Oliver, CSIRO
Private Bag 5 PO, Floreat
9333 6469
Yvette.oliver@csiro.au
GRDC Project Code: CSP1801-004RTX,
Was this page helpful?
YOUR FEEDBACK