Increasing heat tolerance in wheat in West Australia
Author: Karine Chenu (UQ/QAAFI Toowoomba), Brian Collins (UQ/QAAFI Toowoomba), Najeeb Ullah (UQ/QAAFI Toowoomba), Troy Frederiks (DAF Toowoomba), Jack Christopher (UQ/QAAFI Toowoomba). | Date: 15 Mar 2021
Key messages
- Heat stress has increasingly impacted wheat crops from West Australia over the last decades.
- Tolerance to post-flowering heat stress is more important than tolerance to pre-flowering heat in order to improve wheat productivity in a warmer climate.
- A field-based phenotyping method has been developed to reliably screen genotypes differing in flowering date.
- Quantify the impact of heat stress on wheat crops.
- Provide a deeper understanding of what drives yield losses in wheat in a warming climate.
- Provide a robust phenotyping method to accelerate crop improvement for heat tolerance.
Aims
- Quantify the impact of heat stress on wheat crops.
- Provide a deeper understanding of what drives yield losses in wheat in a warming climate.
- Provide a robust phenotyping method to accelerate crop improvement for heat tolerance.
Introduction
In recent decades, rising temperatures have increasingly affected wheat crops in major producing regions around the world. Climate models predict further increases in mean temperature and in the frequency of temperature extremes for the near to mid-future, (e.g. Zheng et al 2012; IPCC 2014; Collins and Chenu 2021).
Heat stress can affect wheat crops at each stage of the crop cycle, (e.g. Farooq et al 2011; Hunt et al 2018). However, heat events mostly impact grain yield of an established crop when they occur (i) pre-anthesis and affect grain number, (e.g. Ugarte et al 2007; Chenu and Oudin 2019) or (ii) during grain filling and reduce the size of individual grains, (e.g. Tashiro and Wardlaw 1990; Ullah and Chenu 2019). Overall, the impact of heat stress depends on the timing, severity and duration of heat events, as well as genotypic characteristics, (e.g. Prasad et al 2014).
The first part of this paper presents results from a modelling study on how heat shocks have impacted wheat crops in Western Australia in recent times, how temperatures have increased since 1985, and the consequence of this on wheat crops. Details of this part have been recently published in Ababaei and Chenu (2020). The second part of the paper describes a new field-based method to screen reliably for heat tolerance and assist crop improvement.
Method
Simulation set-up
The Agricultural Production Systems sIMulator (APSIM) Wheat model (Holzworth et al 2014) was used to simulate growth and development of wheat crops at 23 sites across the western part of the Australian wheatbelt (Chenu et al 2013). Heat-stress impacts were modelled as described in Ababaei and Chenu (2020). In the simulations, the mid-maturing cultivar Janz was sown on 15 May in each season from 1985 to 2017, using weather data from the SILO patched point dataset (Jeffrey et al 2001). Soil characteristics, soil nitrogen at sowing and fertilisation levels were set to represent local soils and farming practices (Chenu et al 2013). Soil moisture at sowing was set at the median level obtained from long-term simulations (Chenu et al 2013).
Analysis temperature increases and impacts on wheat yield and components
At each of the 23 sites, average daily minimum and maximum temperatures were calculated from August to November, when most of the pre-anthesis and grain-filling heat shocks are expected to occur for Australian wheat crops.
Heat-shock impact on grain number and grain size (Figure 1) were defined as per Ababaei and Chenu (2020).
The significance of temporal trends from 1985 to 2017 was investigated with the Mann-Kendall test (Hipel and McLeod 1994) implemented in the R package trend (Pohlert 2018).
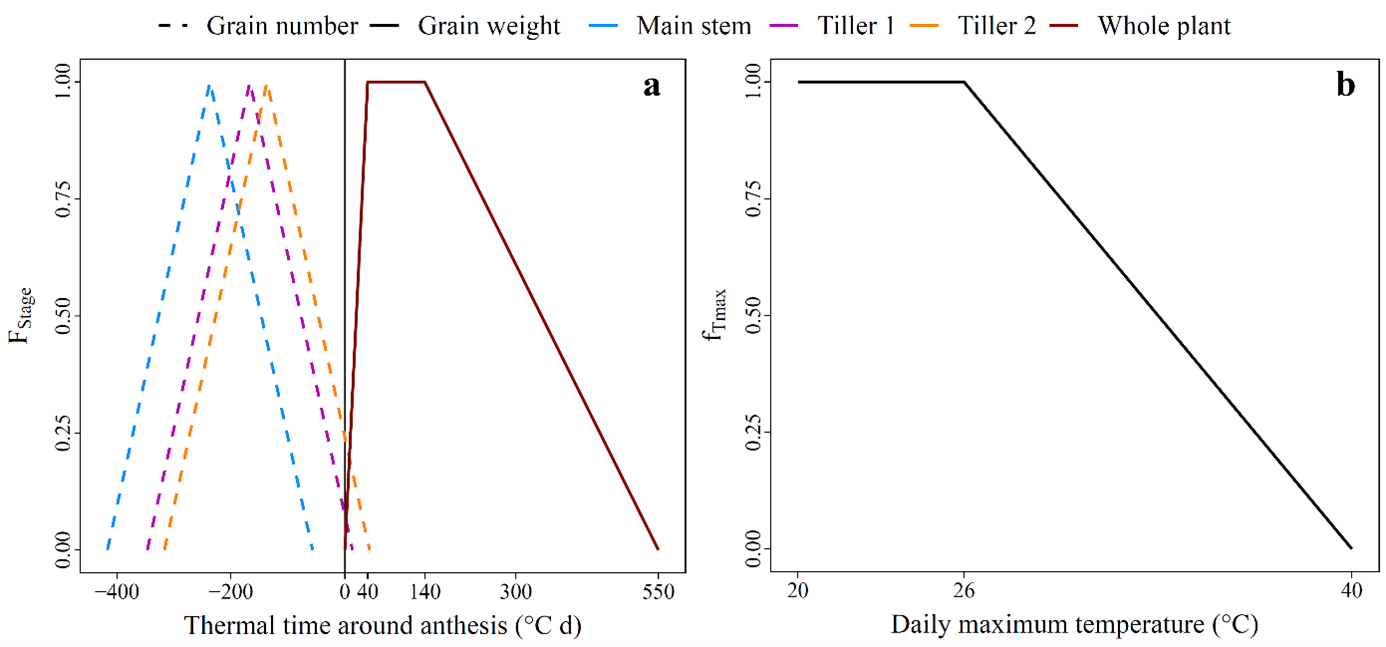
Figure1. Functions used to simulate the direct effects of high temperatures on yield components: (A) Relative sensitivity (Fstage) of grain number and individual grain weight at different thermal times around anthesis; (B) daily effect of Tmax on grain number or grain weight (fTmax). Functions from Ababaei and Chenu (2020).
Field trial and field-screening method for heat tolerance
Field trials were conducted with 35 wheat genotypes having contrasting phenology and adaptation during two seasons in 2018 and 2019 at three locations across southern Queensland (Gatton (‘GAT’), Warwick (‘WAR’) and Tosari (‘TOS’) near Tummaville). Two types of trials were conducted adjacent to each other at most sites: trials with the new field-screening method based on the establishment of a photoperiod gradient (‘light trials’; Figure2) and trials with small plots (‘plot trials’).
Randomised-block designs with two times of sowing and four replicates per sowing time, (i.e. 8 blocks in total) were used for both types of trials. A total of seven environments (site x year x time of sowing) were studied for the light trials, and five environments for the plot trials. To ensure high temperature during the grain filling period, the trials were planted late (early-to-mid July, ‘s1’) or very late (late August or early September; ‘s2’) in the cropping season. The crops were partially (Tosari) or fully (elsewhere) irrigated and grown under non-limiting nutritional conditions. Crop management practices were adopted to control weeds, pests and diseases.
For the novel photoperiod gradient method, LED lamps were set up at 1m above-ground level at one end of each row, extending the day length to 20h close to the lights (Figure 2). The intensity of light diminished along the rows, with minimum or no impact at the opposite end of each row. All genotypes were hand sown in a 5m single row with 30cm row spacing to achieve a population density of 130 plants/m2. For each ‘light trial’ and sowing date, at least 20 spikes of each genotype were tagged at anthesis (at different distances from the light depending on the genotype). These spikes were manually harvested at maturity and processed to measure grain yield components.
Adjacent to the ‘light trials’, the performance of the same wheat genotypes was assessed in field plots managed in the same way, (e.g. same sowing dates). Field plots of 2×6m were set up at Gatton in 2018 (second sowing only). In 2019, plots of 1×6 m were sown for both sowing times at Gatton and Tosari. Plots were harvested using a small-plot combine harvester at maturity.
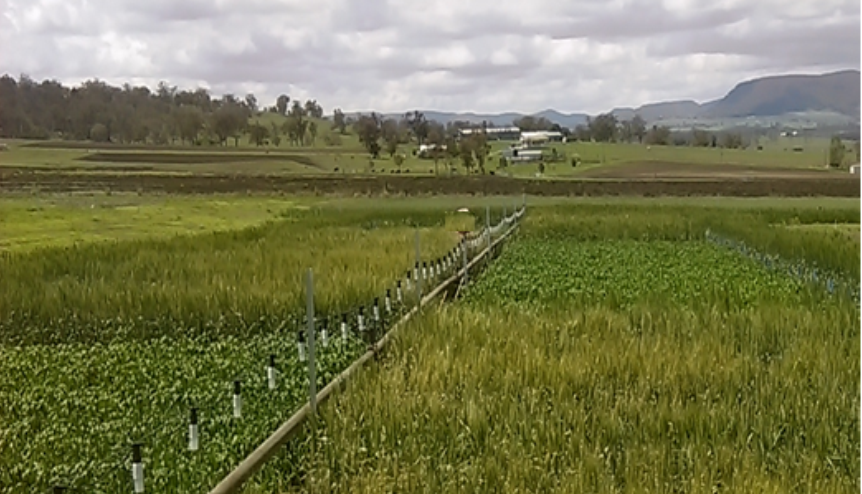
Figure 2. Experimental set up to extend the photoperiod and allow screening of plants receiving heat shocks at matched developmental stages. Lights were installed in the middle of the field, with blocks of different sowing dates. Plants closer to the supplemented light flowered earlier than the plants further away from light.
Results and Discussion
Higher temperature and higher frequency of heat shocks increasingly impede wheat yield
The seasonal average of daily maximum temperatures increased significantly (P<0.1) between 1985 and 2017 at most of the sites across the wheatbelt in south-west WA (Figure 3B), while trends in minimum temperature varied greatly across locations (Figure 3A). Overall, seasonal average daily maximum temperatures increased by 0.56oC per decade across the south-west of WA, while minimum temperature increased by only 0.16oC per decade.
Substantial changes related to increasing temperature were identified with crop modelling simulations. Increasing average temperatures shortened the wheat crop cycle by an average 1.4 days per decade, thus reducing the period available for the crop to acquire resources and develop yield potential (Figure 3C). Heat shocks were estimated to have caused an average 14.5% yield loss (for the studied agronomic practices), with a 1.5% loss in grain number due to pre-flowering heat events and a 13.4% loss in thousand grain weight due to grain-filling heat shocks. The recorded trend of increasing temperatures resulted in yield losses increasing by 3.5% per decade between 1985 and 2017 in Western Australia, mainly due to the increase in post-flowering heat stress affecting thousand grain weight (Figure 3D-E-F).
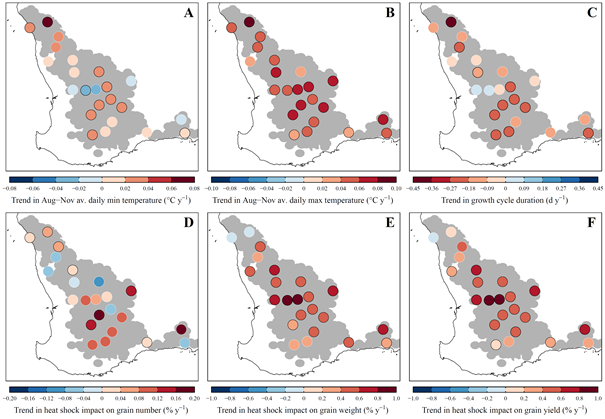
Figure 3. Trends in daily minimal (A) and maximum (B) temperature for August-November, in the duration of the crop growth cycle (C), and in losses due to heat-shock on grain number (D), thousand grain weight (E) and grain yield (F) between 1985 and 2017 for studied locations across the WA wheatbelt. Points circled in black represent significant trends (P<0.1).
A novel field-based screening method for heat tolerance
Using different sowing dates to screen for heat tolerance is a commonly used method that allows screening of many genotypes. One of the main complicating factors of this method is that genotypes typically flower at different times and may thus be impacted by a naturally-occurring heat event at different developmental stages. Hence, interpreting the results can be difficult as genotype performance may be due to either heat tolerance per se and/or differences in phenology with genotypes not all at the same stage in regard to the critical period of heat sensitivity, (i.e. possible escape from the heat sensitive period).
To screen more reliably for heat tolerance irrespective of genetic differences in phenology, a novel method was developed. By adding lights at the end of each row in the field, a gradient of light intensity was produced (Figure 2) and induced a spread of flowering dates along rows of plants from each genotype. This allowed the identification and harvest of spikes with similar developmental stages which had comparable exposure of heat stress. The method was tested in seven environments and compared to results from adjacent traditional field trials, where plots were sown at the same two sowing dates. In most trials, heat events occurred mostly post-anthesis and impacted mainly grain size, with little or no impact on grain number.
In the conventional method based on comparison between different sowing dates, genotype ranking for grain size varied considerably across environments, both between sowings and sites. A maximum correlation of 0.48 was found between first sowings at Gatton and Tosari in 2019 (GAT19s1 and TOS19s1; Figure 4A). For the second sowings, which are more prone to heat stress, the maximum correlation was only 0.1 between trials sown at Gatton and Tosari in 2019 (GAT19s2 and TOS19s2).
With the new method, genotypes were ranked more reliably for heat tolerance. In these trials, thousand grain weight decreased by 1.5g per day with a maximum temperature above 30oC during grain fill (R2 = 0.90; Figure 4C), which is consistent with results from Telfer et al (2018). Importantly, correlations between environments experiencing similar heat stress were strong, ranging from 0.54 to 0.89 (Figure 4B). Correlations were (i) 0.89 for trials with ≤2 hot days with maximum temperature above 30oC during grain fill, (ii) 0.54 for trials with 5-10 hot days, (iii) 0.8 for trials with 10-13 hot days, and (iv) 0.46 for trials with 20-22 hot days. Thus, the method appears promising for improving the reproducibility of screening genotypes in field conditions where heat events occur naturally.
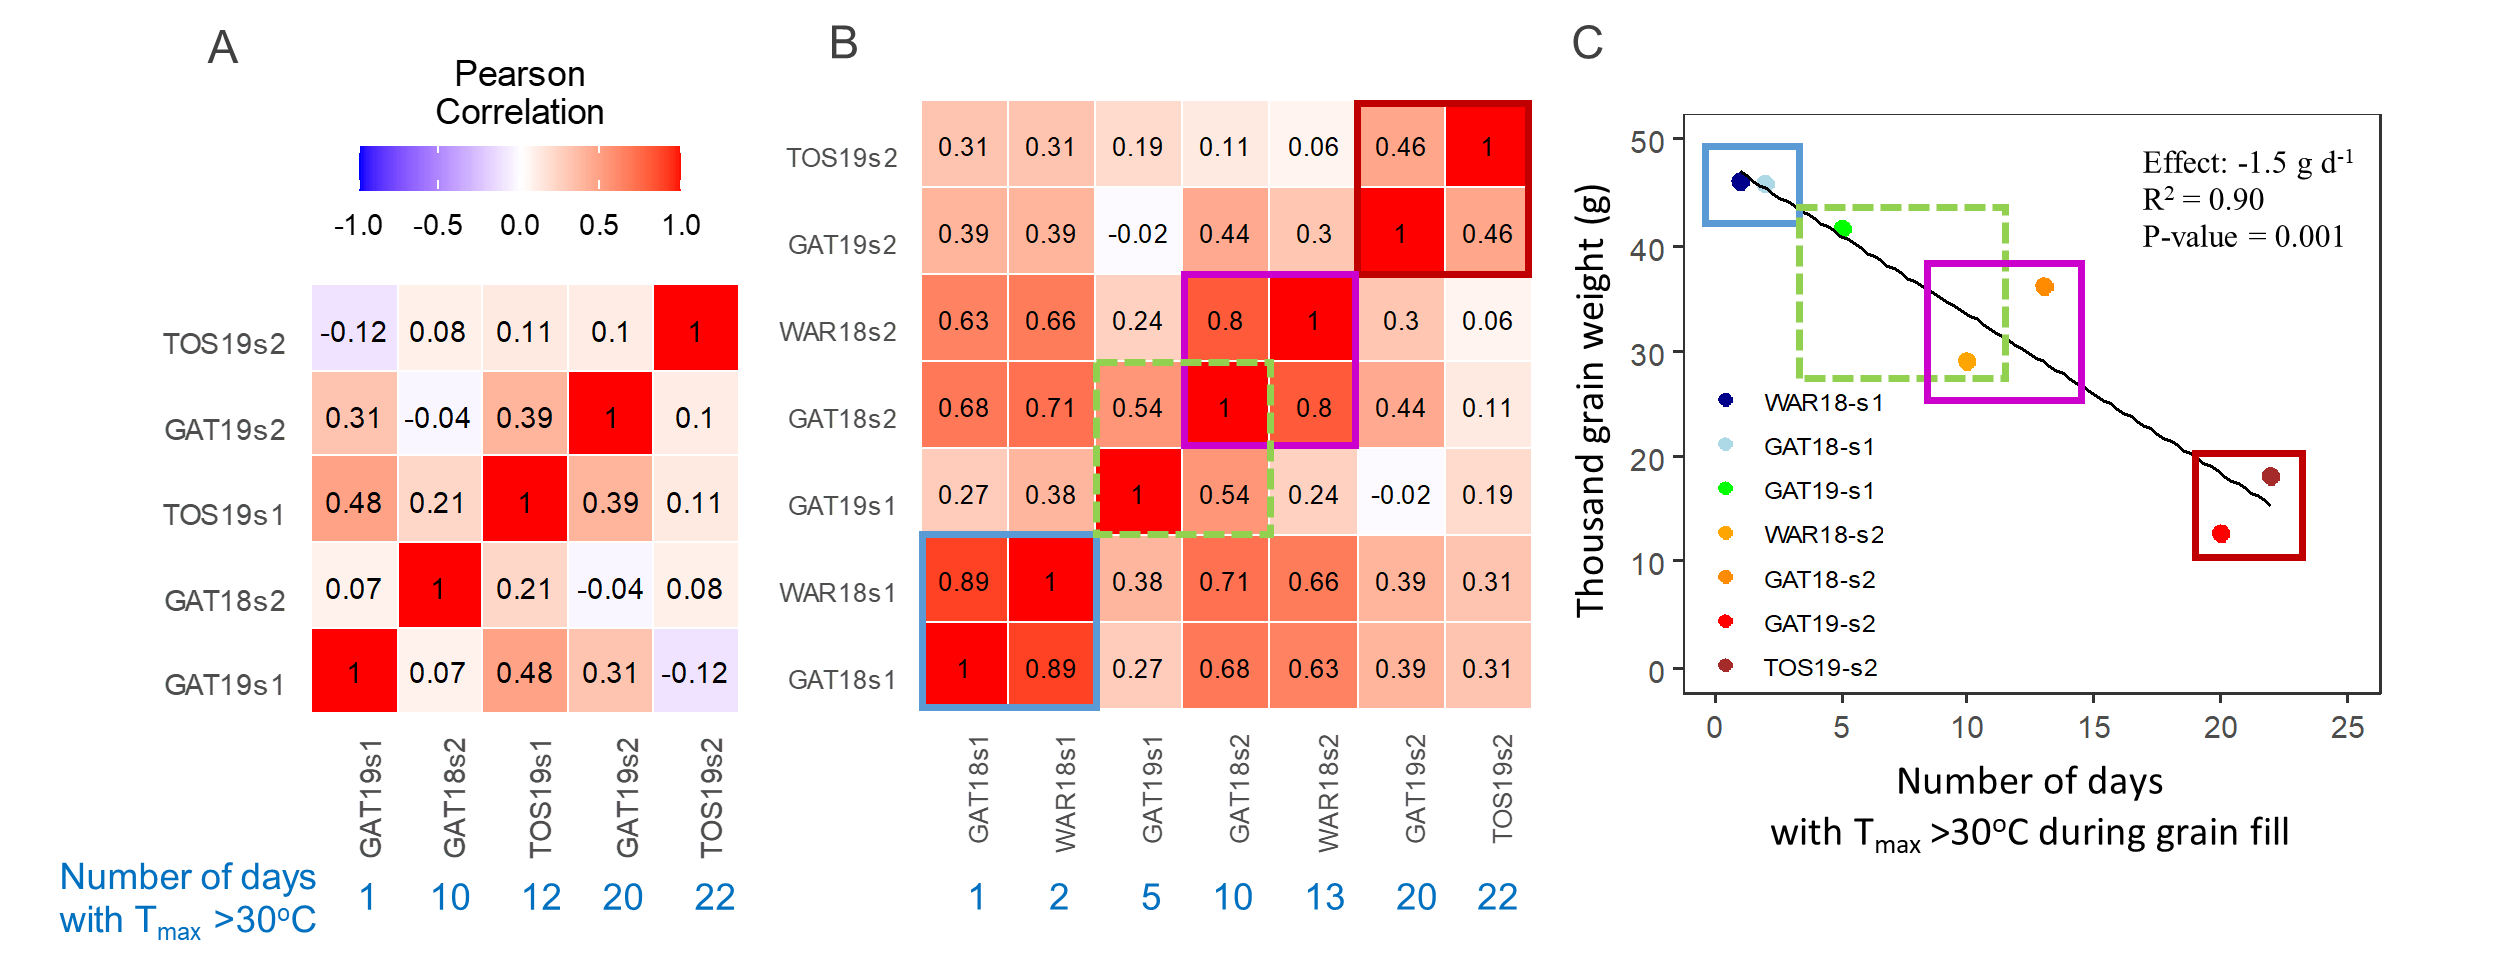
Figure 4.Correlations for thousand grain weight between plot trials (A) and between light trials (B), together with the relationship between trial-mean thousand grain weight and the number of days with a maximum temperature above 30oC during grain fill in the light trials (C). Trials were ordered by increasing number of days with maximum temperature above 30oC during grain fill (values in blue below the heat maps). Coloured boxes indicate environments with a similar number of hot days during grain fill in (B) and (C), highlighting the fact that correlations between trials exposed to similar heat events were high (B). Thousand grain weight was estimated from measurements at the plot level in (A) and at the spike level in (B) and (C).
Conclusion
Heat stress occurring during the grain filling period is impacting Western Australian wheat crops more than pre-flowering heat stress. Heat stress has been increasing over the past few decades. There is an urgency to breed for more heat tolerant wheat cultivars. A new field-based method was developed to screen for heat tolerance irrespective of genetic differences in phenology to accelerate the development of cultivars adapted to a warmer climate.
Acknowledgments
The research undertaken as part of this project was made possible thanks to The University of Queensland and the Queensland Government. We also thank the Queensland Government for an Advance Queensland Fellowship supporting Dr Najeeb Ullah.
References
Ababaei B, Chenu K (2020) Heat shocks increasingly impede grain filling but have little effect on grain setting across the Australian wheatbelt. Agricultural and Forest Meteorology 284:107889.
Chenu K, Deihimfard R, Chapman SC (2013) Large-scale characterization of drought pattern: a continent-wide modelling approach applied to the Australian wheatbelt spatial and temporal trends. New Phytologist 198:801-820.
Chenu K, Oudin F (2019) Heat impact on yield components of fertile primary tillers in wheat can inform crop modelling for future climates. 19th Australian Society of Agronomy Conference, Wagga Wagga, Australia. 4pp.
Collins B, Chenu K (2021) Improving productivity of Australian wheat by adapting sowing date and genotype phenology to future climate. Climate Risk Management. In press.
Farooq M, Bramley H, Palta JA, Siddique KHM (2011) Heat stress in wheat during reproductive and grain-filling phases. Critical Reviews in Plant Sciences 30:491-507.
Hipel KW, McLeod AI (1994) Chapter 2 Basic Statistical Concepts, in Developments in Water Science, vol 45, pp 63-86. Elsevier.
Holzworth DP, Huth NI, deVoil PG, Zurcher EJ, Herrmann NI, McLean G, Chenu K et al. (2014) APSIM – Evolution towards a new generation of agricultural systems simulation. Environmental Modelling and Software 62:327-350.
Hunt JR, Hayman PT, Richards RA, Passioura JB (2018) Opportunities to reduce heat damage in rain-fed wheat crops based on plant breeding and agronomic management. Field Crops Research 224:126-138.
IPCC (2014) Climate change 2014: Synthesis report. Contribution of working Groups I, II and III to the fifth assessment report of the intergovernmental panel on climate change. IPCC, Geneva, Switzerland.
Jeffrey SJ, Carter JO, Moodie KB, Beswick AR (2001) Using spatial interpolation to construct a comprehensive archive of Australian climate data. Environmental Modelling and Software 16:309-330.
Pohlert T (2018) Non-Parametric trend tests and change-point detection. R Package 37.
Prasad PVV, Djanaguiraman M (2014) Response of floret fertility and individual grain weight of wheat to high temperature stress: sensitive stages and thresholds for temperature and duration. Functional Plant Biology 41:1261-1269.
Tashiro T, Wardlaw IF (1990) The response to high-temperature shock and humidity changes prior to and during the early stages of grain development in wheat. Australian Journal of Plant Physiology 17:551-561.
Telfer P, Edwards J, Bennett D, Ganesalingam D, Able J, Kuchel H (2018) A field and controlled environment evaluation of wheat (Triticum aestivum) adaptation to heat stress. Field Crops Research 229:55-65.
Ugarte C, Calderini DF, Slafer GA (2007) Grain weight and grain number responsiveness to pre-anthesis temperature in wheat, barley and triticale. Field Crops Research 100:240-248.
Ullah N, Chenu K (2019) Impact of post-flowering heat stress on stay-green and grain development in wheat. Paper presented at the Australian Agronomy Conference Wagga Wagga, Australia. 4pp.
Zheng B, Chenu K, Dreccer MF, Chapman SC (2012) Breeding for the future: what are the potential impacts of future frost and heat events on sowing and flowering time requirements for Australian bread wheat (Triticum aestivium) varieties? Global Change Biology 18:2899-2914.
Contact details
Email: karine.chenu@uq.edu.au
Was this page helpful?
YOUR FEEDBACK