Using satellite data to assess frost damage
Author: Moira Smith (Digital Content Analysis Technology Ltd (D-CAT)) and Brian Lynch (Elders Ltd) | Date: 18 Aug 2021
Take home messages
- A proven and reliable on-demand frost damage detection service is now available.
- You can order frost damage maps for a given frost event and receive results as soon as the next satellite image for your paddock/farm is available (revisit rate typically 3 days).
- The technology is rooted in trusted ground truth data gathered across Australia and has been subject to validation by Elders across the southern wheatbelt over several years.
- A ‘so what?’ decision aid is also planned that enables comparison of estimated financial returns if all, some or none of the paddock is cut for hay.
Background
In 2017 D-CAT was chosen by Elders to be their remote sensing partner. This led to the launch of AgIntel in 2018, which provides regular field monitoring services for Elders’ agronomists and their clients using satellite imagery. Functionality includes a wide range of insights into crop status, enabling multi-layering of maps, paddock benchmarking, and actioning of data via automated or manually generated variable rate maps.
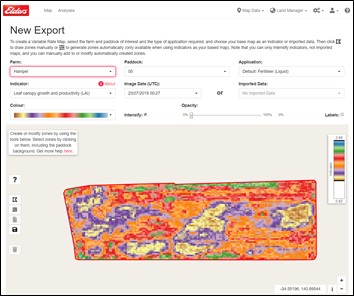
Figure 1. AgIntel screenshot.
D-CAT has listened to the needs expressed by so many for tools to assist with the ever-increasing number of frost events that have to be managed.
Yield loss is a significant issue for Australian grain growers operating in frost prone areas across Australia. Significant financial losses can arise if frost damage occurs and appropriate action isn’t taken. If frost damage is detected early enough, crops can be cut for hay to deliver some financial return to the grower instead of risking crops dying or yielding very little.
Knowing the magnitude of the problem, and the technical challenges posed when harnessing sensor data from space, an R&D project of substance was proposed by D-CAT that would build upon our expertise and capabilities, and focus on an accurate, reliable and commercial outcome. Hence matched funding was sought to enable two seasons of live testing and validation in parallel with R&D activities and historic data analysis, and this was supported by the owners of our satellite of choice, the European Space Agency (ESA). Elders partnered to provide agronomic advice, broadacre sector appreciation, ground truthing and validation effort.
Specifically, the development of this software service addressed the following requirements captured during engagement with advisors and growers across the country, as well as Grain Producers SA:
- Finding damaged crops within days of a frost event is essential if a grower is to be able to assess the impact on the crop and decide whether to cut for hay or leave for yield. Being able to ‘call up’ a map on demand showing areas of damage and quantifying them is desired, and automated variable rate maps would enable detailed cutting for those operating precision agriculture (PA) equipment.
- Having found areas of damaged plants via a map of relative damage, deciding to cut is a cost/benefit decision: cut all for hay, just some for hay, or leave for yield. A financial decision tool would help greatly.
- Any service has to be cost-effective as well as trusted (accurate, reliable, sound basis).
Method
The project built upon initial work undertaken on frost damage detection by D-CAT, and developed an automated, on-demand service that uses Sentinel-2 [1] as the main data source. Sentinel-2 is one of ESA’s Copernicus mission constellations which comprises two satellites, each of which is equipped with a highly advanced multispectral sensor that was specifically designed to meet the needs of agriculture clients worldwide. With an update over most of the planet every three to five days, an image resolution of 10m, and one of the richest sets of spectral measurements available, Sentinel-2 was the obvious satellite of choice. For broadacre farming, where interventions are often at the resolution of 15m using typical equipment, 10m provides sufficient detail to enable PA to be applied (although it is noted that often straight lines are preferred for hay cutting even when detailed shapes are available as VR maps).
Our approach was one of iterative development utilising the latest machine learning (ML) techniques, which relies on large volumes of appropriate, timely and accurate ground truth data as well as satellite imagery. Such data is essential for training of the algorithm, but also for its testing against known outcomes so that accuracy can be quantified. The method extended to include data fusion (the intelligent combination of different data sources, such as weather) in order to achieve high levels of reliability and accuracy. A number of fusion approaches were explored, as well as a range of preferred ML techniques, and understood in detail before successive development iterations resulted in a final design. Included in the study were a wide range of possible data for fusing, yield maps from damaged paddocks for informing training, hand-drawn maps of damaged areas, and constant engagement with advisors and growers regarding our latest results and their needs.
Avoiding model bias is essential when developing quality ML algorithms, and so much effort was spent ensuring an unbiased model was achieved. Collection of extensive ground truth data from across a variety of broadacre farms in the Australian wheat belt assisted greatly with this process. Ground truth data included the location, date and extent of damage and was provided by growers and agronomists. In some cases, yield maps were also shared to illustrate impact on yield.
Data cleansing and analysis is another essential ingredient in the process of developing trusted ML models, and this was performed before a range of machine learning techniques were applied to explore the potential for accurate detection of frost damage across the crops affected in areas as small as one pixel. An optimised algorithm was the result of much development effort over the project’s duration, delivering very good detection probabilities across all paddocks tested.
The final step in the development, once the frost damage detection algorithm had amassed a substantial validation case that saw it deemed as ready for market, was the extension to include a financial decision model using P2PAgri. This enables a grower or agronomist to trade-off the cost and return that is likely to occur given three different scenarios:
- cutting all crop in the paddock for hay;
- leaving it all to mature to grain;
- or cutting only the damaged areas.
Scenarios were designed, tested and independently verified by Elders.
Results and discussion
Frost damage detection
The algorithm was tested across more than one hundred sites across Australia, covering hundreds of millions of data points, and validated for the following broadacre crops: wheat, barley, canola, oats, field peas. Seasons 2019 and 2020 provided in-situ measurements and assessment of damage as well as yield maps (not available from all farms). Previous seasons were also used for wider testing and evaluation but ground truth data for such cases was less reliable as hand-drawn maps from memory were sometimes the only data available for certain locations. Others provided historic yield maps. In all cases, only trusted, properly calibrated yield data was used for testing and validation.
An example of hand-drawn ‘ground truth’ data provided is shown below for two paddocks, with the algorithm-generated frost damage risk maps next to them. Each 10m x 10m pixel is assigned a likelihood of damage score for that paddock, ranging from 0 (no likelihood) to 1 (highest likelihood). The values are coloured, typically, using a traffic light colouring system of green (no likelihood of damage) to red (highest likelihood of damage). However, in the greyscale print used for this document colour variation will not be evident.
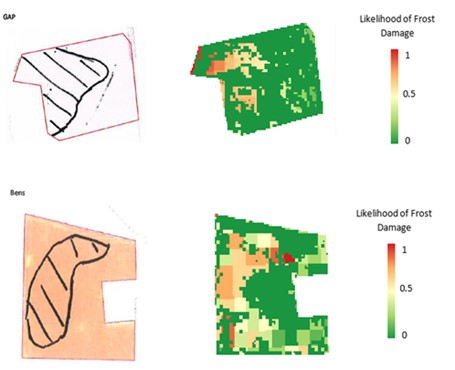
Figure 2. Frost damage likelihood maps (right) with grower-supplied ‘ground truth’ (left).
Often satellite image processing is only known for, or associated with, a parameter called NDVI (Normalised Difference Vegetation Index). An important result to note from our research is its inability to be used as any reliable indicator of frost damage in crops. Figure 3 below shows the inseparability of frosted and non-frosted cereal crop NDVI values gathered into histograms from our substantial data sets.
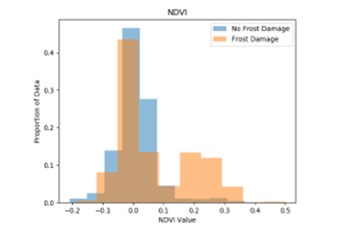
Figure 3. Histograms of NDVI values for frost damaged and undamaged crops.
Quantifying accuracy against some ground truth data was challenging due to the error bounds associated with the hand-sketched maps. Yield maps and other data provided by in-situ measurements allowed more reliable quantification, and classical ML metrics such as precision and recall were also used to determine algorithm performance and any limitations. Overall, high levels of performance were noted, and across all crops, with no frosted paddocks not detected and false positives extremely rare. One common way to summarise performance of a classifier is a Confusion Matrix, which is used here to compare the algorithm output (‘Predicted’) to the actual case across the greater than 200 000 sample locations tested (Figure 4).
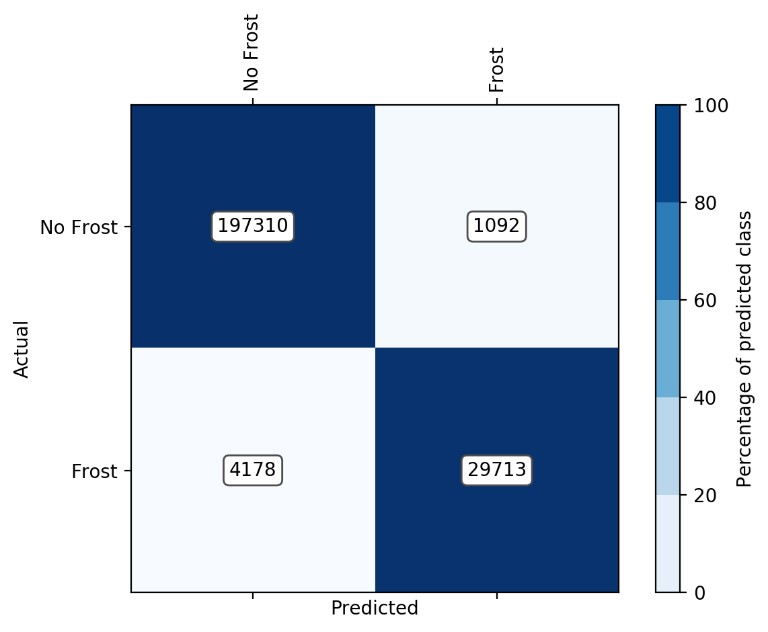
Figure 4. Confusion matrix from a sample validation test.
Financial decision aid
When a paddock has been damaged by frost, the algorithm can then be used as input to a financial model from P2PAgri which calculates the predicted profit for the paddock given one of three outcomes: all crop is cut for hay; only those areas identified as damaged are cut for hay; or the whole crop is left to mature to grain.
Figure 5 below shows a screenshot of the financial calculator tool, which takes the percentage of the paddock that has been damaged as one input, crop type, hay price, grain price and other key factors as input. The output of the tool for the paddock shown in Figure 5 was:
| 1. | Cut all for hay | Loss of $47 |
| 2. | Leave all for grain | Profit of $669 |
| 3. | Cut only damaged crop for hay, leave rest for grain | Profit of ~ $15K |
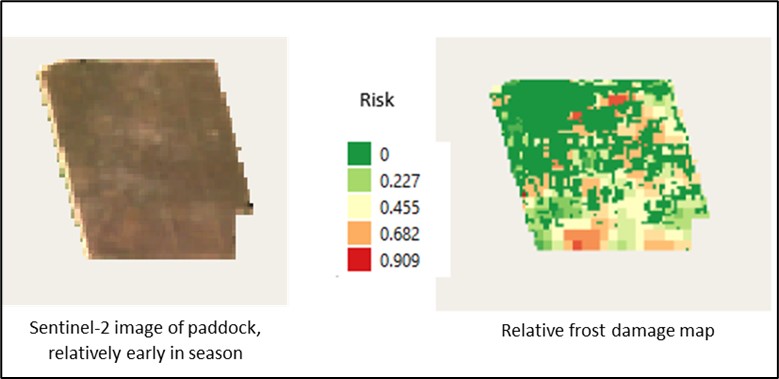
Figure 5. Example showing paddock, frost damage risk map and financial tool.
Conclusion
Satellite imagery has been shown to be capable of reliably detecting the signs of damage that is typical of when a crop (wheat, barley, canola, oats, field peas proven) has been frosted. This is only possible through careful pre-processing and data cleansing to ensure that it is radiometrically accurate and reliable before it is subjected to an advanced classifier that fuses multiple data sets, including spectral bands from the Sentinel-2 satellite, and produces a frost damage likelihood map for the paddock as well as area and percentage statistics. If operating a PA farm, then a VR map can be exported and used in equipment.
A valuable addition is the financial tool that will assist in decision making around whether to cut for hay or leave for grain. Results are available almost as soon as a satellite has passed over the crop, but cloud patches will automatically be removed from any imagery to avoid any false reporting.
Acknowledgements
D-CAT wishes to thank the European Space Agency for its co-funding of this project, and the partnership of Elders throughout the project where they provided invaluable agronomic and application advice, ground truth data and validation effort. Growers who kindly agreed to engage with D-CAT as well as their Elders’ advisors are also thanked for their contributions and data provided.
Useful resources
References
Contact details
Moira Smith
D-CAT Ltd
65 Gilbert St, Adelaide, SA 5000
0416 353677
moira.smith@d-cat.com.au
@DCATSolutions
Brian Lynch
Elders
15 E Terrace, Loxton, SA5333
0429 678952
brian.lynch@elders.com.au
@BLynch81
Was this page helpful?
YOUR FEEDBACK