Farming systems performance at a ‘macro’ scale: effects of management strategies on productivity, profit, risk, WUE
Take home message
- Field experiments and simulation at 4 sites in southern NSW (2018 to 2020) investigated effects of crop diversity, early sowing (+/- grazing) and N fertiliser strategies on productivity, profit, risk and WUE of the system – using typical May-sown canola-wheat-wheat systems as a ’Baseline’
- At all sites we identified systems that were (1) more profitable by $200-300/ha, (2) less risky, (3) had stable/declining weed and disease burdens, (4) lower average input costs and (5) robust in the long term - compared to the baseline systems
- In mixed (grazing) systems, the most profitable systems involved early sown grazed crops (wheat-canola) with a higher (decile 7) N fertiliser strategy or in sequence with a legume (vetch)
- In crop-only systems, timely-sown, diverse sequences with high value legumes and a more conservative (decile 2) N strategy were most profitable
- A second phase of the experiments (2021-2023) has commenced, along with further analysis of phase 1 data and its implications at the whole-farm scale.
The Southern Farming Systems Project – a brief description
The southern NSW farming systems project (CFF00011) was established in July 2017 after a 12-month consultation period and extensive literature review demonstrated a significant gap in profitability and efficiency ($/ha/mm) of current cropping systems (i.e., actual vs potential) despite good agronomy of individual crops. The average annual gross margin of the best 3-4-yr sequences was often ~$400/ha higher than the worst, and $150 to $250/ha higher than the most common ’baseline’ sequences. We established research sites in 2017 and associated simulation studies to investigate strategies to increase the conversion of rainfall to profit ($/ha/mm) across a crop sequence while managing weeds, diseases, soil fertility and risk.
Four sites established in 2017 covered soil and climate variability across southern NSW at Greenethorpe, Wagga Wagga and Condobolin (high, medium and low rainfall sites on red acidic loam soils), and a 4th site on a sodic clay vertosol at Urana. At each site, the ’baseline’ system (sequence of canola-wheat-wheator canola-wheat-barley; timely sown in late April-early May; and with a conservative decile 2 N strategy – i.e. N applied assuming rainfall under decile 2 (drier) conditions) was compared with a range of other systems that varied in (i) crop diversity (inclusion of legumes), (ii) sowing time (early and timely) and (iii) N strategy (conservative decile 2 and optimistic decile 7 (wetter)). Management protocols for all other input and management decisions (e.g., tillage and stubble management; variety choice; herbicide, fungicide and pesticide applications) were agreed by the project team using a consensus approach of best practice that was continually reviewed.
In the following sections we will focus on selected results that explore the consequences of these strategies in terms of productivity, efficiency and risk in different systems outlined in Table 1.
Table 1. Selected treatments common to most sites including crop sequence, time of sowing and N strategies. Early sown (March) treatments included winter grazed crops at Wagga and Greenethorpe. Diverse systems that include different legume options are shown in grey.
Treatment description | Sequence | Sowing time | N strategy (Decile 2 or 7) | Grazing |
|---|---|---|---|---|
Baseline | Canola-wheat-barley | Timely | 2, 7 | No |
Intense Baseline | Canola-wheat | Early, timely | 2, 7 | Yes |
Diverse high value 1 | Lentil-canola-wheat | Early, timely | 2, 7 | No |
Diverse high value 2 | chickpea-wheat | Timely | 2 | No |
Diverse low value | (Faba/lupin)-canola-wheat | Timely | 2 | No |
Diverse (mix) | HDL*-canola-wheat | Early, timely | 2, 7 | Yes |
Continuous wheat | Wheat-wheat-wheat | Timely | 2, 7 | No |
Fallow | Fallow-canola-wheat | Early, timely | 7 | No |
Early sowing= from March 1; Timely sowing = late April to mid-May
N strategies: Decile 2 or Decile 7 apply top-dressed N each year in July assuming the season will finish as Decile 2 (lower yield and less N) or Decile 7 (higher yield so more N). N requirement is adjusted in each to account for soil N measured pre-sowing, so carry-over N from previous seasons means less N will be required and so legume or fertiliser legacy effects are captured.
Seasonal conditions at the sites 2018-2019-2020 seasons
The 2018 and 2019 seasons were dry (decile 1-2) across the sites, while 2020 was decile 7-9 across the sites (Table 2).
Table 2. Rainfall (+irrigation) (mm) at the experiment sites from 2018 to 2020 and the long-term median rainfall (LTM) and the decile for that season (brackets).
Site | 2018 | 2019 | 2020 | LTM |
|---|---|---|---|---|
Greenethorpe | 359 (2) | 353 (2) | 726 (10) | 579 |
Wagga Wagga | 403 (3) | 320 (2) | 557 (8) | 526 |
Urana | 276 (1) | 222 (1) | 488 (6) | 449 |
Condobolin | 218+120 (1) | 162+118 (1) | 685 (9) | 434 |
As would be expected, the productivity and profitability of the individual crop options differed significantly between the Decile 1-2 conditions in 2018 and 2019, and the wetter conditions in 2020 (and 2021). A detailed consideration of the productivity and profitability of the different crops and systems under the dry conditions in 2018 and 2019 was provided in two previous papers and are provided in the reading list (Kirkegaard et al ,2020a, b).
In this paper we report productivity, profitability, WUE, risk for selected systems (Table 1) during Phase 1 (2018-2020).
Productivity
A summary of overall productivity (grain yield) at the sites is shown in Table 3 with the mean yield for each crop type at the sites in the dry years of 2018/2019 and the wet years of 2020/21 separated for comparison. Some general observations regarding the yield in different systems can be made.
Typically, the grain yield did not respond to the higher N strategy in the dry years although hay yield and grazing forage was increased, but in the wetter years of 2020 and 2021 there were significant and profitable responses to the increased N supply, either from the higher Decile 7 N strategy, or from a previous legume crop. Grain yield and protein, as well as the response to higher N tended to be greater in systems with higher crop diversity and less intense cereal systems (e.g., double break compared to continuous wheat. For example, in early sown, un-grazed systems, with high N supply (either fertiliser or legume) and high diversity (i.e., after double breaks) wheat yields of 8 to 9 t/ha with 12-14% protein, and canola yields of 4 to 5.5 t/ha with >45% oil were achieved.
Table 3. Average yield and yield range for crops at 4 farming systems sites during dry (2018-19) and wet (2020-21) seasons.
Crop | Sow | Greenethorpe | Wagga | Urana | Condobolin | ||||
|---|---|---|---|---|---|---|---|---|---|
2018-19 | 2020-21 | 2018-19 | 2020-21 | 2018-19 | 2020-21 | 2018-19 | 2020-21 | ||
Wheat | E Gr | 2.0 | 6.1 | 2.1 | 6.0 | - | - | - | - |
E | 2.5 | 8.5 | 1.3 | 6.3 | 1.4 | 7.2 | 1.8 | 5.8 | |
T | 2.5 | 7.6 | 2.1 | 6.6 | 2.6 | 7.3 | 2.2 | 4.4 | |
Canola | E Gr | 0.4 | 3.8 | 0 | 2.8 | - | - | - | - |
E | 1.5 | 4.3 | 0.5 | 3.6 | 1.2 | 3.5 | 1.8 | 3.1 | |
T | 1.1 | 4.8 | 1.3 | 3.8 | 1.6 | 2.2 | 1.2 | 3.0 | |
Lentil | T | 1.3 | 3.0 | 1.1 | 4.1 | 1.7 | 3.6 | 1.1 | 2.2 |
Chickpea | T | 2.0 | 3.5 | 0.9 | 3.1 | - | 4.2 | 1.5 | 2.3 |
Lupin | T | - | - | 1.5 | 4.1 | - | - | 1.2 | 2.4 |
Faba | T | 2.2 | 6.5 | - | - | 1.9 | 6.6 | - | - |
E=Early sowing (March); T=Timely sown (mid-April to mid-May); Gr=Grazed (i.e., dual-purpose)
Systems performance at the macro scale
In the following sections on profitability, WUE and risk we will consider the impacts of early sowing (+/- grazing), crop diversity, and N strategy at each of the sites by comparing the systems with the baseline system which involves sequence of canola-wheat-wheat or canola-wheat-barley sown in early May, and with a conservative Decile 2 N strategy. In all Figures, the baseline system is shown in solid black for easy identification and comparison.
Important note: Assumptions made to calculate profit (earnings before interest and taxes (EBIT)) for the systems, including estimating a potential value for the forage removed by grazing are provided in the Appendix. Crops were heavily grazed over short periods providing very effective forage utilisation, so the grazing income should be considered as potential. The actual profits realised will be enterprise dependent so modifications to the assumptions made (see Appendix) should be considered (i.e. trading, breeding, agistment etc).
Profitability (EBIT)
Early sown grazed systems
Early sown (March) grazed crops (wheat and canola) were highly profitable in all seasons at both sites compared to the early-sown un-grazed equivalent treatments (Table 4). This was due to the income from grazing which has more than compensated for any grain yield penalties. The early-grazed systems were also more profitable than the baseline systems (Table 4). More detailed grazing forage and yield information are provided in a separate paper on dual-purpose crops (Erica please provide link to my DP paper here).
Grazing provided a much greater increase in profit at Greenethorpe than at Wagga Wagga due to the longer-season, higher rainfall, deeper soil to accommodate deep rooting and higher background fertility. Grazed crops were especially profitable in the dry years (2018-19) when many grain crops failed or were cut for hay. Grazed wheat and canola crops were also responsive to the higher N supply (from both fertiliser and/or the vetch legacy effects) due to increases in both forage and grain yield from higher N.
In the un-grazed systems, the early-sown system (lentil-canola-wheat) was less profitable than the timely-sown baseline system at both sites, mostly due to the fact that the true winter wheat and canola types performed poorly in the 2018 and 2019 droughts due to later flowering under hot, dry conditions. Early sowing (March) for un-grazed crops (as in Phase 1) is unwise, however careful varietal selection and more appropriate sowing dates for early-sown crops (early to mid-April) have been included in Phase 2 to better investigate the benefits of earlier sowing in un-grazed systems.
Table 4. Average annual 3-year EBIT for early-sown grazed systems compared with early-sown un-grazed systems (winter wheat and canola, vetch) at Wagga Wagga and Greenethorpe. The baseline system of timely-sown spring canola, wheat and barley is shown for comparison.
System | Sequence | N Strategy | Wagga Wagga | Greenethorpe |
|---|---|---|---|---|
Early-sown (March) grazed | ||||
Intense Baseline | W-C-W | Decile 2 | $642 | $1,191 |
Decile 7 | $754 | $1,421 | ||
Diverse | Vetch-C-W | Decile 2 | $671 | $1,267 |
Decile 7 | $777 | - | ||
Early-sown (March) un-grazed | ||||
Diverse High Value | Lentil-C-W | Decile 2 | $477 | $473 |
Decile 7 | $386 | $450 | ||
Timely-sown (early May) un-grazed | ||||
Baseline | C-W-W or C-W-B | Decile 2 | $528 | $720 |
Decile 7 | $542 | $653 | ||
W=wheat, C=canola, B=barley
Timely-sown grain-only systems
For timely-sown systems, several diverse sequences that include legumes outperformed the Baseline canola-wheat sequences at all sites (Table 5). This was true during both dry and wet seasons (data not shown). However different legume options performed best at different sites (as shown in grey in Table 5) demonstrating the need to consider the best option for different situations. The profitability of the diverse systems resulted from both the profitability of the legumes, and in some cases the significant legacy of increased soil water (20-60 mm) and/or soil N (50-100 kg/ha) on subsequent crops (Erica please include link to the paper by Swan and Dunn).
The most consistently profitable diverse system was timely-sown, high-value legume systems (chickpea or lentil)-canola-wheat with Decile 2 N, but the low-value diverse system (faba-bean or lupin-canola-wheat) also outperformed the baseline at three of the sites.
Adopting a higher N strategy in the baseline treatment reduced profit at Greenethorpe and had little impact at Wagga, and at both sites did not exceed the profit in the diverse systems at the lower N2 strategy. In other words, using more N fertiliser was not as profitable as adopting a more diverse system involving a legume under the conditions experienced in Phase 1.
Table 5. Average annual 3-year EBIT for timely-sown grain-only systems at four sites in southern NSW (2018-2020). The Baseline system of timely-sown canola-wheat-wheat/barley with Decile 2 N strategy is shown in bold, while the most profitable system at each site is shown in grey. At all sites, there were diverse systems that included legumes that were more profitable than the baseline.
System | Sequence | N Strategy | Greenethorpe | Wagga | Urana | Condobolin |
|---|---|---|---|---|---|---|
Baseline | C-W-W or C-W-Barley | Decile 2 | $720 | $528 | $488 | $534 |
Decile 7 | $653 | $542 | - | - | ||
Diverse | Lentil-C-W | Decile 2 | - | $588 | $775 | $522 |
Decile 7 | - | $510 | $609 | - | ||
Diverse | Chickpea-W | Decile 2 | $808 | $505 | - | $735 |
Decile 7 | - | - | - | - | ||
Diverse | Faba-C-W or Lupin-C-W | Decile 2 | $739 | $626 | $655 | $517 |
Decile 7 | - | - | - | - |
W=wheat, C=canola
System water-use efficiency (WUE)
To compare how efficiently the different systems convert rainfall to profit for the entire 3-yr crop sequence, we estimated system WUE as (average annual profit)/ (average annual rainfall). By using annual rainfall and not growing season rainfall, we account for the use of out-of-season rainfall. Our initial literature review predicted we could lift the system WUE from ~$1/ha/mm up to $2/ha/mm. Due to the relatively similar patterns of rainfall across the years at all three sites (Table 2), the trends in system WUE tend to follow very similar trends to those shown in Tables 4 and 5 for profitability (Table 6).
In timely-sown systems (Table 6, upper section), the diverse sequences including legumes outperformed the baseline sequences at all sites. Highest efficiency (>$2/ha/mm) was achieved at Urana in high-value diverse systems with decile 2 N strategy, which decreased to $1.5/ha/mm with the higher N strategy. Thus, adopting a higher N strategy in baseline systems reduced profit at Greenethorpe and also at Wagga, presumably due to the dry 2018/19 year limiting N response.
The early-sown grazed systems (lower Table 6) generated the highest profit from the available rainfall. The high N intense baseline treatment at Greenethorpe generated close to $3/ha/mm, and low N or diverse systems with grazed vetch also exceeded $2/ha/mm. At Wagga levels were lower, but higher N or inclusion of a legume increased System WUE, but the combination was less effective. Early un-grazed systems were much less efficient than the grazed systems, and less than (Greenethorpe) or similar too (Wagga) that achieved in the baseline system.
Table 6. The system water use efficiency ($/ha/mm) for selected systems at 4 sites in southern NSW (2018-2020). System WUE = average annual EBIT/average annual rainfall.
System | Sequence | N Strategy | Greenthorpe | Wagga | Urana | Condobolin |
|---|---|---|---|---|---|---|
Baseline | C-W-W orC-W-Barley | Decile 2 | 1.4 | 1.0 | 1.2 | 1.5 |
Decile 7 | 1.2 | 0.9 | - | - | ||
Diverse | Lentil-C-W | Decile 2 | - | 1.1 | 2.0 | 1.2 |
Decile 7 | - | 0.9 | 1.5 | - | ||
Diverse | Chickpea-W | Decile 2 | 1.5 | 0.9 | - | 1.6 |
Decile 7 | - | - | - | - | ||
Diverse | Faba-C-W orLupin-C-W | Decile 2 | 1.4 | 1.2 | 1.7 | 1.2 |
Decile 7 | - | - | - | - | ||
Early-sown (March) systems | ||||||
Intense Baseline | C-W | Decile 2 | 2.3 | 1.2 | ||
Decile 7 | 2.8 | 1.5 | ||||
Diverse Mix | Vetch-C-W | Decile 2 | 2.1 | 1.6 | ||
Decile 7 | - | 1.3 | ||||
Diverse | Lentil-C-W | Decile 2 | 0.8 | 1.0 | ||
Decile 7 | 0.8 | 0.8 | ||||
W=wheat, C=canola
Risk
One risk measure is the return-on-investment (ROI) which is the $ profit generated (EBIT) per $ spent. For these estimates we divided the EBIT by the total input costs (see Appendix).
In general, the ROI follows a similar pattern to the profit and systems WUE in the timely-sown treatments with highest ROI at each site in the diverse systems with decile 2 N (Table 7, upper). However, there were some differences in ranking of the systems at Greenethorpe, where the baseline strategy matched the diverse high value systems and exceeded the diverse low value system. The relative input costs for the more diverse strategies outweighed the additional profit generated compared to the baseline strategy. At Wagga Wagga and Urana, the ROI decreased when higher N strategy was applied to the diverse high value system, as the additional N cost more for little benefit due to the higher N available after the legumes.
In the early-sown intense baseline grazed systems (lower Table 7), the ROI was not improved in the higher N strategy despite high profit (Table 7 lower), indicating more investment was required to generate the profit. The diverse grazed system with vetch had lower ROI than the intense baseline at Greenethorpe, but higher ROI at Wagga Wagga. The early-sown, un-grazed systems with lentils had low ROI due to the very low profit generated although at Wagga the ROI matched that of the baseline.
Table 7. Return on investment (ROI) ($ profit/$ input) for selected systems at 4 sites in southern NSW (2018-2020). Efficiency is estimated as average annual EBIT divided by average input cost and is a measure of financial risk.
System | Sequence | N Strategy | Greenthorpe | Wagga | Urana | Condobolin |
|---|---|---|---|---|---|---|
Baseline | C-W-W orC-W-Barley | Decile 2 | 1.2 | 0.7 | 0.7 | 1.3 |
Decile 7 | 1.0 | 0.6 | - | - | ||
Diverse | Lentil-C-W | Decile 2 | - | 0.8 | 1.2 | 1.1 |
Decile 7 | - | 0.6 | 0.8 | - | ||
Diverse | Chickpea-W | Decile 2 | 1.2 | 0.6 | - | 1.4 |
Decile 7 | - | - | - | - | ||
Diverse | Faba-C-W orLupin-C-W | Decile 2 | 1.0 | 0.9 | 1.0 | 1.0 |
Decile 7 | - | - | - | - | ||
Early-sown (March) systems | ||||||
Intense Baseline | C-W | Decile 2 | 2.4 | 1.1 | ||
Decile 7 | 2.4 | 1.1 | ||||
Diverse Mix | Vetch-C-W | Decile 2 | 2.1 | 1.5 | ||
Decile 7 | - | 1.1 | ||||
Diverse | Lentil-C-W | Decile 2 | 0.7 | 0.8 | ||
Decile 7 | 0.6 | 0.6 | ||||
W=wheat, C=canola
Simulated performance of systems in the longer term
Long-term simulation studies (which capture the water and N impact only) show a range in annual median EBIT of different systems consistent with the experimental outcomes ($400/ha to $1400/ha). Figure 1 shows a summary at the four sites of three different un-grazed sequences (intense baseline C-W; high value diverse Cp-C-W; baseline C-W-W) timely sown, and with different N strategies of decile 2, 5, 7 and 9. The long-term simulation results show consistency with the experimental results for example:
- The sequence including a legume is more profitable than the baseline
- The response to increasing N from decile 2 to 7 N strategy is profitable in the baseline and intense baseline sequences without legumes, but less profitable in sequences with a legume
- Interactions exist between sites and systems.
For example, earlier sowing and more robust N strategies were more profitable at Greenethorpe (high rainfall) but resulted in profit penalties at Condobolin. The diverse crop sequence option with lower N rates generated some of the highest gross margins with less variability.
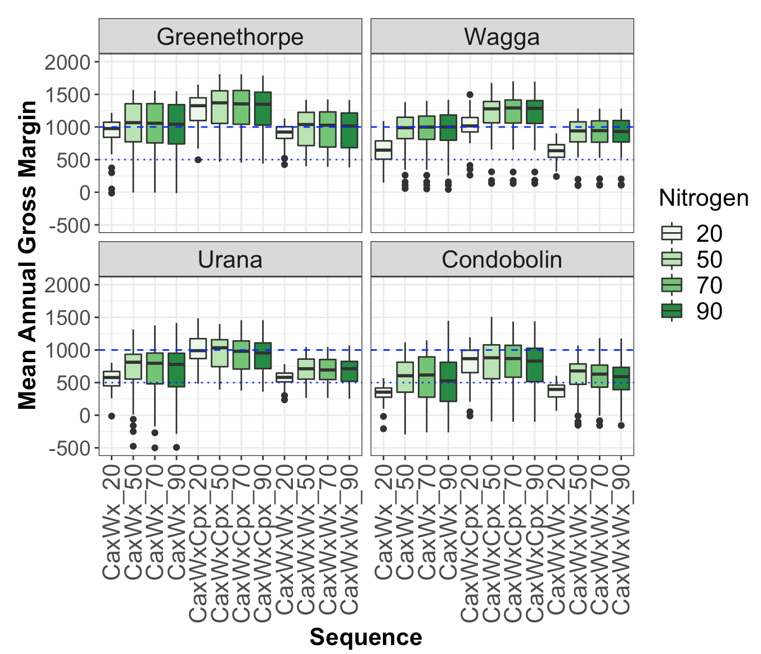 Figure 1. Average gross margins ($/ha/yr) calculated on a sequence basis across all sites for three selected sequences (intense baseline Ca-W; high value diverse Ca-W-Cp; baseline C-W-W) with four different N fertiliser topdressing strategies (decile 2, 5, 7, 9 are shown as 20, 50, 70, 90). (Ca=canola; W=wheat; Cp=chickpea).
These diverse options also combine higher average profit, with higher profit in the lowest 20% of years, demonstrating reduced risk and increased resilience (Figure 1) and more efficient water use in both average and poorer seasons (Figure 2).
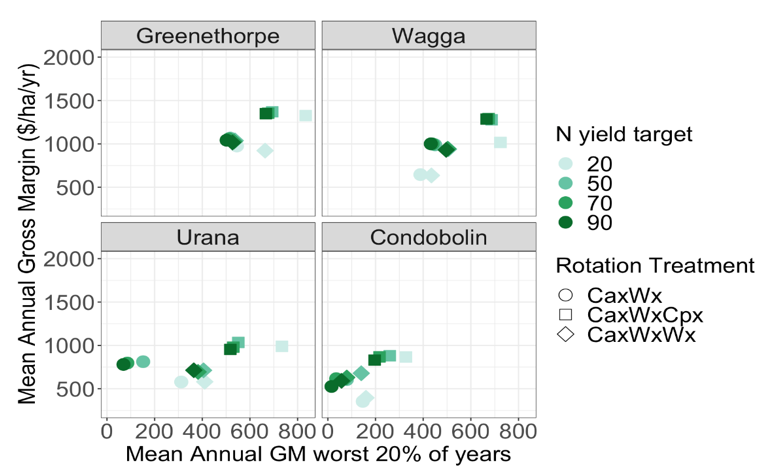 Figure 2. Average gross margins ($/ha/yr) plotted against average gross margin in the worst 20% of years as an indicator of risk. Sequences (intense baseline Ca-W; high value diverse Ca-W-Ch; baseline Ca-W-W) with four different N fertilizer topdressing strategies. (decile 2, 5, 7, 9 are shown as 20, 50, 70, 90). (Ca=canola; W=wheat; Cp=chickpea.)
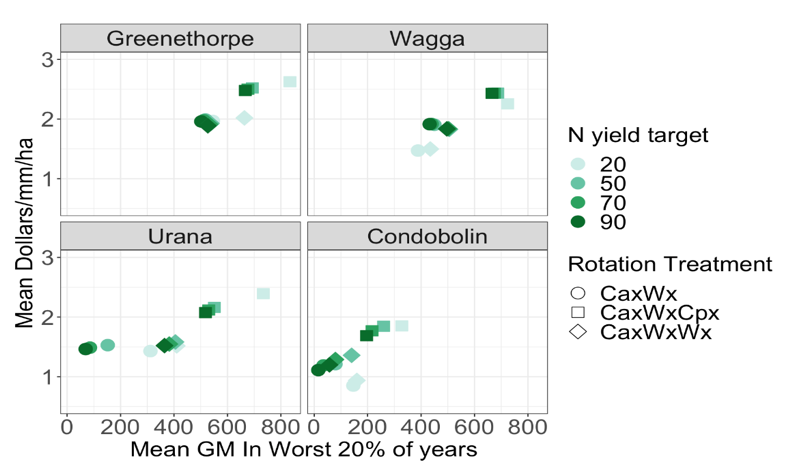 Figure 3. Average water use efficiency ($/ha/mm) plotted against average gross margin in the worst 20% of years as an indicator of risk. Sequences (intense baseline Ca-W; high value diverse Ca-W-Cp; baseline Ca-W-W) with four different N fertilizer topdressing strategies (decile 2, 5, 7, 9 are shown as 20, 50, 70, 90). (Ca=canola; W=wheat; Cp=chickpea).
Conclusion
At all experimental sites, we identified systems with higher 3-yr average annual profit (EBIT) (2018-2020), higher WUE and ROI than the baseline system. These more profitable systems included early-sown, grazed crops (wheat, canola) with either a legume (vetch) or higher N strategies. In crop only (un-grazed) systems, the timely sown, diverse sequences with high value legumes and more conservative N (decile 2) strategies were the most profitable. There was also evidence of decreasing disease risk and stable or declining weed populations and a much lower average herbicide cost in the diverse systems compared to the baseline systems at all sites. Longer-term simulation modelling also predicted that these diverse systems also carried lower risks expressed by both variability in annual profit, and profit in the lowest 20% of years.
Our first 3-year experimental phase has identified systems at all sites with significantly higher profit and lower risk than the current baseline systems, with stable or declining weed and disease burdens and with economic benefits that appear robust in the longer-term. These improved strategies and systems (worth $100 - $300/ha) are immediately relevant to the ~3.5 Mill ha of winter cropping in southern NSW which produces around 7.5 Mt of grain valued at ~$2.5 Bill pa. Assuming adoption of strategies worth only half the demonstrated increase (i.e., $100/ha) could be achieved on only 10% of the area, would still represent a potential value from the investment of $35 Mill pa.
Acknowledgements
The research undertaken as part of this project is made possible by the significant contributions of growers through both trial cooperation and the support of the GRDC. The author would like to especially thank Mr Rod Kershaw at “Iandra” Greenethorpe and Warakirri Cropping “Karoola Park” Urana for the use of land for experimental purpose and for management advice at the sites. We also thank Peter Watt (Elders), Tim Condon (DeltaAg), Greg Condon (Grassroots Agronomy), Heidi Gooden (DeltaAg) and Chris Baker (BakerAg) for the many useful discussions in their role on the Project Advisory Committee.
Further reading
Kirkegaard J, Swan S, Sandral G, Whish J, Leighton E, Bullock M, Friske K and Pumpa R. (2020a) Farming systems: profit, water, nutritional and disease implications of different crop sequences and system intensities in SNSW GRDC Grains Research Update paper.
Kirkegaard J, Sprague S, Bell L, Swan T and Sandral G. (2020b) Dual purpose crops – direct and indirect contribution to profit. GRDC Grains Research Update paper.
Kirkegaard J, Sprague S, Bell L, Swan T and Dunn M. (2022) Dual-purpose crops – roles, impact and performance in the medium rainfall farming systems. GRDC Grains Research Update paper.
Swan et al., (2022) What is the N legacy following pulses for subsequent crops and what management options are important to optimise N fixation? GRDC Grains Research Update paper.
Appendix 1: determining earnings before interest and tax (EBIT)
To calculate the annual EBIT for all treatments, we have initially used the following assumptions/prices.
A. Expenditure
- All herbicides/fungicides/insecticides, seed dressings, fertilisers, GRDC levies and crop insurance costs were obtained from the annual NSW winter cropping guide or the annual SAGIT farm gross margin and enterprise planning guides with links at:
- All seed was priced according to purchasing as pure treated seed from seed companies. i.e. In 2019, prices used were wheat seed at $1/kg, faba bean seed at $1.20/kg, chickpea seed at $1.80/kg and canola seed ranging between $23-30/kg.
- All operations costs (sowing, spraying, spreading, haymaking, harvest) were based on the principal that a contractor performed the task. These costs were extracted from the yearly SAGIT Farm gross margin and enterprise planning guides. i.e. In 2019 prices used included sowing at $50/ha, ground spraying at $10/ha, cereal harvest at $70-85/ha, cut/rake/bale hay at $115/ha, with links at 2022 Farm Gross Margin and Enterprise Planning Guide
- All variety levies for all crops and varieties were determined from the variety central website at: (e.g. for pulses) http://www.varietycentral.com.au/varieties-and-rates/201920-harvest/pulse/
B. Income
- Wheat, barley and canola grain prices were obtained on the day of harvest from the AWB daily contract sheet for specific regions relating to trial location at: https://www.awb.com.au/daily-grain-prices
- Pulse grain prices were obtained on the day of harvest from Del AGT Horsham and confirmed with local seed merchants.
- Hay prices were obtained in the week of baling from a combination of sources including The Land newspaper and local sellers.
Appendix 2: determining grazing value
To determine the estimated value of grazing the early sown crops, we have used the following formulae:
Winter Grazing Value ($/ha) = Plant dry matter (kg) removed x Liveweight dressed weight (c/kg) x Feed conversion efficiency (0.12) x Dressing % (lambs) x Feed utilisation efficiency (0.75)
Dressed weight and value:
- Lambs = 22.9kg (3-year average of light, heavy and trade lambs)
- Dressed weight = $6.25/kg (3-year average NSW)
- Dressing percentage = 50%
An example of 45kg lambs grazing winter Hyola 970 canola:
3800kg plant DM removed x $6.25 x 0.12 x 50% x 0.75 = $1069/ha
Note:
· These calculations assume a 'trading margin' of zero – i.e. animals are bought and sold for the same price/kg
· We have not deducted a cost associated with the grazing livestock – this must be estimated and deducted for relevant enterprises (breeding, trading, etc)
Contact details
John Kirkegaard
CSIRO Agriculture and Food
Canberra
Ph: 0458 354 630
Email: john.kirkegaard@csiro.au
Twitter: @AgroJAK
Varieties displaying this symbol beside them are protected under the Plant Breeders Rights Act 1994
GRDC Project Code: CSP1703-007RTX, CSP2110-004RMX,
Was this page helpful?
YOUR FEEDBACK