Improved canola establishment via improved production of grower retained seed – preliminary results
Author: Col McMaster (NSW DPI), Danielle Malcolm (NSW DPI), Barry Haskins (AgGrow Agronomy & Research), Maurie Street (Grain Orana Alliance), Ben O'Brien (Grain Orana Alliance), Stuart Strahorn (NSW DPI), Allan Stevenson (NSW DPI), Steven Morris (NSW DPI) | Date: 24 Feb 2022
Take home message
- Select 1.8 mm seed or larger for improved crop establishment
- Larger the seed size, the greater the leaf area index per plant (quicker ground cover)
- Ensure seed-crop had adequate phosphorus (P) and be mindful of conditions that restrict P uptake within the seed-crop such as low soil P, rainfall distribution and P stratification
- Ensure seed-crop was largely derived from the main stem as opposed to lateral branches (i.e. high plant density greater than 40 plants/m2)
- Seed-crops should be direct headed, or at the very least windrowed late. Avoid seed-crops that have had glyphosate applied as a harvest aid or for weed control
- Source seed from regions of cooler/softer environments (east compared to west)
- Producing high vigour open-pollinated canola seed-lots is likely through a series of small incremental gains and includes agronomy, environment and most likely genetics.
Background
Open-pollinated canola varieties are grown on a significant area of the low to medium rainfall zone across Australia. Commonly growers produce open pollinated (OP) canola crops from retained seed, but poor establishment is commonly reported due to low vigour seed-lots. This project aims to firstly identify the key seed traits to improve canola establishment in grower retained seed, and to then develop an agronomy package that growers can adopt to produce high vigour open-pollinated canola seed-lots.
Canola seed has less energy reserves than larger-seeded crops and as a result, is more sensitive to poor establishment across a range of seasonal conditions and agronomic management strategies. Canola establishment has become an emerging issue over the past decade due to increased seed costs, reduced seeding rates, un-reliable autumn rainfall and sowing into marginal seedbed conditions.
Currently, grower retained canola seed is managed the same as a typical commercial paddock, except the largest seed is screened and retained. The actual sieve size used is normally determined by the ratio of total seed graded to how much seed is required for the following sowing. There is little to no understanding about the role of seed composition (i.e. oil percentage, protein percentage, starch, seed weight, seed nutrient content, fatty acid profile) to improve seed vigour and establishment.
This project aims to address the following research questions:
- What is the optimum nutrient strategy to produce high vigour seed-lots?
- Does foliar nutrition allow an opportunity to load up the seed with various nutrients to improve seed vigour/establishment?
- What type of canopy architecture produces larger seed?
- How important is spatial arrangement?
- Does reducing total bud number increase the carbohydrate supply to the remaining buds?
- How will harvest management impact next years seed vigour?
- Is there any difference between the various desiccation methods/products and timings?
Methods
Seed-crop agronomy experiments (Table 1) were sown in 2020 across four growing regions (Table 2), and included a range of nutrient, canopy, and harvest management experiments. The seed harvested from these experiments was graded to various seed sizes (>1.6mm, 1.6–1.8mm, 1.8–2.0mm, 2.0–2.2mm and >2.2mm) and evaluated via seed vigour testing (growth, stress and biochemical testing) and field establishment experiments at Condobolin in 2021 (Figure 1).

This report only includes results from the Condobolin field establishment experiments in 2021. Five separate experiments (Macro, Density, Foliar, Thinning and Harvest) were sown on May 7 using seed produced from the seed-crop agronomy experiments of 2020. This included 3 seed sizes (1.6–1.8mm, 1.8–2.0mm, 2.0–2.2mm) for each treatment across all 4 environments (Table 2). Experimental design was a randomised split bock design with four replications per experiment. Target plant density was 40 plants/m2 (assumed 50% field establishment) and sown at 3cm depth using a excel single disc sowing unit (rubber firming wheel with crumbler closing plate). Fertiliser was applied with the seed, at a rate of 45 kg/ha of mono ammonium phosphate (MAP). Seedbed moisture was adequate for even crop establishment. Plant counts were conducted 21 days after sowing, with ground cover assessments conducted 31 days after sowing via drone.
Table 1. Summary of seed-crop agronomy experiments conducted in 2020
Experiment | Treatment notes |
|---|---|
Macro-nutrient | Three treatment combinations of phosphorus (0, 12, 30 kg P/ha), sulphur (0 & 25 kg S/ha) and nitrogen (0, 40 and 120 kg N/ha). Fertiliser sources include triple superphosphate (phosphorus), gran-am (sulphur) and urea (nitrogen). |
Foliar nutrition | ControlA compared to the additional application of three foliar boron treatments and three broad-spectrum nutrient treatments. Application timing was GS50, GS60 and GS50 + GS60. Boron fertiliser source was Balance 32ZM at 2L/ha (5% Zn, 5.3% B and 0.23% Mo) and broad-spectrum nutrients was Foliar Boost at 5L/ha (NPKS 8-2-4-0). |
Plant density and distribution | Two treatment combinations of plant density (6,15 and 45 plants/m2) and spatial arrangement (even and random). Each plant density treatment was either randomly arranged or evenly distributed in a diamond pattern. |
Flower thinning | ControlA, 2 mechanical thinning treatments via slashing at GS50 and GS60, and 3 chemical thinning treatments (aim of preventing fertilisation on a proportion of flower sites) via application of ammonium thiosulphate at 30L/ha (Early = 14, 21, 28 and 35 DAFB, Mid = 21, 28 & 35 DAFB, Late = 28 & 35 DAFB). The aim is to reduce total bud number and hence increase the carbohydrate supply to the remaining buds |
Harvest management | Direct heading compared to three different methods (windrow, diquat and glyphosate) conducted at 25%, 50% & 75% seed colour change. |
A Control consisted of 100kg MAP/ha (50% with seed, 50% top-dressed and IBS), 80kg/ha Gran-am (top-dressed and IBS) and 150kg urea (top-dressed and IBS).
B DAF = Days after start of flowering
Table 2. Site details for seed-crop agronomy experiment sites in NSW, 2020.
Details | Central east (CE) (Canowindra) | Central west (CW) (Tottenham) | Southeast (SE) (Wagga Wagga) | Southwest (SW) (Griffith) |
|---|---|---|---|---|
Sow date | 16-Apr | 16-Apr | 16-Apr | 17-Apr |
Soil type | Red chromosol | Chromosol | Chromosol | Calcarosol |
Varietyb | ATR Bonitob | ATR Bonitob | ATR Bonitob | ATR Bonitob |
Previous crop | Wheat | Fallow | Wheat | Wheat |
Fallow rainfall | 218mm (-41a) | 252mm (+33a) | 192mm (+10a) | 189mm (+34a) |
In-crop rainfall | 513mm (+149a) | 343mm (+106a) | 404mm (+77a) | 298mm (+58a) |
Mineral N (0–90cm) | 290 kg/ha | 154 kg/ha | 348 kg/ha | 159 kg/ha |
Colwell P (0–10cm) | 71 mg/kg | 8 mg/kg | 50 mg/kg | 52 mg/kg |
KCl Sulphur (0–90cm) | 139 kg/ha | 444 kg/ha | 132 kg/ha | 82 kg/ha |
a) +/- from the long-term average
b) Same seed batch across all sites, freshly purchased ATR Bonito seed (250,000 seeds/kg) treated with Cruiser® Opti and Maxim® XL.
Table 3. Average monthly temperature and solar radiation from April–October across seed-crop agronomy sites in NSW, 2020.
Month | CE NSW (Canowindra) | CW NSW (Tottenham) | ||||||
|---|---|---|---|---|---|---|---|---|
Temperature | Solar radiation | Temperature | Solar radiation | |||||
Avg °C | +/- LTAa | MJ/m2 | +/- LTAa | Avg °C | +/- LTAa | MJ/m2 | +/- LTAa | |
Apr | 15.6 | -0.7 | 378 | -78 | 17.3 | -0.9 | 391 | -97 |
May | 11.3 | -0.9 | 318 | -23 | 12.6 | -1.1 | 345 | -27 |
Jun | 9.6 | 0.4 | 248 | -19 | 10.8 | 0.3 | 274 | -22 |
Jul | 8.9 | 0.6 | 273 | -30 | 10.0 | 0.4 | 298 | -39 |
Aug | 8.8 | -0.8 | 355 | -55 | 10.1 | -1.0 | 386 | -61 |
Sep | 12.8 | 0.5 | 482 | -47 | 15.5 | 1.4 | 502 | -65 |
Oct | 16.7 | 0.7 | 570 | -96 | 19.5 | 1.2 | 612 | -88 |
Month | SE NSW (Wagga) | SW NSW (Griffith) | ||||||
Temperature | Solar radiation | Temperature | Solar radiation | |||||
Avg °C | +/- LTAa | MJ/m2 | +/- LTAa | Avg °C | +/- LTAa | MJ/m2 | +/- LTAa | |
Apr | 15.0 | -1.2 | 356 | -85 | 16.1 | -0.7 | 373 | -85 |
May | 10.7 | -1.1 | 290 | -23 | 11.5 | -1.4 | 314 | -16 |
Jun | 9.0 | 0.2 | 209 | -33 | 10.2 | 0.3 | 229 | -30 |
Jul | 8.2 | 0.4 | 251 | -19 | 9.1 | 0.1 | 271 | -19 |
Aug | 8.8 | -0.3 | 316 | -57 | 9.8 | -0.6 | 328 | -68 |
Sep | 12.8 | 1.2 | 451 | -49 | 15.0 | 1.9 | 469 | -54 |
Oct | 16.4 | 1.3 | 542 | -109 | 18.3 | 1.6 | 577 | -92 |
a) +/- LTA = plus or minus from the long-term average
Results and discussion (Condobolin field establishment experiments 2021)
Impact of seed-crop growing environment on canola establishment
The growing season in 2020 could be described as a relatively soft season with mild temperatures, above average rainfall, and low solar radiation across all seed-crop agronomy sites (Table 2 and 3). However, the Griffith site experienced mild moisture stress during the months of May and June (52mm below long-term average rainfall for that period).
Seed produced in the 2020 season from the cooler/softer regions produced on average a 4% increase in canola establishment across 4 of the 5 experiments at Condobolin (2021). Table 4 illustrates that on average, both eastern sites had higher establishment compared to western sites, with the CE (62.3%) and SE (64.4%) achieving more than CW (59.9%) and SW (59.7%) sites.
It is hypothesised that seasonal conditions that experience high stress periods (moisture and/or temperature) during seed development will have negative effects on the following years seed vigour and canola establishment.
Table 4. Average canola establishment (%) and ground cover (%) across 5 agronomic experiments (Macro, Density, Foliar, Thinning and Harvest) and 4 growing environments (CE, CW, SE & SW) at Condobolin 2021
Site | Macro | Density | Foliar | Thinning | Harvest | Site average | ||||||
|---|---|---|---|---|---|---|---|---|---|---|---|---|
Est%a | GC%b | Est%a | GC%b | Est%a | GC%b | Est%a | GC%b | Est%a | GC%b | Est%a | GC%b | |
CE | 64.3 | 36 | 67.2 | 42.9 | 65.7 | 38.1 | 66.5 | 35.2 | 47.5 | 24.8 | 62.3 | 35.5 |
CW | 59.8 | 33 | 60.2 | 39.1 | 63.3 | 37.0 | 62.9 | 35.4 | 53.6 | 28.5 | 59.9 | 34.6 |
SE | 68.1 | 42 | 64.1 | 39.6 | 64.5 | 36.8 | 70.9 | 37.5 | 54.1 | 29.2 | 64.4 | 37.0 |
SW | 59.3 | 34 | 73.0 | 42.6 | 59.0 | 36.7 | 56.7 | 32.3 | 50.7 | 29.0 | 59.7 | 34.9 |
P-value | <0.001 | <0.001 | 0.004 | 0.657 | 0.313 | 0.959 | 0.003 | 0.082 | 0.002 | 0.028 | ||
5% l.s.d | 3.2 | 6.7 | 5.5 | 8.4 | 8.0 | 6.3 | 0.6 | 3.9 | 2.8 | 3.0 | ||
a) Est% = canola establishment %, b) GC% = ground cover %
Average impact of seed size on canola establishment
Seed size had a strong effect (P < 0.05) on canola establishment across all five experiments, and on average the 1.8 mm to 2.0 mm and greater than 2.0 mm seed size increased crop establishment by 4.3 and 5.8 percentage points respectively over the 1.6 mm. These results support current practise of retaining the largest seed size practically possible, and that much of the canola establishment benefits come from 1.8mm seed size and above.
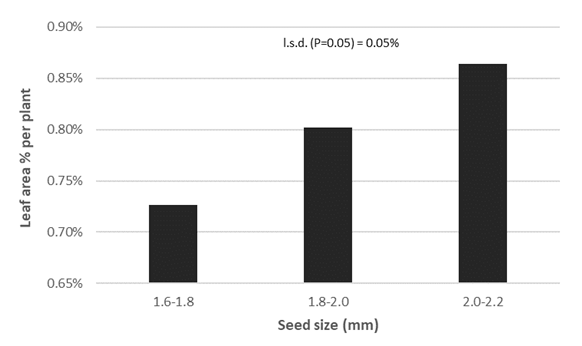
Total ground cover percentage improved with larger seed size and increased from 30.2% to 35.9% and 40.4% from 1.6 to 1.8 and 2.0 mm, respectively. Leaf area % per plant (ground cover % divided by plant density) at 31 days post sowing improved as seed size increased from 1.8 mm to 2.0 mm, with a respective increase of 10% and 19% over the 1.6 mm seed size (Figure 2).
Refer to macro nutrients section for further information on how seed-crop phosphorus improved performance of smaller seeds.
Table 5. Average canola establishment (Est%) and ground cover (GC%) effect of seed size across five agronomic experiments conducted at Condobolin 2021
Site | Macro | Density | Foliar | Thinning | Harvest | Site average | ||||||
|---|---|---|---|---|---|---|---|---|---|---|---|---|
Est%a | GC%b | Est%a | GC%b | Est%a | GC%b | Est%a | GC%b | Est%a | GC%b | Est%a | GC%b | |
1.6-1.8 mm | 58.3 | 29.9 | 63.8 | 36.3 | 59.6 | 31.7 | 61.6 | 29.9 | 47.9 | 23.2 | 58.2 | 30.2 |
1.8-2.0 mm | 63.9 | 36.8 | 66.3 | 41.3 | 64.0 | 37.5 | 65.4 | 35.4 | 52.9 | 28.3 | 62.5 | 35.9 |
2.0-2.2 mm | 66.4 | 42.0 | 68.2 | 45.5 | 65.9 | 42.3 | 65.7 | 40.0 | 53.7 | 32.1 | 64.0 | 40.4 |
P-value | <0.001 | <0.001 | <0.001 | <0.001 | <0.001 | <0.001 | 0.003 | <0.001 | 0.043 | <0.001 | ||
5% l.s.d. | 2.0 | 0.9 | 3.4 | 1.4 | 2.9 | 1.1 | 3.5 | 2.1 | 2.4 | 1.1 | ||
a) Est% = canola establishment %, b) GC% = ground cover %
Impact of macro nutrients and seed size on canola establishment
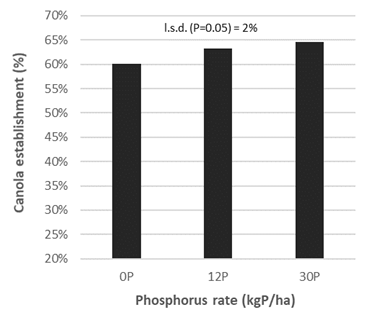
Averaged across all sites, phosphorus applied to the seed-crop had significant effect on the following years canola establishment whilst the impact of nitrogen and sulphur was negligible. Averaged across all sites, establishment increased from 60% to 64% and 65% respectively for 0P, 12P and 30P treatments (Figure 3). The 12P treatment provided the greatest improvement on canola establishment of 4 percentage points.
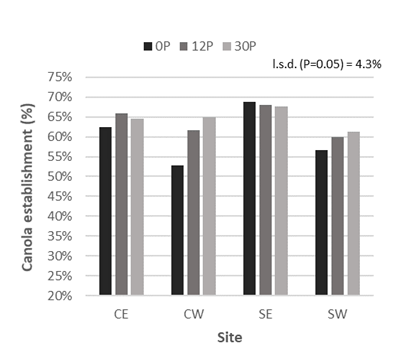
Magnitude of response varied between sites (Figure 4), and largely related to seed-crop Colwell P levels. The lower the seed-crop Colwell P, the greater the response (improved establishment) to applied P within the seed-crop. Figure 4 illustrates the difference between 0P and 30P was 12.1%, 4.6%, 1.6% and 1.1%, respectively across CW, SW, CE and SE. Refer to Table 2 for individual site Colwell P levels. It is probable that any circumstance that reduces P uptake will have the same effect, e.g. P stratification and/or rainfall distribution that doesn’t allow P uptake from the nutrient rich topsoil due to a dry surface.
Leaf area index per plant increased by 4 and 7 percentage points with 12P and 30P, compared to the 0P treatment.
In phosphorus deficient soils, there was a strong trend (P=0.09) that additional phosphorus applied to the seed-crop improved the following years establishment, particularly in smaller sized seeds. For example, Table 6 illustrates that small seed (1.6 mm) with phosphorus (30P) performs better than larger seed (1.8 mm) without phosphorus. Seed vigour testing has revealed nil P seed produced a greater percentage of abnormal seedlings that develop a ‘pig tail’ shaped hypocotyl, compared to 30P. Further evaluation is being conducted to determine the relationship between phosphorus and its effect on seed composition and abnormal seedling development.
Table 6. Relationship between seed-crop phosphorus (on Tottenham P deficient site) and seed size on the following years canola establishment at Condobolin 2021
Seed size | 0 Pkg/ha | 12 Pkg/ha | 30Pkg/ha |
|---|---|---|---|
1.6–1.8mm | 42.0% | 56.0% | 58.8% |
1.8–2.0mm | 53.0% | 59.0% | 63.8% |
2.0–2.2mm | 63.3% | 70.0% | 72.1% |
P-value | 0.093 | ||
5% l.s.d. | 7.0% | ||
Impact of plant density on canola establishment
Canola plant density is known to effect canopy architecture, with low plant density crops producing more seed yield from lateral branches, and high plant density crops producing more seed yield from main stem/upper canopy branches. Seed development and plant phenological variability within a plant is much greater in low plant density compared to high plant density populations. For example, seed might be filling on the main stem whilst still flowering on the lower lateral branches, providing a large range of crop development within the one plant.
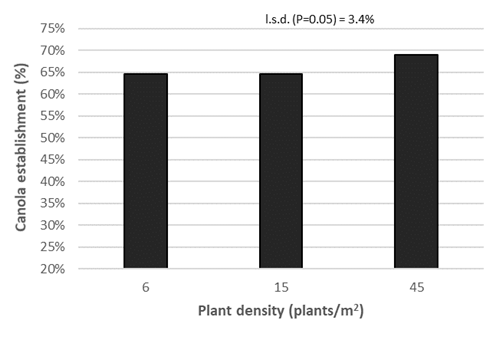
A high plant density treatment of 45 plants/m2 had approximately 4 percentage point improvement on canola establishment compared to the lower plant density treatment of 6 and 15 plants/m2 (Figure 5). This indicates that seed produced primarily from the main stem has better characteristics than seed developed from lateral branches. It is likely that the benefits of high plant density are due to a greater proportion of the plant flowering within the optimum flowering period compared to delayed development caused by low lateral branches in the lower plant density treatments. High plant density would have a greater proportion of pod sites flowering under lower stress conditions.
Interestingly spatial arrangement (random or even) of the seed-crop had no significant effect on canola establishment.
Impact of crop thinning techniques to improve canola establishment
Crop thinning is a technique used in horticulture crops to reduce crop load (bud number) with the intent of producing larger and more consistent fruit size. The aim is to reduce total bud number and hence increase the carbohydrate supply to the remaining buds.
This concept was applied to a canola seed-crop scenario to evaluate if seed size and quality could be improved using mechanical and chemical thinning techniques. Mechanical thinning was conducted via slashing at budding (GS50) and start of flowering (GS60), and chemical thinning treatments applied at various stages throughout the flowering period. The chemical thinning treatment relied on several applications of ammonium thiosulphate to burn the pollen tubes and hence prevent fertilisation occurring on a proportion of flower sites.
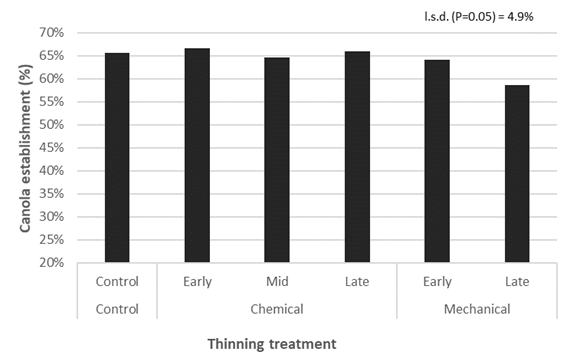
Neither mechanical or chemical thinning treatments had a positive effect on the following years canola establishment on any site, and the late mechanical treatment had an 8% reduction in canola establishment (Figure 6). It is likely that this reduction is due to flowering/grain fill occurring outside the optimum flowering period which disrupted seed development.
Impact of harvest management on canola establishment
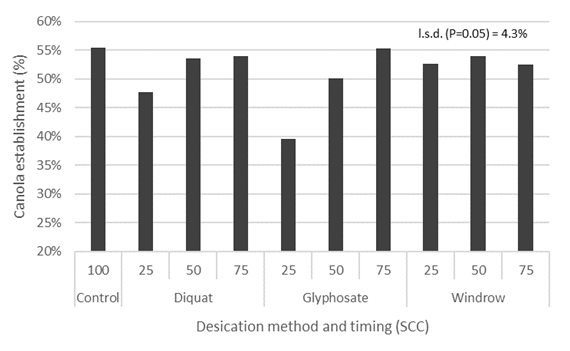
Harvest management had a significant effect on the following years canola establishment ranging from 23% to 72% and was influenced by desiccation method (P<0.001), desiccation timing (P<0.001) and the relationship between method and timing (P=0.003).
Averaged across all desiccation methods, seed derived from direct heading achieved the best establishment with 55%, and then reduced to 53% with windrowing, 52% with diquat and 48% with glyphosate.
For desiccation timings, the 25%, 50% and 75% seed colour change timing achieved establishment of 47% to 53% and 54%, respectively.
Figure 7 shows the relationship between desiccation method and timing, and the devastating consequence of getting the timing wrong for each method. For example, glyphosate applied at 25% seed colour change (SCC) reduced canola establishment by up to 15 percentage points.
Conclusion
Preliminary findings show that field establishment ranged from 23 to 72 per cent and was affected by seed size, seed-crop agronomy and growing environment. Averaged across all sites, field establishment increased by six percentage points as seed size increased from 1.6 to 2.0 millimetres diameter; five percentage points with additional phosphorus; four percentage points if the seed-lot was largely derived from the mainstem as opposed to the lateral branches (i.e., high seeding rate); and four percentage points if grown in regions with a cooler/softer environment.
Early indications are that improvements to field establishment via seed-crop agronomy are likely through a series of small incremental gains rather than one specific management operation. However, growers must be aware that harvest management can reduce a high vigour seed-lot to a low vigour seed-lot if the seed-crop is desiccated too early and/or glyphosate has been used as a harvest aid/weed control. All the good work gets undone in an instant!
These results suggest that canola establishment improved by selecting 1.8 mm seed size, however selecting an even bigger seed size has the additional benefit of producing a larger leaf area index per plant (by up to 19%). Therefore, successful canola establishment should not only be viewed as plants per m2, but also speed to attain ground cover and leaf area index per plant. A competitive crop has many advantages to the farming system and will suffer less yield loss at the hands of weeds, compared to an uncompetitive crop (WeedSmart Big 6).
References
WeedSmart (2022). Crop competition
Acknowledgements
The research undertaken as part of this project is made possible by the significant contributions of growers through both trial cooperation and the support of the GRDC, the authors would like to thank them for their continued support. Sincere appreciation to trial site hosts including Viridis Ag ‘Gindurra’ Canowindra, Jarvis family ‘Boona Mount’ Tottenham, Haskins family ‘Ridgetop’ Griffith, and staff from Wagga Wagga Agriculture Institute and Condobolin Agricultural Research and Advisory Station. Drone imagery and analysis conducted by StevTech is also gratefully acknowledged
Contact details
Colin McMaster
NSW Department of Primary Industries
Orange Agricultural Institute, 1447 Forrest Road, Orange NSW, 2800
Ph: 0427 940 847
Email: colin.mcmaster@dpi.nsw.gov.au
® Registered trademark
GRDC Project Code: DAN1906,
Was this page helpful?
YOUR FEEDBACK
