Phytophthora root rot and waterlogging in chickpeas – minimising risk and management options
Take home messages
- Waterlogging had a greater impact on chickpea yield compared to mild Phytophthora root rot (PRR) infection
- Chickpeas such as PBA HatTrick are affected more by waterlogging at a late vegetative growth stage (83% yield loss) than waterlogging at an early vegetative growth stage (26% yield loss)
- Late waterlogging plus PRR results in plant death and even greater yield losses (98%)
- Rainfall and irrigation volumes can be used to predict PRR yield losses, PBA Seamer with 250 mm of plant available water that received > 135 mm in-crop rainfall by flowering had yield losses of at least 40% and losses reached over 50% with pre flowering irrigation of 185 mm
- PRR yield loss information based on rainfall and irrigation volume can be used by growers to support decisions for forecasting yield loss when in-crop rainfall drives PRR infection.
Introduction
Phytophthora root rot (PRR) (P. medicaginis) causes significant yield losses in chickpea grown in the northern grain region being estimated to cost $8.2 million per year in wetter than normal seasons or following periods of soil saturation in normal seasons (Murray and Brennan, 2012). Although moderate field resistance is available in some chickpea varieties such as PBA HatTrick and PBA Seamer (MS resistance), substantial yield losses (up to 70%) can still occur under conditions highly favourable to disease development (high inoculum loads, poorly drained soils and high rainfall).
Environmental conditions are a major factor affecting Phytophthora epidemics, in particular the duration of free water in the soil influences the production and germination of sporangia by P. medicaginis (Pfender et al., 1977, Duniway, 1983). Soil-borne Phytophthora spp. produce sporangia under high soil moisture conditions, which release motile zoospores that infect roots causing severe disease. Phytophthora spp. require oxygen and during periods of soil saturation in many circumstances it is difficult to determine if crop damage is from PRR, waterlogging or a combination of both due to the effect of oxygen deprivation on both plant and pathogen (Erwin et al., 1983, Dron et al., 2022).
In order to understand when integrated disease management (IDM) practices may be successful or unsuccessful, we need to understand the scale of effects of waterlogging and PRR separately and as a combined effect. The ability to predict PRR induced yield loss could be used to reduce late season in-crop inputs, however, to achieve this objective the rainfall dependent PRR yield and economic loss relationship needs to be defined for PRR of chickpea. For PRR of chickpea we have no information quantifying rainfall volume and timing effects on the extent of yield loss.
Our research objective was to support in-crop management decisions by defining
- The scale of effects of waterlogging and PRR separately and as a combined effect on chickpea grain production; and
- The PRR yield and economic losses for volume effects of irrigation (as a surrogate for rainfall) on PRR epidemics.
How does early and late growth stage waterlogging and Phytophthora medicaginis affect chickpea root health and yield?
A shade house trial in Tamworth used 100 L bins as deep pots filled with potting media to capture the effects of early and late growth stage waterlogging in the presence and absence of PRR. The trial was sown on June 29, 2020. The bins were irrigated to provide 80% field capacity at a depth of 20 cm and were fertilised fortnightly. Experimental treatments were: chickpea lines (n = 4), waterlogging treatments (n = 3), and Phytophthora inoculation treatments (n = 2). Chickpea lines included the moderately resistant 04067 (Cicer echinospermum backcross breeding line), the moderately susceptible Yorker and PBA HatTrick, and the susceptible Rupali. The three waterlogging treatments were: non-waterlogged (media maintained at 80% field capacity); early vegetative growth stage waterlogging; and late vegetative growth stage waterlogging. The two PRR treatments were uninoculated or P. medicaginis (Pm) inoculated. A total of 4 replicates of each treatment combination were included in the experiment, with bins arranged according to a randomised complete block design (RCBD).
Following in furrow Pm inoculation (PBA HatTrick at 5 node stage) early waterlogging treatments were applied for five weeks during the early vegetative phase (PBA HatTrick at 6 node stage) and late waterlogging at the late vegetative phase (PBA HatTrick at 13 node stage). Once the control treatment had senesced, the experiment was then desiccated with glyphosate. Harvest measurements on 19 Oct., 2020 included: root health score (1 healthy - 9 dead) and grain weights.
The traits root health score and grain weight were analysed using linear mixed model in R statistical software. Significance testing was based on P < 0.05% and 95% confidence intervals calculated for treatment means.
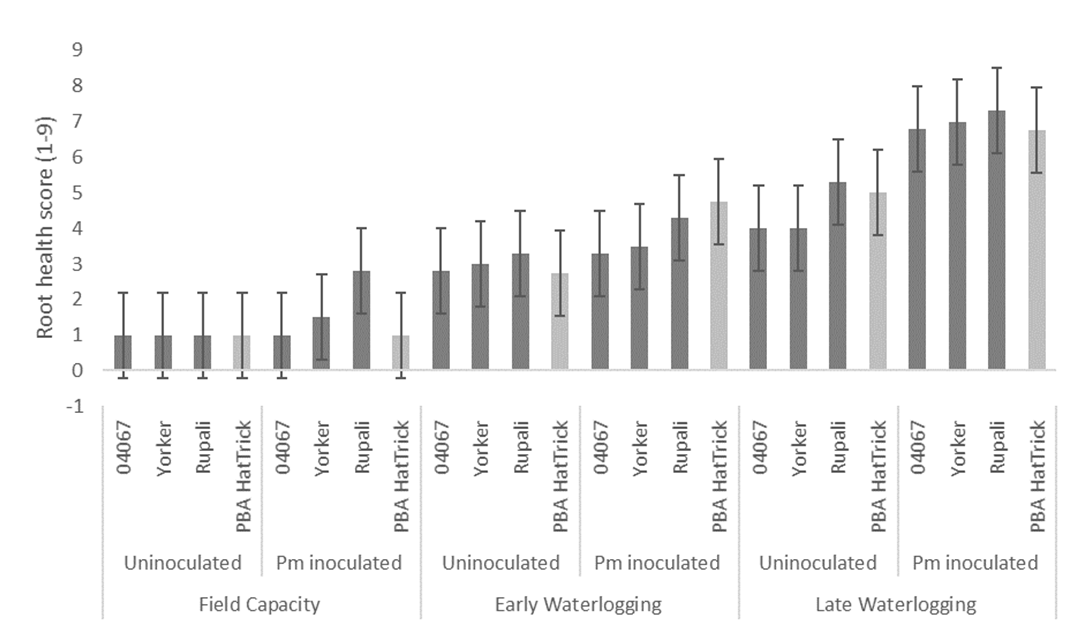
Results showed that the waterlogging treatments had the largest effect on root health in the experiment (F = 33.2, P < 0.001) compared to Phytophthora (F =10, P < 0.01) and chickpea line (F = 3, P < 0.01), with the three factors providing a significant interaction (P < 0.05). Root health score was significantly worse in PBA HatTrick following early waterlogging pm inoculated (4.8); late waterlogging uninoculated (5) and late waterlogging Pm inoculated (6.8), compared to the non-waterlogged uninoculated control (1) (Figure 1).

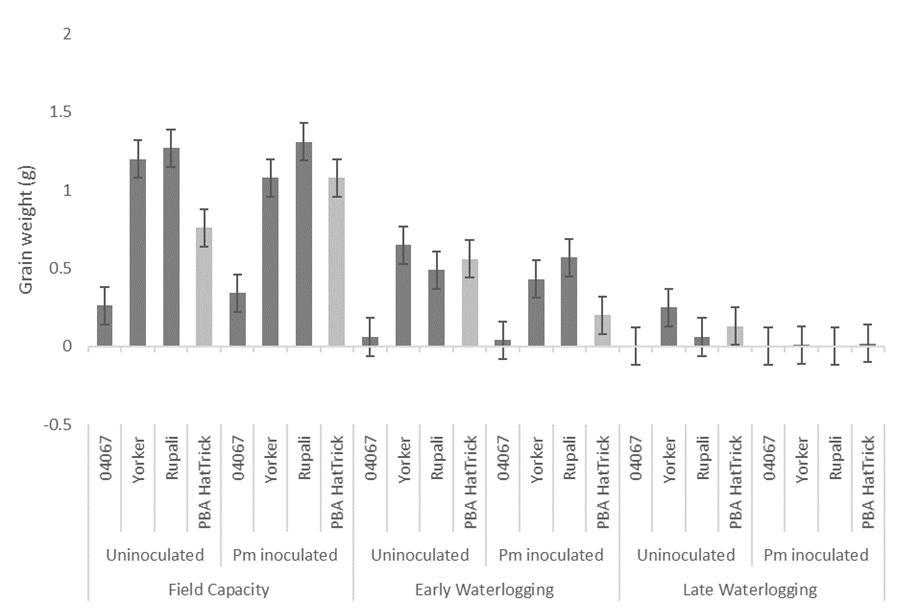
Waterlogging treatments also had a greater effect on grain weights in the experiment (F = 305, P < 0.001), followed by chickpea line (F = 32.7, P < 0.01) and Phytophthora (F =10, P < 0.01), with the three factors providing a significant interaction (P < 0.001). Grain weight of PBA HatTrick reduced from 0.8 g / plant in the control to 0.6 g / plant and 0.1 g / plant in the early waterlogging and late waterlogging, respectively (Figure 2). PBA HatTrick with waterlogging in combination with Pm resulted in further reductions with early waterlogging having 0.2 g / plant and later waterlogging 0.01 g / plant grain weight. None of the four lines examined were able to recover grain weight following either waterlogging treatment and the loss of grain weight was worse in the presence of Pm. Yield loss observed in the early waterlogging treatments was caused by plant stunting, whereas the late waterlogging lead to early senescence and plant death.

PBA HatTrick Pm inoculated in the absence of waterlogging had an unusually higher grain weight (1.1 g / plant) when compared to the control (0.8 g / plant) (Figure 2). The mild PRR infection in this experiment, in treatments without waterlogging, resulted in lines not performing as expected. Greater grain weight reductions are likely to be observed in the moderately susceptible Yorker, PBA HatTrick and susceptible Rupali under environments with greater Pm disease pressure. The reduced Pm disease pressure in the absence of waterlogging may have been attributed to the poor water holding capacity of the light soil media used within this experiment, which resulted in low levels of PRR infection. If moisture levels were higher for a longer duration following irrigation, we would expect to have caused greater root disease and grain reductions in Pm inoculated non-waterlogged treatments, particularly in the susceptible lines.
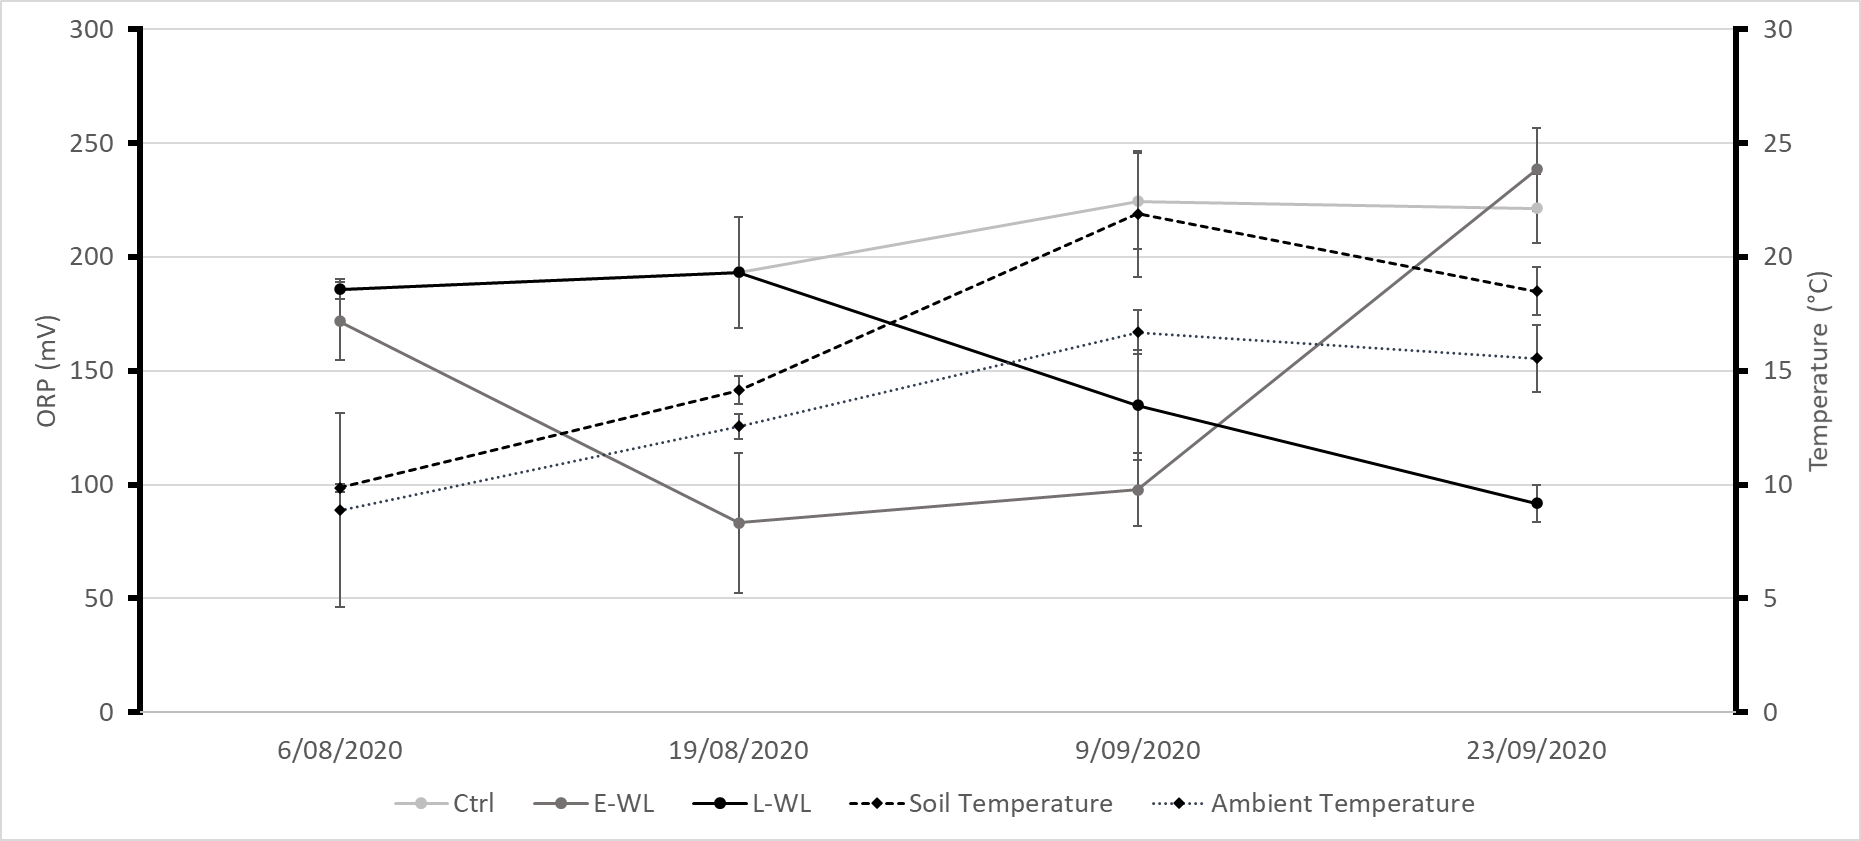
Chickpea plants will senesce and die following a severe late waterlogging event particularly during flowering as observed during the 2021 growing season in the northern grains region and as described previously by Cowie et al. (1996). Similarly in our experiment, for both waterlogging and Pm in combination with waterlogging, disease severity was worse in the late waterlogging treatments. This can be attributed to the physiological growth stage and increased requirements of the chickpea plants at higher temperatures later in the growing season. The final redox measures (indicator of waterlogging severity) were similar between early and late waterlogging treatments. However, the soil temperature and ambient temperature were 12.1°C and 7.8°C warmer during the late waterlogging treatment compared to the early waterlogging treatment, respectively (Figure 3). The warmer conditions with high moisture can favour rapid pathogen development and high respiration rates in the plant leading to rapid plant death.

Figure 3. Soil redox (Oxidation reduction potential, ORP) an indicator of oxygen availability, ambient and soil temperatures during early and late waterlogging treatments. E-WL: Early waterlogging, L-WL: late waterlogging, Ctrl: control.
How does rainfall (field irrigation) affect yield loss in chickpea across two soil types?
Field experiments in 15 m2 plots were conducted in 2018 and 2019 at the Hermitage Research Facility, Warwick. There were two non-irrigated control treatments with +/– Phytophthora inoculation (P. medicaginis oospores applied in-furrow at sowing) and nine irrigation treatments (ranging from 0-150 mm). Irrigation treatments were imposed at a single time point across all plus irrigation treatments plots (70 days after sowing in 2018 and 77 days after sowing in 2019). To prevent waterlogging, the delivery of irrigation occurred over a 72-hour period for both experiments. There were two desi chickpea genotypes; the PRR moderately susceptible PBA Seamer and the provisionally moderately resistant advanced breeding line, CICA1328. Both experiments contained four replicates of each treatment combination, arranged according to a randomised complete block design. Assessments included plant emergence, disease incidence, grain yield, and 100 seed weight.
In 2018, the experiment was conducted on a well-drained grey vertosol soil type of 90 cm depth which had a full sub-soil moisture profile at planting. In 2019, the experiment was performed on a moderately well drained black vertosol soil type with a depth of 120+cm with drought conditions dictating that only a partial sub-soil moisture profile was available at sowing.
Traits were analysed across both experiments using a linear mixed model framework, whereby treatments were included as fixed effects (irrigation volume treated as a continuous covariate) and terms to describe the experimental design structure were included as random effects. Additionally, random cubic smoothing spline effects were included to model the nonlinearity in trait response to irrigation volume. Models were fitted using the asreml-R package in the R statistical computing environment. Significance testing was based on P < 0.05% probability level.
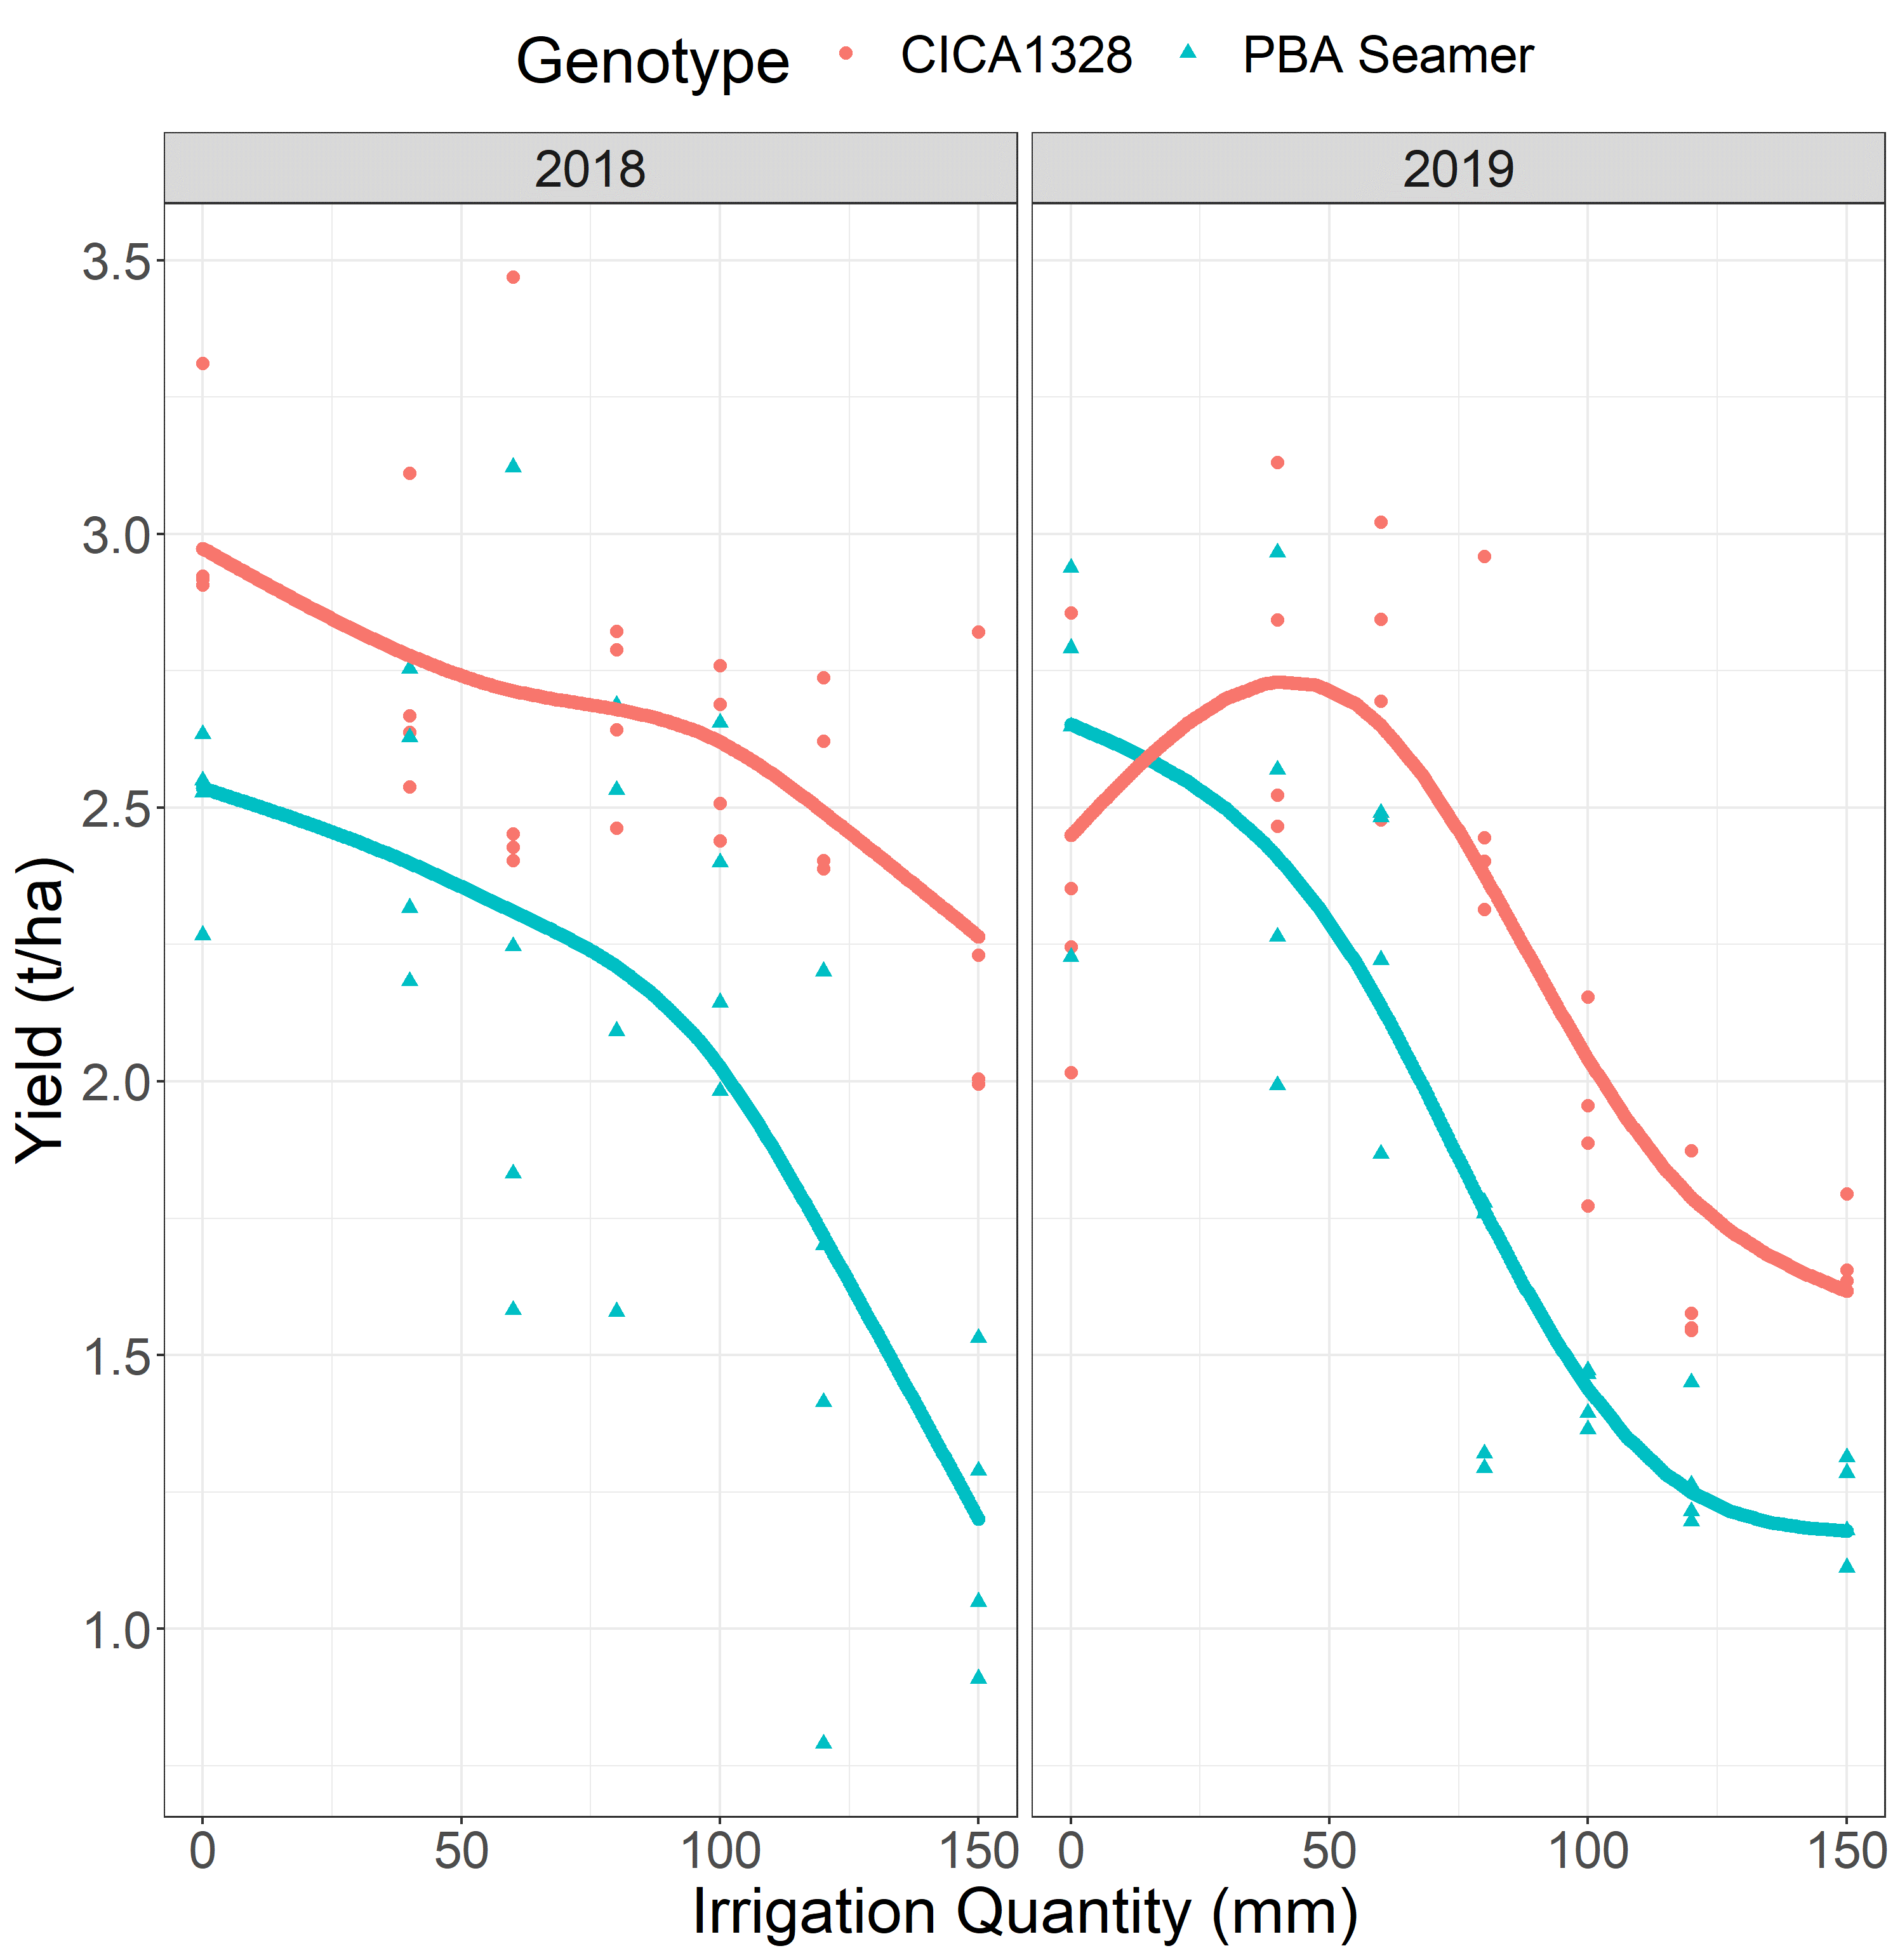
In the P. medicaginis inoculated treatments, significant yield losses resulted as a result of increasing irrigation volumes in both seasons, for both chickpea genotypes (Figure 4). In 2018 the two genotypes differed in yield by approximately 0.4 t/ha whenever equivalent irrigation volumes were above 70 mm. Yield differences of 1 t/ha were observed, in favour of the more resistant genotype, CICA1328, with irrigation volumes from 70 mm to 150 mm. In 2019 the two genotypes consistently differed for yield by approximately 0.4-0.6 t/ha across all irrigation volumes.

Figure 4. Yield response of PBA Seamer and CICA1328 to increasing irrigation volumes for Phytophthora medicaginis inoculated treatments in experiments in 2018 and 2019.
The Phytophthora irrigation yield loss relationships provided the ability to predict yield losses, with this information being useful to understand the extent of yield losses possible from seasonal weather conditions. Results from these experiments provide growers with a decision support tool regarding yield loss thresholds that can be expected when in-crop rainfall drives PRR infection (Figure 4). Findings also show that varieties with high levels of PRR resistance will yield more than susceptible varieties when in-crop rainfall is conducive to PRR.
Phytophthora yield loss outcomes were predicted for three rainfall plus irrigation volume scenarios from the two experiments (Table 1). The rainfall plus irrigation totals of >250 mm were realistic of wet winter seasons possible in the northern chickpea growing region of Australia. Predicted yield losses were greater than 50% in both years for PBA Seamer for the 150 mm maximum irrigation volume treatment, for CICA1328 a maximum yield loss of 34% was predicted for this treatment. A consistent finding for the three presented irrigation volumes was that CICA1328 required an approximate additional 50 mm of rainfall for yield losses to equal that of PBA Seamer.
Table 1. Predicted yields (t/ha) for two chickpea genotypes in Phytophthora medicaginis inoculated (+PRR) irrigation (I) volume experiments for three single irrigation treatments of 50, 100 or 150 mm in 2018 and 2019 at Hermitage Research Facility, Warwick. Rainfall plus irrigation (R +I) values provided to represent total water delivery for each experiment and treatment combination.
Year | Soil type | Genotype | Control yield | Yield | Yield | Yield |
|---|---|---|---|---|---|---|
2018 | Grey vertisol | PBA Seamer | 2.54 | 2.36 (7%) | 2.03 (20%)* | 1.2 (53%)* |
CICA1328 | 2.97 | 2.74 (8%) | 2.62 (12%) | 2.26 (24%)* | ||
2018 | In-crop R + I 1 | 185mm | 235mm | 285mm | 335mm | |
2019 | Black vertisol | PBA Seamer | 2.65 | 2.29 (14%)* | 1.44 (46%)* | 1.18 (56%)* |
CICA1328 | 2.45 | 2.71 (11% gain) | 2.04 (17%)* | 1.62 (34%)* | ||
2019 | In-crop R + I 1 | 100 mm | 150 mm | 200 mm | 250 mm |
1In-crop rainfall was 185mm in 2018, and 100mm in 2019. The in-crop rainfall is then combined with irrigation volumes applied 70 days after sowing in 2018 and 77 days after sowing in 2019 to determine In-crop R + I values.
2 Yield losses are % yield differences from the predicted control yield 0mm I + PRR
*Yield loss is significantly (P< 0.05) different from the predicted control yield for the 0mm I + PRR at the 5% probability level
Target yield groups are used by industry for profit forecasting. To assist with Phytophthora disease loss forecasting exercises, we predicted the rainfall plus irrigation volumes for yield groups of 1.5, 2 and 2.5 t/ha (Table 2). Different rainfall volumes were experienced during the two years of experimentation, with 2018 commencing with a wetter profile and experiencing an extra 85 mm of in-crop rainfall when compared to 2019. Depending on the yield group targeted, CICA1328 with improved PRR resistance could experience 36-106 mm more rainfall and still achieve the same yield group as PBA Seamer. As such, the improved PRR resistance of CICA1328 was worth more in the wetter year of 2018. These forecasts may be used to assist with critical in-season decisions in wet years, around whether to continue or abandon a crop when PRR infection is present, or to reduce late season crop inputs where appropriate.
Table 2. Predicted rainfall plus irrigation volumes (mm) for three yield (t/ha) groups for the two chickpea genotypes in Phytophthora medicaginis inoculated experiments in 2018 and 2019.
Year | Soil type | Genotype | Yield group | ||
|---|---|---|---|---|---|
2.5 t/ha | 2.0 t /ha | 1.5 t /ha | |||
2018 | Grey vertisol | PBA Seamer | 198 mm | 287 mm | 317 mm |
CICA1328 | 304 mm | >335 mm1 | >335 mm1 | ||
2019 | Black vertisol | PBA Seamer | 130 mm | 167 mm | 195 mm |
CICA1328 | 172 mm | 203 mm | >250 mm1 | ||
1 Yields <=2.0t/ha not observed for CICA1328
What does it mean for growers?
We showed that with a large pot experiment waterlogging alone can cause major losses in yield with the timing of waterlogging also having a major effect. Yield of PBA HatTrick was reduced by 26% and 83% following early waterlogging and late waterlogging, respectively. Our experiment also showed that in a scenario where both waterlogging and Pm inoculum is present in combination, further yield reductions will occur with 74% and 98% losses observed in PBA HatTrick after early and late vegetative waterlogging, respectively. Our findings are supported by waterlogging results of other crop species where waterlogging causes both physical root damage and physiological constraint reducing water and nutrient uptake, which in turn reduces the plant’s ability to overcome stress resulting in plant death (Colmer and Voesenek, 2009; Palta et al., 2010). In terms of understanding waterlogging effects in cropping paddocks, our findings show that the likelihood of plant survival and recovery is higher when waterlogging occurs during early growth stages in the absence of Pm inoculum.
Our field experiments using irrigation as a surrogate for rainfall showed fairly consistent genotype responses in two differing seasons on different soil types, although yield losses were higher on the black vertosol in the second season. These irrigation plus rainfall PRR disease yield loss responses can be used to predict potential yield losses on the basis of forecasted rainfall and may assist with either yield forecasting or determining when to cease further crop inputs in heavily PRR affected areas of paddocks. The yield loss prediction and yield group rainfall values may also assist with calculating the yield benefits from selecting varieties with improved PRR resistance for use in future seasons.
The field experiments were not able to include waterlogging treatments. If substantial waterlogging occurs in fields with high PRR inoculum risk, we expect that the level of grain yield losses will be more substantial than those reported here for PRR in the absence of waterlogging.
References
Colmer, T and Voesenek, L (2009) Flooding tolerance: suites of plant traits in variable environments. Functional Plant Biology, 36: 665-681.
Cowie, AL, Jessop, RS and MacLeod, DA (1996) Effects of waterlogging on chickpeas I. Influence of timing of waterlogging. Plant and Soil, 183,: 97-103, doi:10.1007/bf02185569.
Dron, N, Simpfendorfer, S, Sutton, T, Pengilley, G and Hobson, K (2022) Cause of Death: Phytophthora or Flood? Effects of Waterlogging on Phytophthora medicaginis and Resistance of Chickpea (Cicer arietinum). Agronomy, 12: 89.
Duniway, JM (1983) Role of physical factors in the development of Phytophthora diseases. In Phytophthora: Its Biology, Taxonomy, Ecology, and Pathology, Erwin, D.C., Bartnicki-Garcia, S., Tsao, P.H., Eds.; American Phytopathological Society: St Paul; pp. 175-187.
Erwin, DC, Bartnicki-Garcia, S, Tsao, PH (Eds.) (1983) Phytophthora : its biology, taxonomy, ecology, and pathology. American Phytopathological Society: St. Paul; p. 392.
Murray, GM and Brennan, JP (2012) The Current and Potential Costs from Diseases of Oilseed Crops in Australia; GRDC Research Code, CER00002; Grains Research and Development Corporation. ; p. 92.
Palta, JA, Ganjeali, A, Turner, NC and Siddique, KHM (2010). Effects of transient subsurface waterlogging on root growth, plant biomass and yield of chickpea. Agricultural Water Management, 97: 1469-1476, doi:http://dx.doi.org/10.1016/j.agwat.2010.05.001.
Pfender, WF, Hine, RB and Stanghellini, ME (1977) Production of sporangia and release of zoospores by Phytophthora megasperma in soil. Phytopathology67:657-663.
Acknowledgements
The research undertaken as part of these projects was made possible by the significant contributions of growers and through the support of the GRDC, The Department of Agriculture and Fisheries and NSW DPI. Both projects were undertaken as part of project DAN00213: Grains Agronomy & Pathology Partnership (GAPP) - A strategic partnership between GRDC and NSW DPI.
Nicole Dron is a PhD student enrolled through the University of Adelaide with the support of supervisors Dr. Tim Sutton (SARDI and the University of Adelaide) and Dr. Kristy Hobson (NSW DPI). NSW DPI plant pathologists Dr. Steven Simpfendorfer and Dr. Kevin Moore have been instrumental in advising on method development and experience throughout the project. Nicole would like to thank all involved for their continued support.
Contact details
Nicole Dron
NSW DPI
4 Marsden Park Rd, Tamworth, NSW 2340
Ph: 02 63671293
Email: nicole.dron@dpi.nsw.gov.au
Sean Bithell
NSW DPI
4 Marsden Park Rd, Tamworth NSW 2340
Ph: 0429 201 863
Email: sean.bithell@dpi.nsw.gov.au
Varieties displaying this symbol beside them are protected under the Plant Breeders Rights Act 1994.
GRDC Project Code: DAN00213,
Was this page helpful?
YOUR FEEDBACK
