Making nutrition decisions in high-cost environments
Author: James Hagan (Department of Agriculture and Fisheries Queensland), Lindsay Bell (CSIRO Agriculture and Food ) | Date: 08 Mar 2022
Take home messages
- At average fertiliser costs, return on investment to nitrogen applications exceed 5:1, i.e. every dollar spent on nitrogen results in $5 of additional profit
- When N prices double, growers are still receiving $2.10 in profit for every dollar spent on nitrogen, and at triple the cost nitrogen is still expected to return $0.85 in additional profit for every dollar spent
- With higher N prices profitable N responses to winter cereals are only expected under favourable grain prices or seasonal conditions
- Soil testing and precision/variable nutrient application become more valuable as nutrition costs rise.
Background
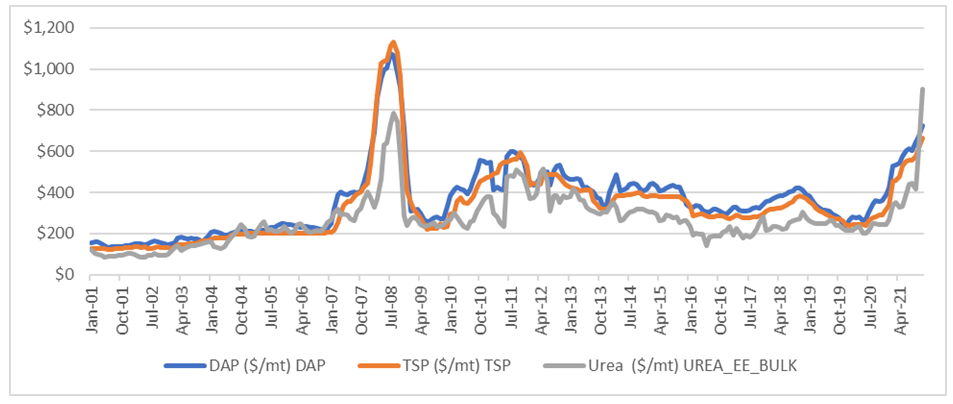
Nitrogen (N) and phosphorus (P) are key nutrients in Australian cropping systems and in typical operating environments are among the largest variable input costs for grain producers. In 2021-22 rapid and large increases occurred in in fertiliser pricing. Urea prices are up over 200% and DAP/MAP up over 100% in the 12 months to November (Figure 1).
These current prices pose a challenge for grower decision making, many of whom may have paddocks with low N levels following high yielding winter crops in 2021.
Whether fertiliser is priced at $450/t or $1,350/t, understanding why it is being applied is essential. Specifically, what are you trying to achieve in terms of both yield and protein, how will the application of fertiliser help you meet that goal, and what is the impact of that on profit. High fertiliser prices increase the economic importance of decisions relating to nutrient applications. Finding the appropriate nutrition application rate will have a greater impact on profit than in years with more typical prices. This makes the benefits of soil testing and variable application to optimise yield and protein outcomes more significant.

Economics of N application – price and recovery effects
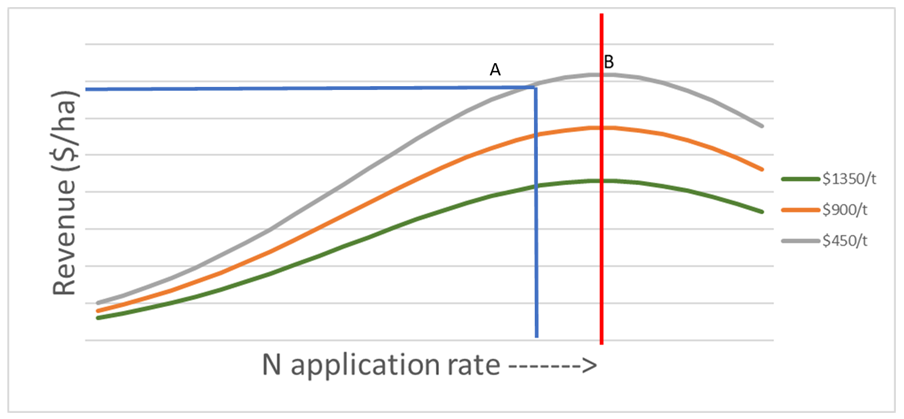
Economically optimal nutrition application is calculated as the point when marginal cost is equal to marginal return, i.e. when $1 of additional nutrient results in $1 in additional return (Point A, Figure 2). In nutrient response curves this point of optimisation is typically at a point lower than the fertiliser required to achieve maximum yield (Point B, Figure 2).
Whilst it might be expected that significant increases in prices for key nutrients would lead to a lower optimal application amount, this logic overlooks that we are typically in a moisture limited farming system, therefore our optimal N rates are typically matched to the point required to meet our water limited yield potential, or a percentage of this potential to allow for yield limiting factors such as disease, weeds, etc. Where available N is lower than this expected yield potential, as long as the cost of applying N does not exceed the value of the yield it generates then it is worth doing.
Figure 2. Revenue curves to nitrogen application at varying urea prices where A = point when marginal cost is equal to marginal return and B = fertiliser required to achieve maximum yield.
At long term average urea prices ~$450/t, and long-term average wheat price of $295/t, whilst using a rule of thumb that each tonne of yield potential needs 40kg of available N, the average return to N application exceeds 5:1 (Table 1). Whilst N responses are not linear, they can be treated as such until high rates where we reach diminishing returns. At lower rates, the response curve is close enough to linear that a general rule of thumb can be useful for N budgeting for crops.
It is thought that in good conditions approximately 80% of applied N fertiliser is available for plant uptake. However recent research in northern farming systems this figure is more commonly estimated at 15% in the year of application, whilst an average of 65% being left in the soil for subsequent crops and the remainder lost through different loss pathways. Based on past work by Dr Wayne Strong and Dr Mike Bell, total winter losses typically average 15-20%, whilst summer losses are higher at 20-40% (
There is some uncertainty about the proportion of N applied that is utilised by a crop due to soil, seasonal and other management decisions. Given this uncertainty, in Table 1 we explore how much the value, along with urea price influences the return on investment from N fertiliser applications.
Table 1. Return on Investment to N application at various pricing and applied N recovery rates.
Applied N recovery | ||||
|---|---|---|---|---|
Urea pricing ($/t) | 80% | 60% | 40% | 20% |
450 | 6.29 | 5.87 | 5.04 | 2.54 |
540 | 5.03 | 4.62 | 3.78 | 1.28 |
675 | 3.78 | 3.36 | 2.53 | 0.03 |
900 | 2.52 | 2.10 | 1.27 | -1.23 |
1125 | 1.77 | 1.35 | 0.52 | -1.98 |
1350 | 1.26 | 0.85 | 0.01 | -2.49 |
1800 | 0.63 | 0.22 | -0.62 | -3.12 |
2250 | 0.26 | -0.16 | -0.99 | -3.49 |
Note: These ROI’s to N are calculated by increasing applied N rates to ensure that the crop available N is 40kg per tonne of grain yield.
If we only counted the 20% recovered in the year of application, then once N doubles in cost it would no longer be worthwhile continuing N applications. However, this ignores that up to 60% of that applied N is not lost to the grower and will provide yield benefits in the following season, thus it is best to look at total recovery for N decisions.
As an example of this, at a urea price of $900/t it is not economic to apply N at a total recovery of 20%, in the season of application, needing to put down 100kg of N for every 20kg required to be available by the plant, results in losing $1.23 for every kg of N accessible N applied. However, once the following crops access to this N is accounted for, we’re now making $2.10 per kg of N applied. So in this instance if we had not applied N due to low recovery in year of application we would be $2.10 worse off overall.
It is worth noting that despite significant potential differences in how much N applied may be available to crops this rarely shifts the relative economics of applying fertiliser N dramatically. At 60% availability for applied N urea is still generating a positive return on investment of 2.1 at double ($900/t) and 0.85 at triple ($1350/t) pricing respectively. As prices rise above this point it approaches the point where N applications on cereal crops are expected to be un-economic, even accounting for recovery in future crops, with the risk of lower-than-expected recovery further increasing the expected losses.
When considered in this context, it should come as little surprise that the optimal rate of nutrition doesn’t change until the point at which return on investment approaches zero. However, while the optimal N rate remains the same across price points, the level of profit generated at this optimal point is reduced as fertiliser costs increase. (Figure 2 and Table 3).
What this means is that nutrition decisions should continue to be driven by underlying agronomic principals of source, timing, rate and placement. Whilst increased prices may impact each of these factors in different ways i.e., increasing urea costs may make feedlot manure a more attractive source to growers further away from feedlot, supply is going to be a major consideration.
Scenario analysis
Using CropARM (http://www.armonline.com.au/) it is possible to compare different cropping nutrition scenarios across a range of possible seasonal conditions. Past research has shown that soils in northern farming systems typically mineralise between 50 kg and 100 kg of nitrogen over the summer months (Cox and Strong, 2015).

With good early summer rain across many regions, we can assume largely full profiles of moisture. CliMateApp (https://climateapp.net.au/A04_HowWetN) supports this assumption, suggesting 88% full profiles from rainfall over late spring and early summer throughout much of northern NSW.
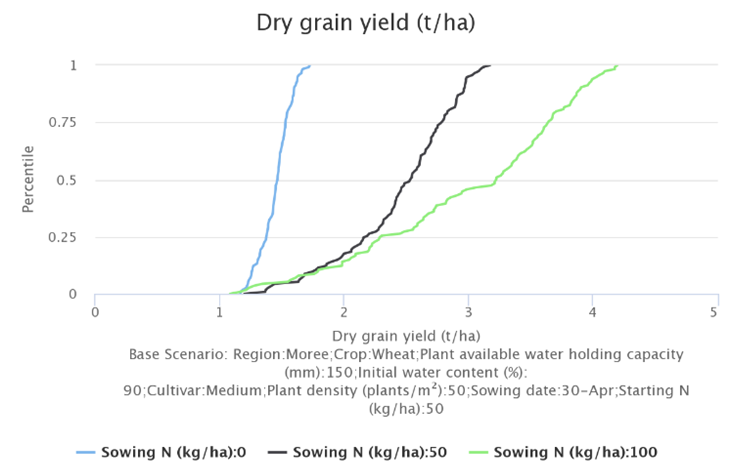
Using this information, assuming 50kg of mineralisation, Figure 3 contrasts the expected yield results of applying 0, 50 and 100kg of Nitrogen to a soil with 150mm plant available water capacity (PAWC) at 90% capacity, on 30 April plant date, at Moree.
The cumulative distribution shows that the 50 kg of mineralised N has a 50% chance of achieving 1.5 t/ha or better, while having an additional 50 kg of N at sowing increases this to a 50% chance of 2.5 t/ha or better and having 100 kg of additional N gives a 50% chance of 3.2 t/ha or better. However, it also demonstrates that in the driest 25% of years (i.e. 1 in 4) there may not be a yield difference between applying 50 or 100kg of additional N.
Gross margin analysis
Given other inputs will largely remain the same we can then compare the scenarios at a gross margin level, to each other and to different price points for nutrition. Whilst prices of some chemicals (i.e. glyphosate), have increased at the same time as increases to nutrition, this analysis will use an average price to highlight the impact of nutrition changes Table 2.
Table 2. Average wheat variable production costs, excluding nutrition
Activity | Average cost |
|---|---|
Fallow management ($/ha) | $43 |
Planting ($/ha) | $59 |
Crop protection ($/ha) | $77 |
Harvest ($/ha) | $86 |
Other (levy/insurance/etc) ($/ha) | $30 |
Total excluding nutrition ($/ha) | $295 |
The analysis used 10-year average wheat price ($295/t) for all scenarios and compared average urea ($450/t) and mono-ammonium phosphate MAP ($800/t) prices against those prices quoted in November 2021 for urea ($1,350/t) and (MAP, $1,800/t), when applied at the three different rates (0, 50 and 100 kg of applied N).
Using the predicted median yield of 3.2 t/ha from a full profile with 100 kg of N applied, and an applied N recovery rate of 60% in a year with average costs, we would expect a gross margin of over $450/ha using historical pricing.
In 2022 with the same inputs, yields and grain prices this gross margin would be more than halved to just $124/ha. Meanwhile, reducing the N applied to 50kg N, and 0 applied N would be expected to have gross margins of $162, and $170/ha respectively.
Table 3. Gross margin comparison of 3 scenarios at $1350/t urea vs average input costs at $295/t grain price assuming 60% recovery of applied N fertiliser
Average pricing | 2022 pricing | |||
|---|---|---|---|---|
N applied (kg/ha) | 100 | 100 | 50 | 0 |
Median yield prediction (t/ha) | 3.20 | 3.20 | 2.50 | 1.70 |
Income ($/ha) | $944 | $944 | $738 | $501 |
Non-nutrition costs ($/ha) | $295 | $295 | $295 | $295 |
MAP cost (20kg) ($/ha) | $16 | $36 | $36 | $36 |
Urea cost ($/ha) | $166 | $489 | $244 | $0 |
Gross margin ($/ha) | $467 | $124 | $162 | $170 |
At grain prices of $350/t or a yield outcome for the best 25% of seasons, the expected gross margins at 2022 input prices are once again positive to N application with $300, $299 and $264/ha expected for 100N, 50N and 0N scenarios respectively.
Unfortunately predicting existence of a price, especially those relying on a protein premium at harvest is extremely challenging, as an example of this, the spread from APW to APH2, increased from ~$15/t in September, to ~$50 in November (Table 4), based on widespread downgrades due to harvest rain.
Table 4. Grain prices by grade (AUD $/t) September vs November 2021 – (GrainCorp, Dalby)
Grain grade | Sep-21 | Nov-21 |
|---|---|---|
APH2 | 304 | 371 |
H2 | 294 | 327 |
APW | 290 | 317 |
AGP1 | 289 | 257 |
Alternative nutrition sources
One side effect of increases in urea and MAP/DAP prices is that other nutritional sources may be more attractive. For example, feedlot manure becomes a more economic option for producers located much further away from the source than usual. However, there is ~500,000t of feedlot manure generated in Queensland annually (Hagan 2018), which assuming an N requirement of 100 kg/ha would be enough to cover approximately 80,000 hectares.
Alternative crop options
With N prices high, growers may be considering adding additional pulses to their rotation, either to reduce their N requirements for the coming season, or supply N for following crops. Whilst pulse crops will reduce total program N requirements in the season they are grown, results from farming systems sites suggest that additional legume crops in the sequence have had variable impact on following soil mineral N availability (Erbacher et al., 2020). In situations where pulses were planted on profiles with high available nitrogen, they are unlikely to fix substantial inputs of additional N, and under high yielding conditions export large amounts of N in their grain. The most important aspect of whether there will be any benefit of planting a pulse crop for its nitrogen contribution is knowing the starting soil mineral N it is being planted into.
Table 5. Comparison of N mineralisation during subsequent fallows following pulse crops vs wheat in northern region farming systems experiments
Site + Season | Crop | Subsequent fallow mineral N accumulation (kg/ha) |
|---|---|---|
Emerald 2015 | ||
Wheat | 94 | |
Chickpea | 94 | |
Emerald 2016 | ||
Wheat | 102 | |
Chickpea | 118 | |
Pampas 2015 – long fallow | ||
Wheat | 62 | |
Faba bean | 97 | |
Chickpea | 100 | |
Field pea | 123 | |
Canola | 90 | |
Pampas 2016 – short fallow | ||
Wheat | 44 | |
Chickpea | 42 | |
Summary
When returns to N are positive, optimal rates for maximum gross margin returns remain largely unchanged irrespective of price, however the total profit and return on investment at this optimal rate will decline as nutrition costs increase. When N prices result in negative returns to N, the economic optimal amount from a single year gross margin point of view will be 0.
Hence, having a good understanding of your existing N levels through soil testing is now worth at least 3 times as much in 2022 as previous seasons. High N prices also make practices that improve efficient use of N more important to consider, with savings via variable rate and budgeting or applying fertiliser to better match crop demand more critical.
Using conservative prices and yields it is easy to see scenarios where negative returns to nitrogen applications in this season to many winter cereal crops are possible, however with good yields or above average prices, positive economic responses to N are still possible in 2022.
Finally, it is worth keeping in mind that the analysis in this paper has focused on N responses in a single season, there are legacy system impacts to fertiliser application which may only be observed in future years. For example, wider adoption of pulses will result in lower ground cover and future fallow soil water accumulation, or lower fertiliser application rates may result in a faster decline in soil organic matter, which will have impacts on soil N mineralisation for years to come.
References
Angus, J, and Grace, P (2017) Nitrogen balance in Australia and nitrogen use efficiency on Australian farms. Soil Research, 55(6), p.435.
Cox, H and Strong, W (2015) The nitrogen book, Principles of soil nitrogen fertility management in southern Queensland and northern New South Wales farming systems, pp12
Erbacher, A, Gentry, J, Bell, L, Lawrence, D, Baird, J, Dunn, M, Aisthorpe, D and Brooke, G (2020) Nitrogen and water dynamics in farming systems – multi-year impact of crop sequences
Hagan, J (2018) Feedlot Manure as Fertiliser
Acknowledgements
The research undertaken as part of this project is made possible by the significant contributions of growers through both trial cooperation and the support of the GRDC, the author would like to thank them for their continued support.
Contact details
James Hagan
Department of Agriculture and Fisheries
13 Holberton St, Toowoomba, 4350
Ph: 0476 828 018
Email: james.hagan@daf.qld.gov.au
GRDC Project Code: DAQ2007-002RTX,
Was this page helpful?
YOUR FEEDBACK
